Paid Ads Attribution
Usermaven’s Paid Ads Attribution feature helps you track and analyze how your ads perform across different networks. It shows key metrics like ad spend, impressions, clicks, and conversions, along with the revenue attributed to each campaign. By breaking down performance by source and campaign, you can quickly pinpoint which ads and campaigns drive the best results.
Pre-requisites
Before you begin, please complete these steps:
Once your Ad Networks are connected and a conversion goal is set up, you're ready to begin analyzing your paid ads' performance!
Navigating Paid Ads Attribution
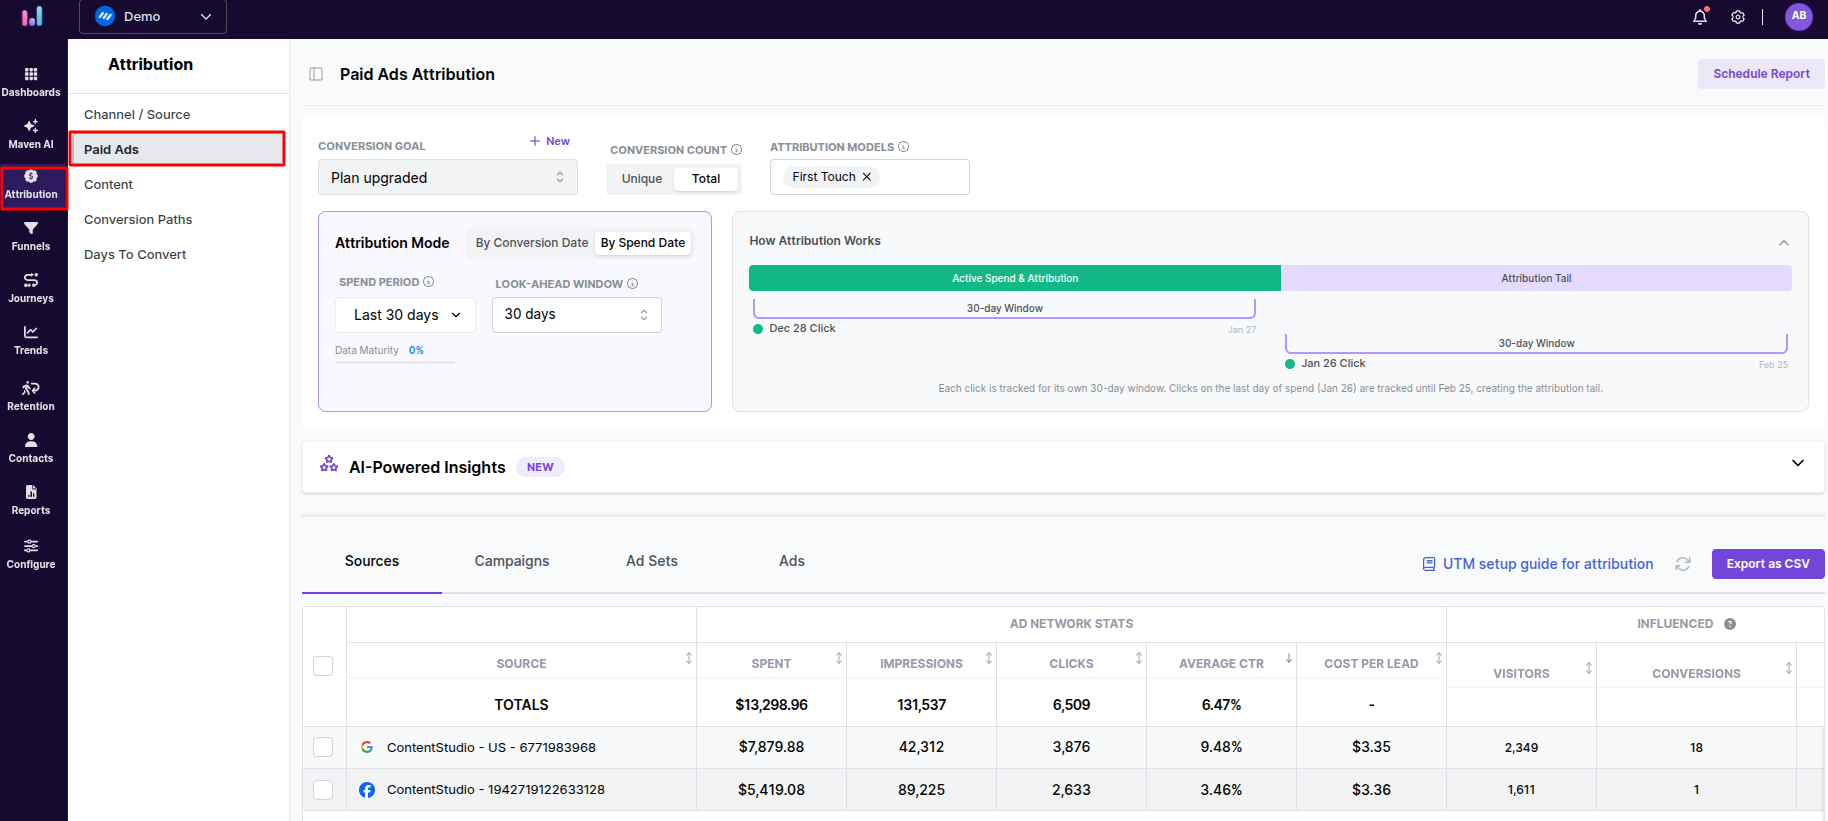
Log in to Usermaven and click “Attribution > Paid Ads” on the left panel to open the "Paid Ads Attribution" dashboard.
Set up a conversion goal
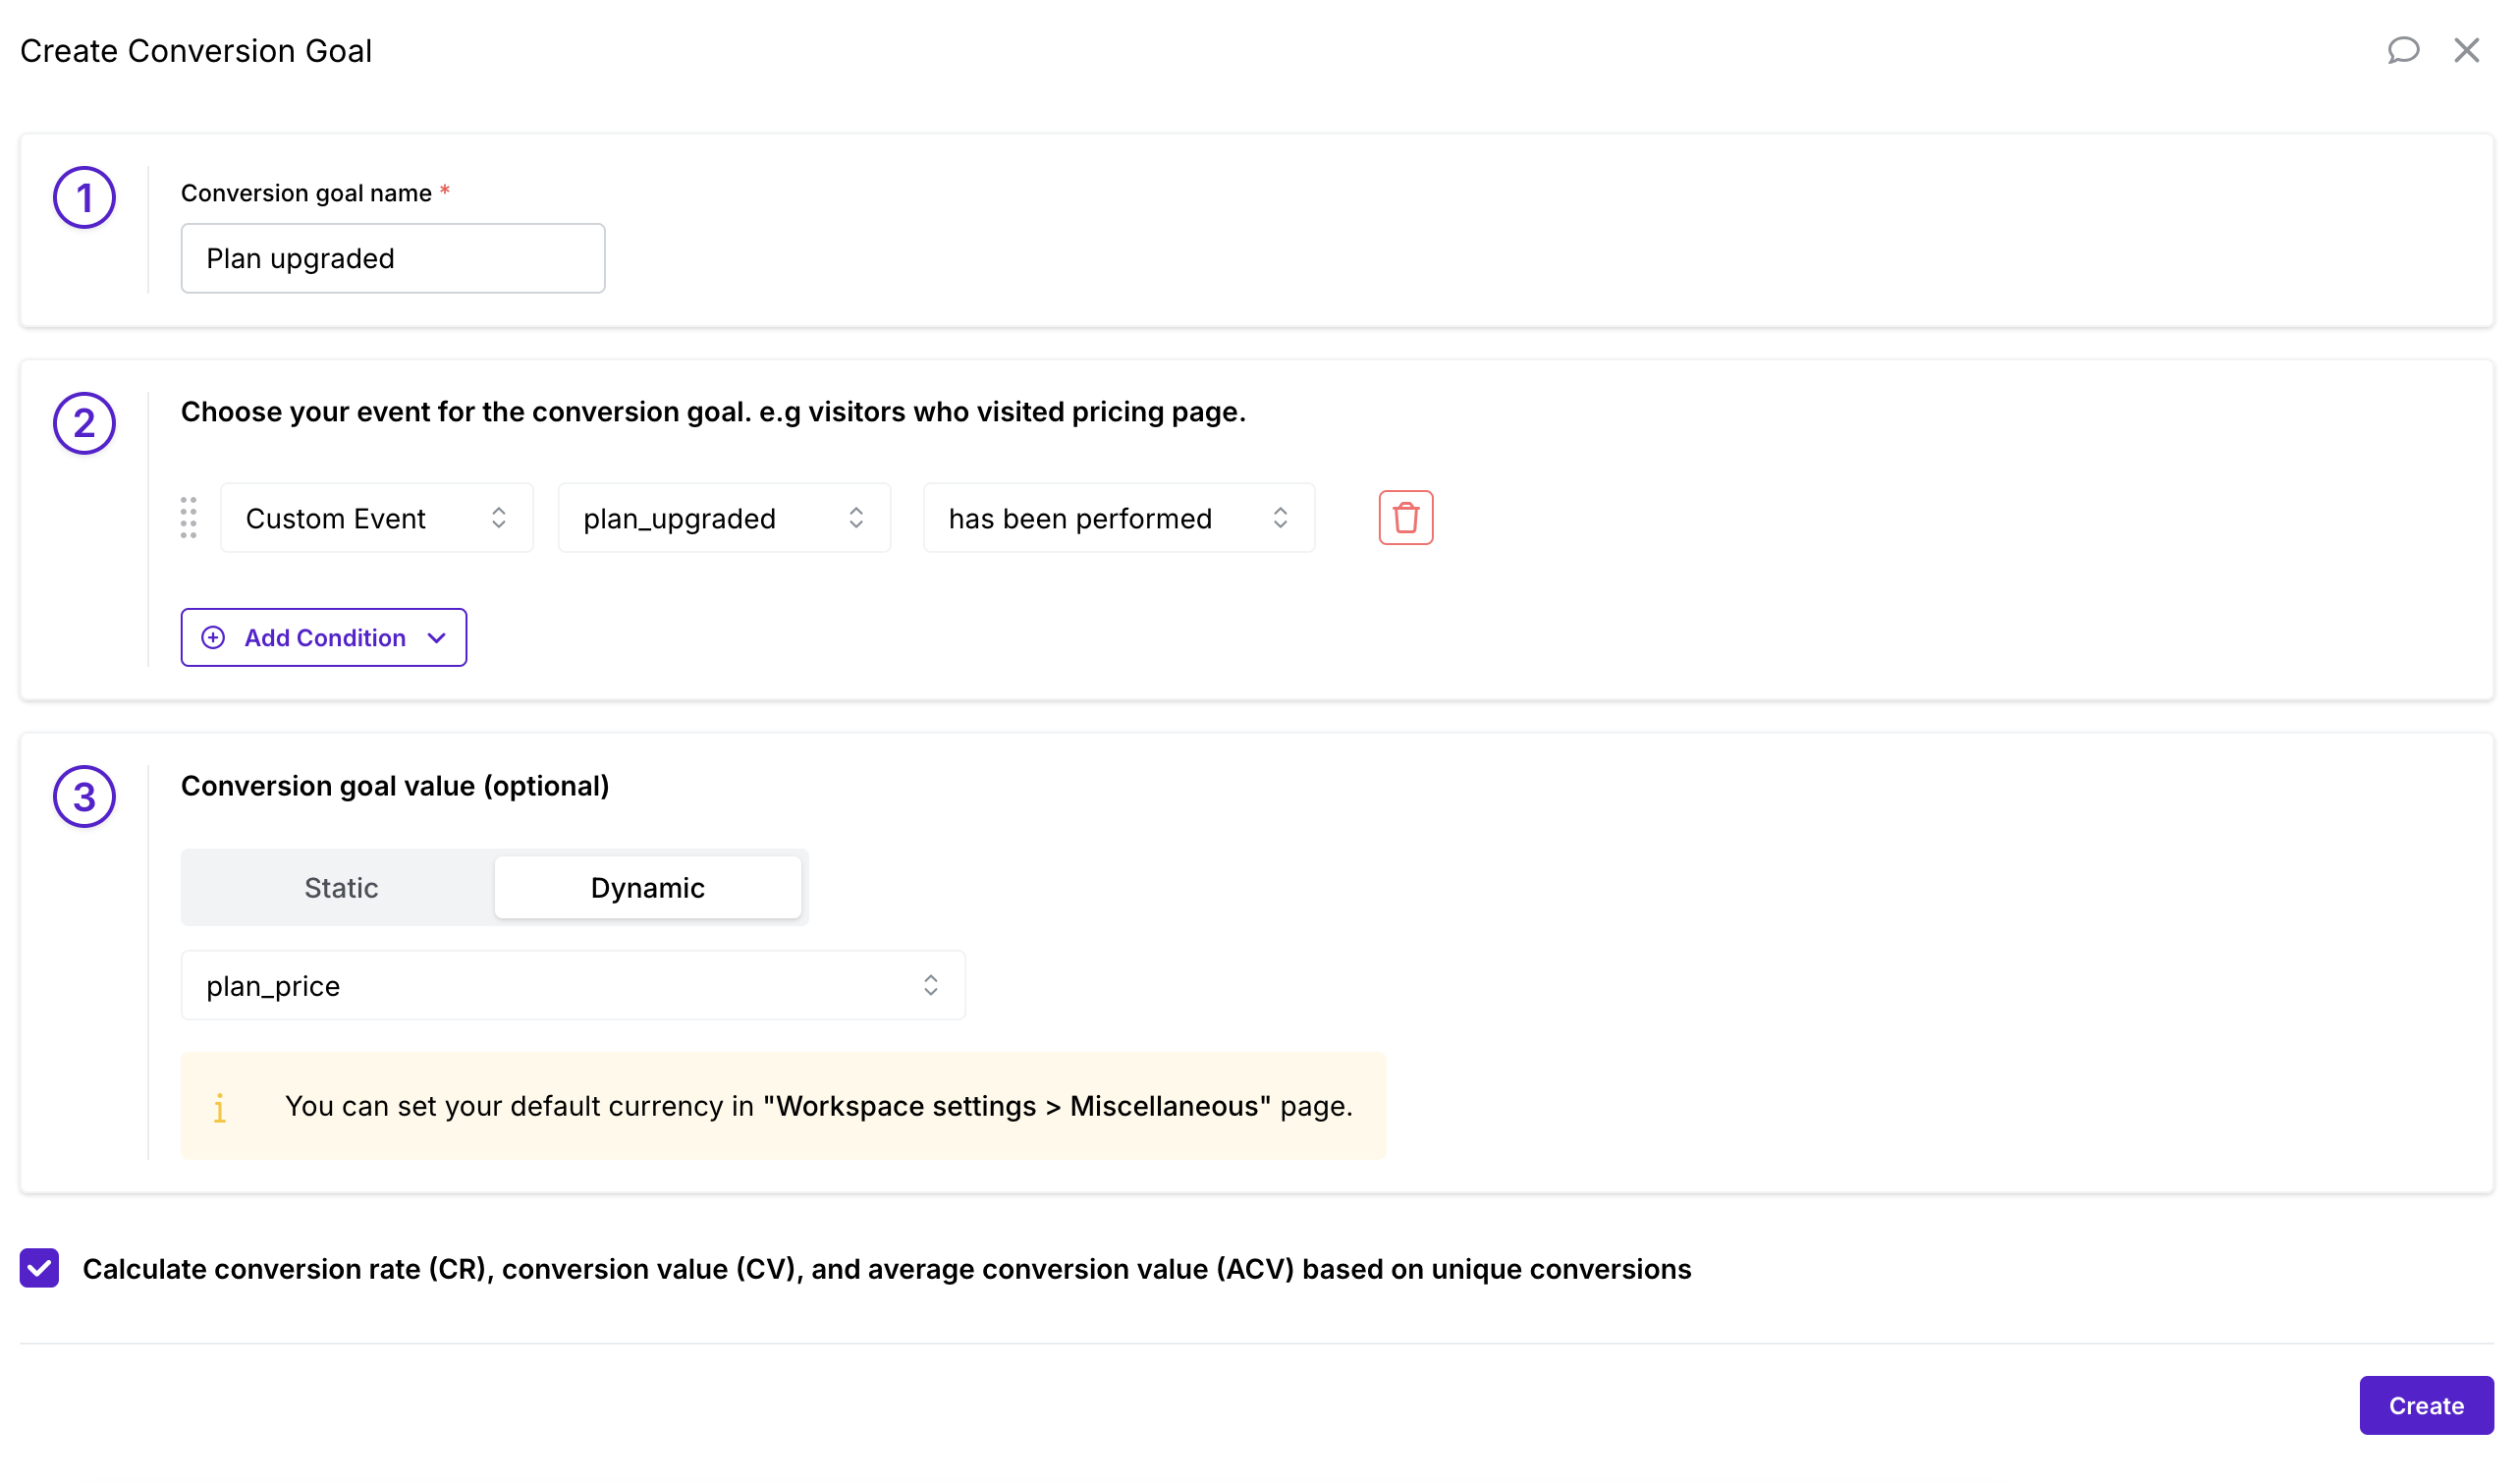
Click on the ‘Create Conversion Goal’ button at the top right of your screen.
Give your goal a clear name. For example, if you want to track people who signed up, you might call it "Signed up.".
Select the event that will count as a conversion. In our example, this would be when someone sign up to the product.
Set a value for the conversion:
You can set a fixed (static) value or a value that changes (dynamic) for each conversion.

> [!NOTE]
Note: The dynamic option is only available if you're using custom events. The conversion rate is calculated like this:
Conversion Rate = (Number of Users / Number of Conversions) × 100
Decide on Unique Conversions:
At the end, you can choose whether to count only unique conversions.
If you check the box, the conversion value will be calculated as (Number of visits) × (Conversion value).
If you leave it unchecked, it will be (Total conversions) × (Conversion value).
Finish Up:
Once everything is set, click the "Create" button to save your new conversion goal.
Attribution mode
Usermaven lets you analyze paid ads using two attribution modes: By Conversion Date and By Spend Date. Each mode uses a different time logic and answers a different reporting question.
By Conversion Date:
Focuses on when conversions happened. Only conversions that occur within the selected conversion period are included, and Usermaven looks back within the lookback window to credit ad touchpoints that influenced those conversions.By Spend Date:
Focuses on when your ad budget was spent. All clicks within the selected spend period are tracked, and any conversions within the look-ahead window are attributed to that ad spend.
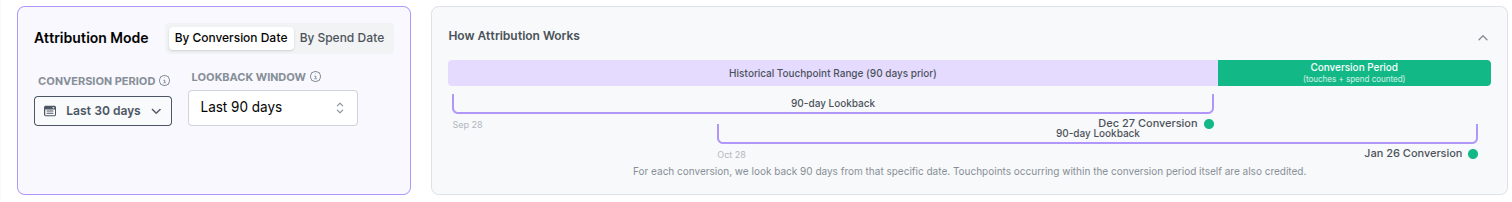
Attribution mode: By Conversion Date
This mode is used when you want to understand which ads influenced conversions during a specific time range.
Conversion period:
The reporting window for conversions. Only conversions that happen inside this date range are included in the attribution analysis.Lookback window:
Defines how far back Usermaven looks to credit ad touchpoints for each conversion. Interactions inside this window receive attribution credit across models.
This mode answers:
"Which ads influenced the conversions that happened during this period?"
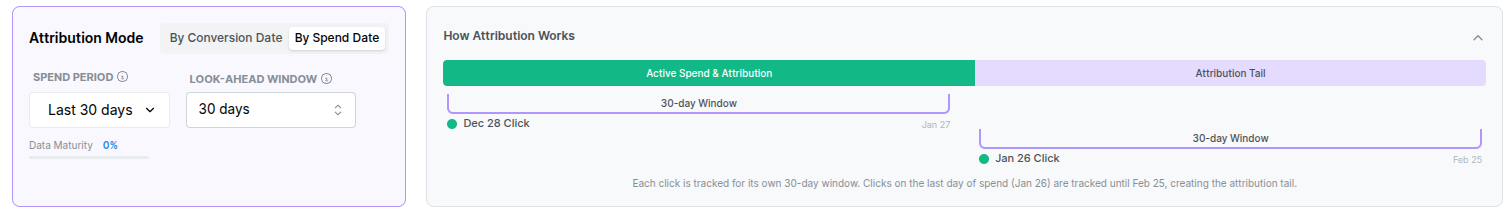
Attribution mode: By Spend Date
This mode is used when you want to evaluate ad spend performance over a specific time period.
Spend period:
The date range during which your ad budget was spent. All clicks from this period are tracked and analyzed.Look-ahead window:
Defines how long Usermaven waits for conversions after an ad click. Any conversion that happens within this window is attributed back to the original spend period.
For example, if the look-ahead window is set to 30 days, a user who clicks an ad on October 1 and converts on October 25 will be counted as a conversion from that October ad spend.
Options may appear disabled if the selected spend period does not yet have enough data to complete the look-ahead window.
Paid ads performance dashboard
After creating a conversion goal, you can access the Paid Ads Performance Dashboard. It’s similar to the Ad Networks view, but broken down into four main tabs for detailed analysis:
Sources: Lists each connected ad network and shows how your chosen attribution models assign credit to each goal.
Campaigns: Displays performance data for each of your campaigns, helping you compare and optimize them.
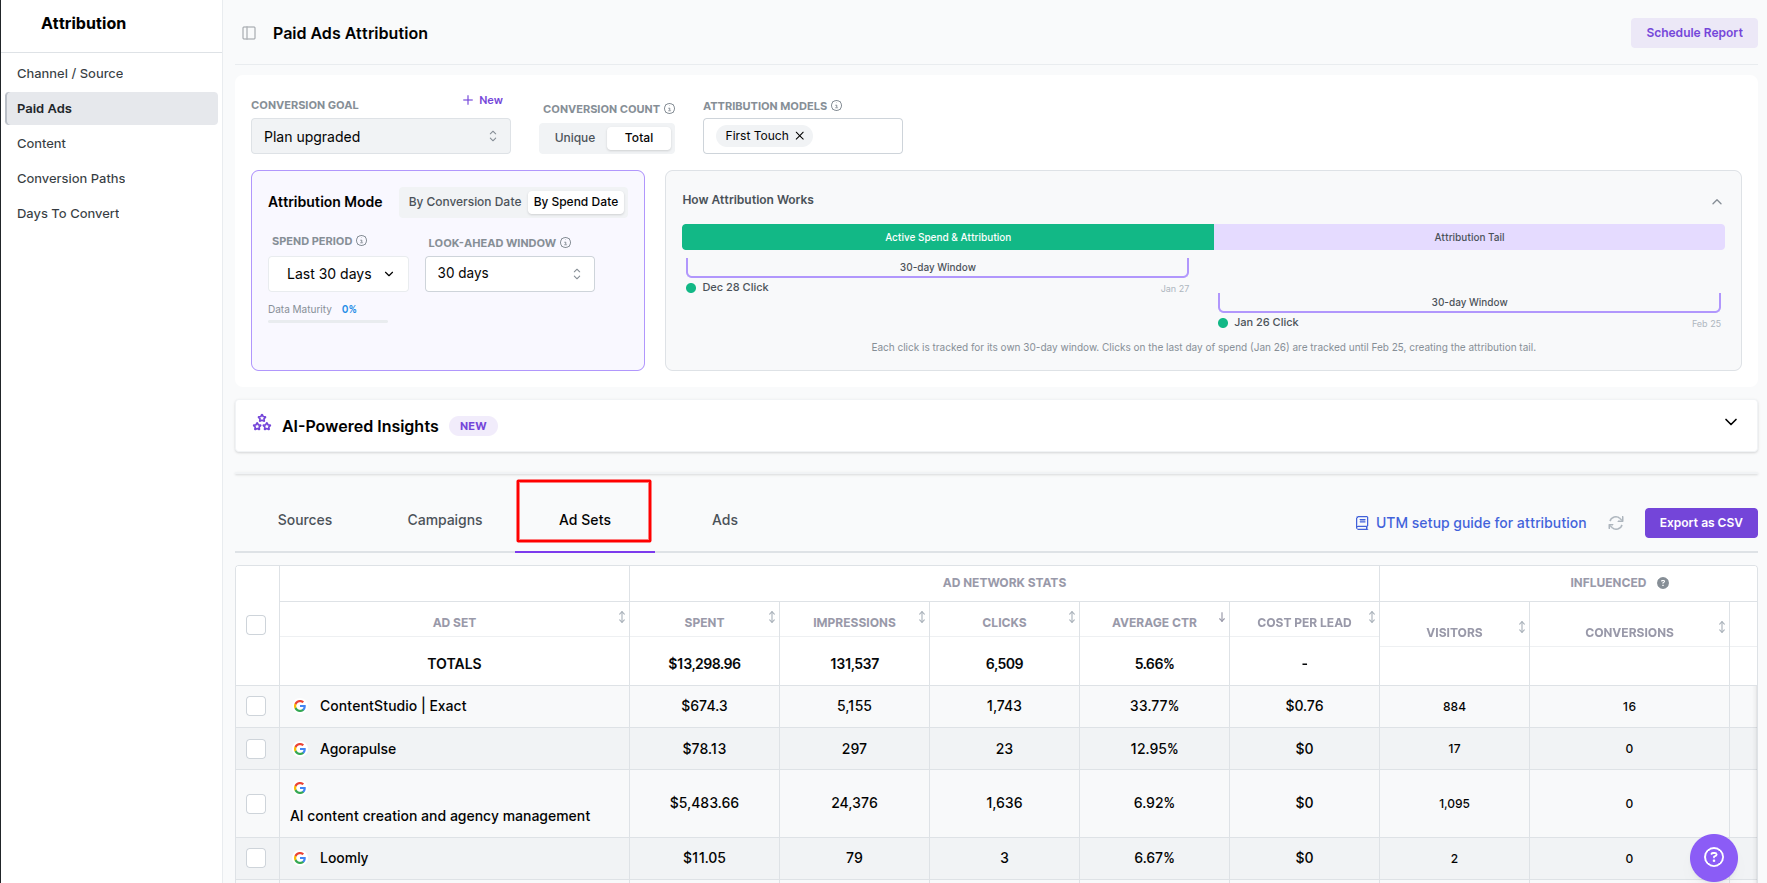
Adsets: Lets you drill down into individual ad groups, revealing which audiences or targeting strategies work best.
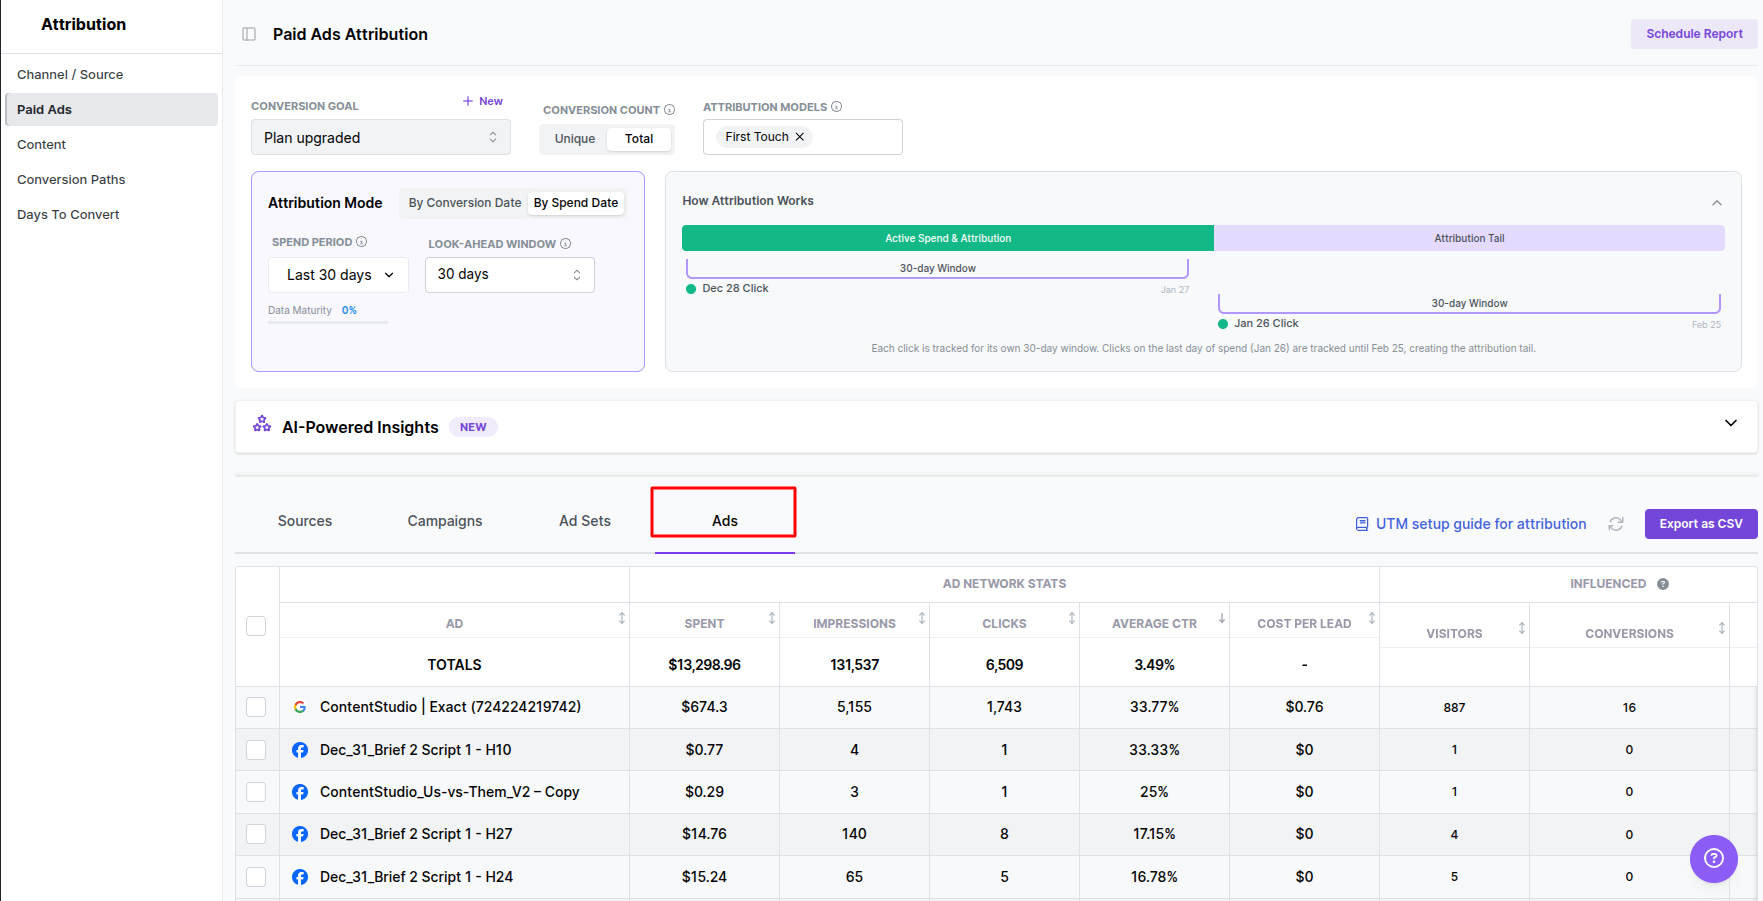
Ads: Provides insights into specific ads, so you can see which creatives or messages are driving the most conversions.
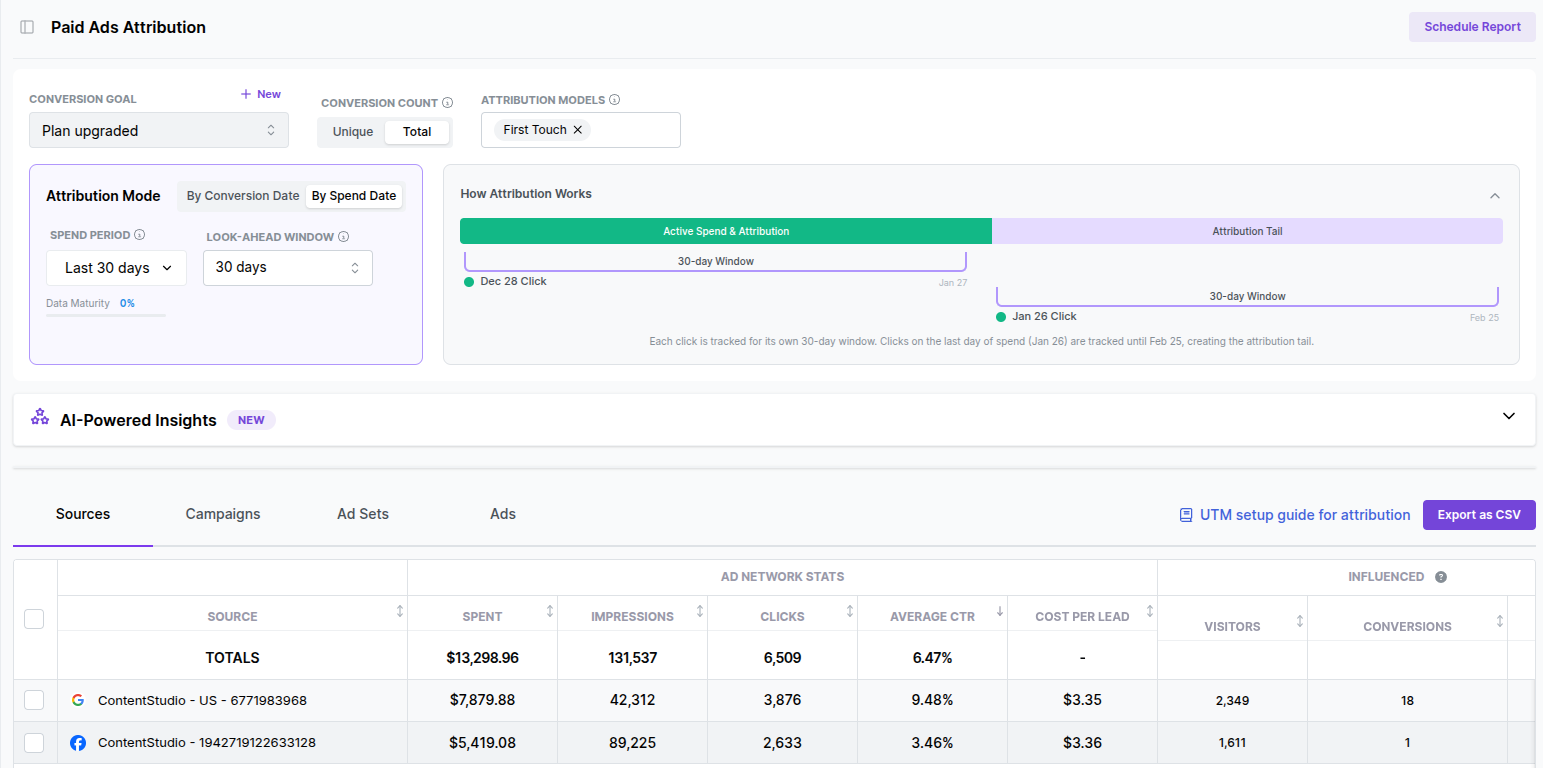
Here are the main metrics displayed in the Paid Ads Attribution table:
Ad Network Stats
Spent: Total amount of money spent on ads.
Impressions: Number of times your ad was shown.
Clicks: Total clicks received on your ads.
Average CTR: Average click-through rate (clicks divided by impressions).
Influenced Metrics
Visitors: Number of unique visitors who landed on your site from these ads.
Influenced Conversions: Number of conversions influenced by your ads (under the chosen attribution model).
Value: Total revenue or value attributed to these influenced conversions.
For each selected attribution model, you'll see these key metrics:
Attributed Conversions: The number of conversions assigned to the model (e.g., first touch conversions).
Attributed Conversion Rate: The percentage of visitors who converted under the model.
Attributed Conversion Value: The total monetary value generated by these conversions.
Attributed ROAS: The return on ad spend, calculated as the conversion value divided by the amount spent.
View your top-performing campaigns, ad sets, and ads
Click the Campaigns tab to view a table of your highest-performing campaigns across all connected ad networks. This overview highlights which campaigns are delivering the best results.
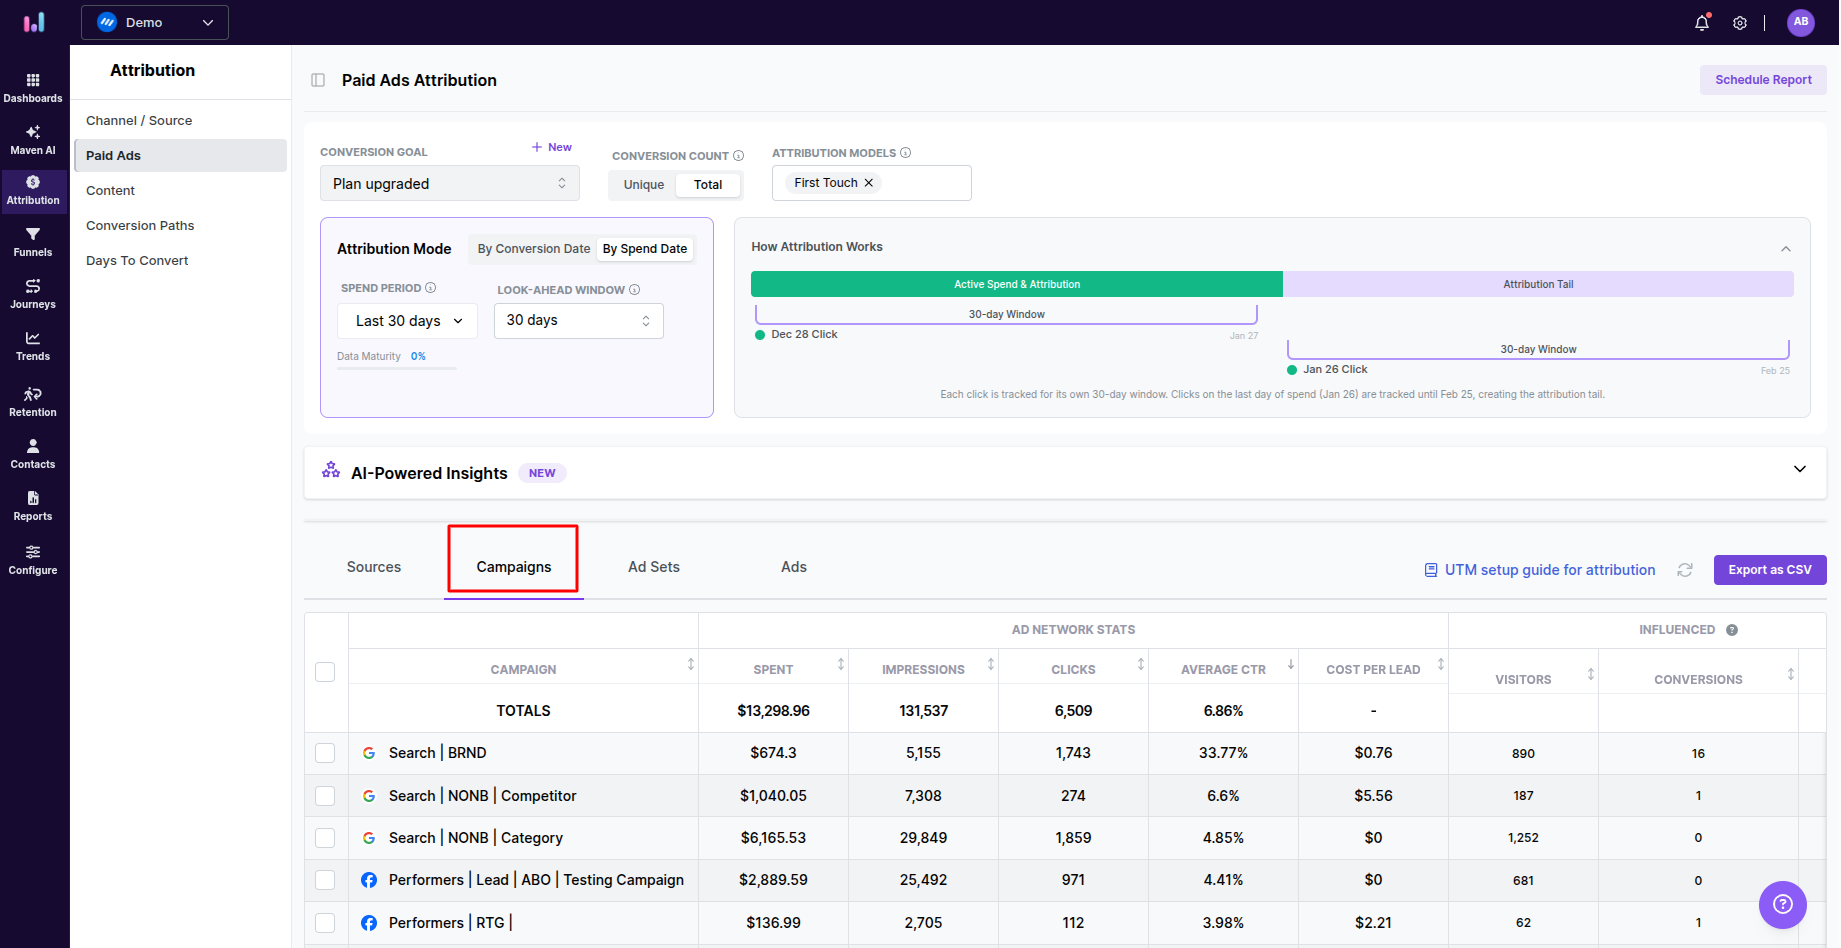
To dive deeper, select a campaign by clicking the checkbox next to its name. This action will highlight the associated ad sets and ads, which will then appear in the Ad sets and Ads tabs.
When you switch to the Ads tab, the table updates to display individual ads along with their key performance metrics, providing detailed insights to help you optimize your paid ads strategy.
Was this article helpful?