Two customers sign up for your product on the same day. One logs in once, clicks around, and vanishes. The other starts to rely on it every morning, invites teammates, and complains when anything slows down.
Both look like wins in your signup report, yet only one adds long-term revenue. That gap is where customer stickiness lives. Most SaaS teams track signups, MRR, and even churn, but have little clarity on why some accounts stay and others slip away.
Without real stickiness data, you guess at onboarding tweaks, pricing changes, and feature launches. The risk is simple and expensive: you can pour money into growth while your best users quietly fade out.
This article shows how to measure customer stickiness in a clear, practical way so you can keep the right customers, grow LTV, and cut churn with confidence.
What is customer stickiness?
Customer stickiness is the likelihood that a customer will keep using your SaaS product and renew their subscription again and again. It measures whether users return after their first login and whether your product becomes their default tool for getting work done. When people discuss customer stickiness meaning, they’re referring to this repeat, almost automatic behavior that keeps users coming back.
Understanding customer stickiness matters because it directly impacts your business growth and long-term sustainability.
Here’s why customer stickiness matter for your churn:
Reduces churn and increases customer lifetime value by keeping users engaged over longer periods
Lowers customer acquisition costs since retained customers are more cost-effective than constantly finding new ones
Creates predictable recurring revenue that makes forecasting and planning more reliable
Generates expansion opportunities as sticky customers are more likely to upgrade or buy additional features
Builds word-of-mouth marketing through satisfied users who become advocates for your product
Provides competitive moats that make switching to competitors painful and unlikely
Improves unit economics by maximizing the return on every customer relationship
Signals product-market fit when users naturally integrate your tool into their daily workflows
Customer stickiness vs. customer loyalty
While these two concepts may appear similar at first glance, customer loyalty differ significantly from stickiness in several ways.
Customer Stickiness
Driven by convenience, speed, and utility
Transactional relationship with the product
Stays because switching costs are high or the product works well
Less likely to recommend unprompted
More sensitive to friction, bugs, or pricing changes
Focus on community building, loyalty programs, and brand storytelling
Foundation you build first with new users
Customer Loyalty
Driven by trust, values alignment, and emotional connection
Emotional relationship with the brand
Stays by choice, even when alternatives are cheaper or flashier
Actively recommends and advocates for the brand
More patient and forgiving when small issues arise
Focus on community building, loyalty programs, and brand storytelling
Outcome you nurture over time as trust deepens
Customer stickiness vs. customer retention
Customer retention is a metric that shows what percentage of customers stay with you over a set period. It measures “how many stayed” and reflects subscription revenue health.
Customer stickiness explains “why customers stay”. It tracks behaviors like frequent logins, feature usage, and engagement with product updates. Stickiness is the cause; retention is the result.
When you compare customer stickiness vs. customer retention, they play different roles. Retention ties directly to revenue and reporting. Stickiness shows user habits, engagement depth, and how your product fits into daily workflows.
Core customer stickiness metrics
Some metrics form the base of any stickiness program. These numbers are simple to define, easy to track, and rich in insight when you view them over time. Every SaaS product and marketing team should treat them as standard, just like MRR or churn.
Here is a quick overview before we look into each metric in detail:
Your customer stickiness rate shows how many users come back after the first period of use. The basic formula is:
(Number of repeat customers during a period / Total number of customers for that period) × 100.
In SaaS, “repeat customers” often means accounts that stay active and engaged after the first billing cycle or first month. You might also track users who log in during both Month 1 and Month 2.
A high stickiness rate means people see enough value to return. A low rate suggests that activation or early product experience has problems. Track this metric monthly and compare it across segments to see where stickiness grows or drops.
Customer retention rate (CRR)
Customer retention rate (CRR) measures how well you keep existing customers over time. The standard formula is:
[(Number of customers at end of period − New customers acquired) / Customers at start of period] × 100.
Customer retention rate is broader than stickiness rate. It includes all customers who stay on the books, even light users. When you compare CRR with deeper engagement metrics, you see whether your “retained” customers are truly active or only present on paper.
As you improve stickiness behaviors such as feature adoption and login frequency, CRR should rise. Review CRR quarterly and yearly to track long-term success and support planning.
Existing customer revenue growth rate
Existing customer revenue growth rate tells you whether current customers spend more over time. The formula is:
[(Current period revenue − Previous period revenue) / Previous period revenue] × 100, using only revenue from existing accounts.
This metric reflects stickiness in financial terms. Customers spend more when they see more value, adopt new features, or add users. Growth from the current base often signals strong product stickiness and good account management.
It includes upsells, cross-sells, and expansion, which all depend on deep engagement. Track this monthly to catch positive or negative trends early.
Net Promoter Score (NPS)
Net Promoter Score (NPS) measures how likely customers are to recommend your product. You ask one question: “How likely are you to recommend our product to a friend or colleague?” on a scale from 0 to 10. Scores fall into three groups:
Detractors rate 0–6 and have high churn risk.
Passives rate 7–8 and feel neutral.
Promoters rate 9–10 and often act as advocates.
NPS is calculated as:
(% of promoters) − (% of detractors).
For many SaaS products, a score of 41 or higher is a strong sign. NPS adds the emotional side to stickiness metrics. It shows not just if people use the product, but how they feel about it. Run surveys at least once per quarter and pair the answers with behavior data for deeper insight.
Advanced customer stickiness metrics
Once you have the basics in place, you can add more advanced metrics that describe how people use your product, not just whether they stay. These measures dig into behavior patterns and help you design more precise stickiness strategies.
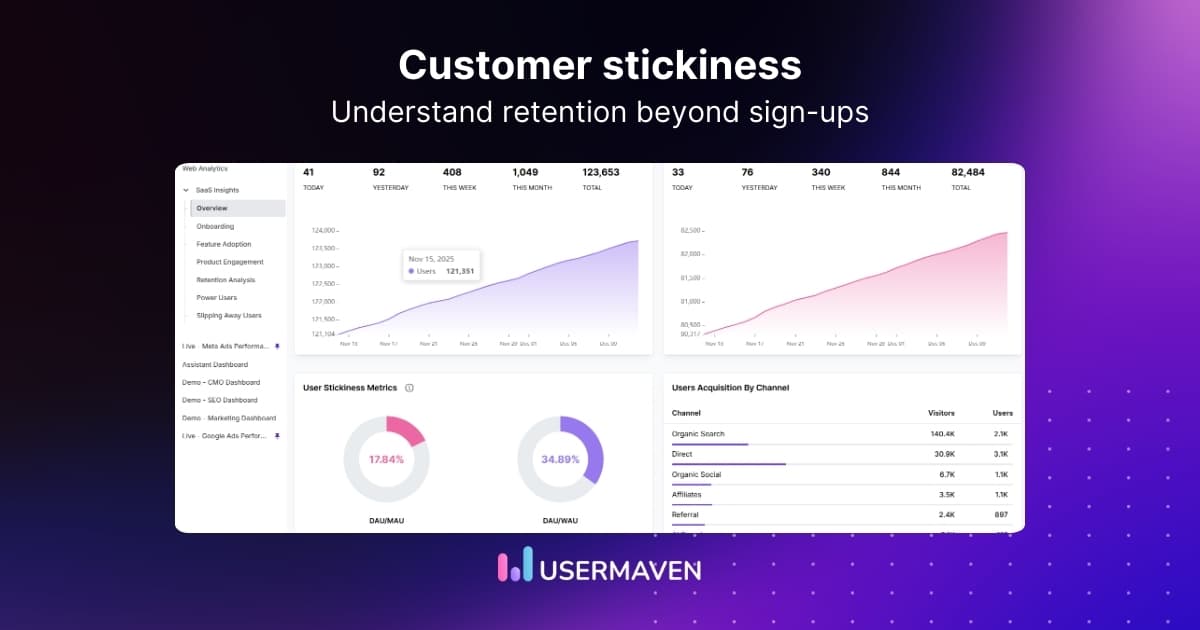
Daily active users (DAU) / monthly active users (MAU) ratio
The DAU/MAU ratio shows how often active users return within a month. The formula is simple:
(DAU / MAU) × 100.
If you have 3,000 daily active users and 10,000 monthly active users, your ratio is 30 percent. For many SaaS apps built for daily use, a ratio above 20 percent is a healthy sign. It means people do not just log in once in a while; they weave the product into daily routines.
This ratio works as a leading indicator of stickiness. When it falls, churn risk usually rises a bit later. Track it weekly and look at changes by segment and plan.
Feature adoption rate
Feature adoption rate shows how many users make use of a specific feature. The formula is:
(Number of users who used feature X / Total active users) × 100 for a set period.
Not every feature has the same impact on stickiness. Some capabilities are “must haves” that go with long-term use. Others are nice extras with little effect on retention.
When you track adoption rates and compare them with retention and customer lifetime value, you can spot your true sticky features. That insight helps you direct onboarding, in-app prompts, and product marketing toward features that matter most.
Time to value (TTV)
Time to value (TTV) measures how long it takes new users to reach a clear moment of value. In SaaS, this point is often called activation. It might be when a user:
Completes onboarding
Invites the first teammate
Creates a project
Connects a data source or publishes a report
There is no single formula, but you track the time between signup and a defined activation event, then look at median values. Shorter TTV strongly links to higher stickiness. When users see value in days instead of weeks, they form habits faster and are less likely to churn.
Measure TTV across segments and acquisition channels so you can adjust onboarding flows and content where it matters most.
Session duration and frequency
Session metrics show how deep and how often customers use your product:
Duration tells you how long the average session lasts.
“Good” numbers depend on your product. A daily collaboration app should see frequent, moderate sessions. A heavy analytics tool might see fewer but longer sessions.
The trend is more important than the exact number. Rising duration and frequency suggest that the product sits deeper in the workflow. Sudden drops often act as early warnings of future churn, so add alerts when these metrics fall for key segments.
How cohort analysis reveals user stickiness patterns
Cohort analysis groups customers by shared traits like signup month, channel, or feature use and tracks their behavior over time. This reveals patterns that overall averages hide and shows how stickiness changes across customer waves.
Stickiness fluctuates. Most products lose users early, then stabilize. Cohorts show when groups drop off—after Month 2 or 6, pointing to onboarding or value issues. They also prove if improvements work: users from after a product change should retain better than those before.
Start with time-based cohorts like “January signups” and track activity across weeks. Then segment by acquisition channel, onboarding completion, or early feature use to see which factors drive retention.
Retention curves plot how many users stay active over time. Steep early drops signal onboarding problems; slow declines suggest shallow long-term value. The curve’s flat section shows your sticky core.
Use these insights to act: test onboarding flows when early drop-off is high, promote features that boost retention, or support struggling segments with targeted help. Monthly cohort reviews with product and marketing teams keep your stickiness strategy data-driven.
Steps to set up stickiness measurement in your SaaS product
Knowing which metrics to track is only half the work. You also need a clear plan for capturing the right data and turning it into insight. A phased setup helps you start simple, then add depth as your team gains experience.
Step 1: Define your activation and engagement events
Start by figuring out which user actions really matter and show they’re sticking around. Pick three to five key moments like finishing onboarding, making their first project, hooking up a data source, or bringing in teammates. These are the “aha” moments.
Next, write down signs they’re staying engaged like logging in each week, using your main features, or getting through important tasks. What matters will be different for every product, but it should show they’re making real progress. Look at your past data to make sure users who hit these milestones actually stick around longer than those who don’t.
Step 2: Implement product analytics tracking
To measure stickiness at scale, you need strong product analytics. Event tracking should capture every important action without constant help from developers. Usermaven makes this much easier by automatically tracking page views, clicks, user sessions, and custom events for feature use and workflow steps.
Usermaven’s event tracking, funnels, and user path views give you a clear view of how users move through your product and where they drop off. Setup takes only a few minutes and does not require code, which means product and marketing teams can adjust tracking on their own. With technology that bypasses ad-blockers, you gain near-complete data and avoid blind spots in your stickiness metrics.
Step 3: Create a stickiness measurement dashboard
Next, collect your core metrics in a single dashboard. This view should include:
Customer stickiness rate
DAU/MAU ratio
Feature adoption for your top features
NPS trends
Retention curves for recent cohorts
Existing customer revenue growth
Usermaven provides real-time analytics dashboards that pull this data together in one place. You can share them across product, marketing, and leadership teams so everyone tracks the same numbers. Regular use of this dashboard turns stickiness from an abstract idea into a daily habit.
Step 4: Establish baseline metrics and set goals
Before you change anything, measure your current state. Calculate your present stickiness rate, DAU/MAU ratio, TTV, and retention curves for the last few cohorts. These baselines become the reference point for all future work.
From there, set clear, realistic goals. For example, you might aim to reduce median time-to-activation by two days or raise the stickiness rate by five percent over the next quarter. Goals help you decide which experiments to run first and make it easy to see whether they work.
Step 5: Build regular reporting and analysis cadences
Measurement has little value if it sits in a dashboard that no one opens. Set a rhythm for review. A short weekly meeting can cover key stickiness metrics and call out any sudden changes. A monthly session can dig into cohort analysis, feature adoption, and campaign effects.
Assign clear owners for each metric so someone always tracks results and proposes follow-up actions. Use these sessions to pick new experiments, stop efforts that do not work, and keep the whole team aligned on what drives stickiness in your product.
Using segmentation to measure stickiness across customer groups
Averages hide important differences between heavy users and those who barely engage. Segmentation reveals where stickiness thrives or fails across different customer groups.
Key segmentation approaches
Acquisition channel. Compare stickiness and LTV across organic search, paid ads, and referrals. Some channels drive volume with low engagement; others deliver fewer but stickier users. Track these differences through attribution data. Acquisition channel. Usermaven works as SaaS attribution software that connects acquisition source, product engagement, retention, and expansion data, so you can see which channels bring customers who actually stay.
Customer profile. Segment by company size, industry, or use case to identify which groups show high stickiness versus fast churn.
Usage patterns. Separate power users adopting multiple features from light users confined to one area. Engagement tiers reveal dramatically different stickiness rates.
Applying segmentation insights with Usermaven
Usermaven’s segments feature makes this type of analysis practical. You can define segments based on:
User data such as plan type or signup date
Company details such as size and industry
Behavioral data such as feature use or key events
Engagement data such as session counts or message interactions
Once segments are in place, you can send targeted in-app messages, design custom onboarding flows, or run re-engagement campaigns for at-risk groups. Segments update automatically as user behavior changes, so your views stay fresh.
A monthly review of customer segment performance in Usermaven helps you spot high-value groups to double down on and weak spots that need extra attention.
8 proven strategies to increase customer stickiness
The following strategies tie directly to the metrics covered above and give you concrete ways to raise engagement and retention.
1. Personalize onboarding based on user data
Generic onboarding treats every new user the same. That often wastes time and hides the fastest path to value. Instead, ask for a few key details during signup, such as
Role
Team size
Primary goal
Main use case
These answers give you enough context to adjust the first-run experience
With Usermaven, you can collect this data, build segments, and track how each onboarding variant affects activation and stickiness. Over time, you will see which paths give the fastest TTV for each group.
2. Accelerate time-to-value with guided activation
New users decide very quickly whether a product is worth more effort. If they do not see value early, they slip away.
To avoid that, break your activation path into clear, small steps and present them as an in-app checklist. Each item should move the user toward a specific outcome, such as creating a project or connecting an integration. Include a progress bar and even one or two pre-completed items to create a sense of early momentum.
3. Implement proactive, self-service support
When users hit friction and cannot fix it fast, they lose trust and drift toward other tools. A strong in-app support hub can prevent that.
Place a help icon or panel inside the product with:
Support data shows where users struggle and what blocks them from reaching value. Track support ticket volume, common questions, and time-to-resolution. As those numbers improve, you should see better activation and stickiness among new cohorts.
4. Announce new features to drive continued engagement
Stickiness is not only an onboarding problem. Long-time customers can drift away when the product feels stale or when they miss new value that would keep them interested. Regular feature releases, paired with smart announcements, help counter this effect.
Use in-app modals for major updates that almost every user should see, such as a new dashboard or integration. For smaller improvements, use subtle tooltips or banners near the relevant areas of the interface. Target announcements by segment so each user only sees what matters to their role and use case.
Then track feature adoption rates after each announcement with Usermaven. If adoption is low, adjust messaging or placement.
5. Use behavioral data to identify and engage at-risk users
Churn risk shows up in behavior before a cancellation request hits your inbox. You can define “at-risk” patterns such as fewer logins, stopped use of a key feature, or failure to complete important workflows. With product analytics, you can monitor these signals and flag accounts that fit them.
Usermaven’s behavioral tracking and user path reports make it clear when someone starts to drift away. Once you mark those users, you can reach out with targeted emails, in-app prompts, or personal calls. Offer help, share short guides on powerful features, or show how peers succeed with the product. Track re-engagement and retention for this group to see how much your outreach improves stickiness.
6. Highlight and drive adoption of sticky features
Some features punch far above their weight in terms of stickiness. They might automate a painful task, centralize data from several tools, or give insights that teams use every day. Your job is to identify these sticky features and get more users to them, sooner.
Use Usermaven to correlate feature adoption with long-term retention and expansion. If accounts that adopt a certain feature in Week 1 retain much better, make that feature a star in onboarding. You can use hotspots, guided tours, and checklists that nudge users toward it. Then track adoption cohorts to confirm that early use of this feature keeps lifting retention curves over time.
7. Use customer data to personalize engagement
Mass emails and generic in-app messages rarely feel helpful. With the data you already collect, you can send more relevant communication. Use role, industry, plan type, and behavior to decide which tips, case studies, and prompts to share with each user.
For example, you might send a product manager in a SaaS company a set of usage reports and feature ideas, while a founder in a small agency receives a quick setup guide for billing and team invites. Inside the product, you can surface prompts for features that match the user’s current behavior.
Usermaven’s 360-degree profiles and Segments make this kind of personalization manageable. Track open rates, click rates, and in-app engagement by segment to see which messages drive real stickiness.
8. Create milestone celebrations and recognition
People like to see their progress. When your product highlights wins, it strengthens both habit and emotion. Identify milestones that mean the customer has gained real value, such as the first month of consistent use, a set number of completed tasks, or a goal reached through your tool.
Celebrate those moments with simple messages, badges, or small rewards such as credits or feature previews. These touches remind users how far they have come and why your product matters in their work.
Measure retention and engagement for users who receive milestone messages compared with those who do not. Over time, you can refine which milestones matter most for long-term stickiness.
Tools and platforms for measuring customer stickiness
The right analytics stack makes stickiness measurement far easier. You want tools that collect accurate behavior data, surface clear patterns, and support fast action by product and marketing teams.
Here’s what to look for in a stickiness measurement platform:
Event tracking. Record key actions like signups, logins, and feature use with automatic and custom events. No-code setup eliminates developer bottlenecks.
User path analysis. Map user movement across screens and identify drop-off points in funnels to reduce friction in activation and retention.
Cohort analysis and retention tracking. Study stickiness patterns over time rather than relying on single snapshots.
Segmentation. Your analytics tool for SaaS should group users by traits and behavior. Dynamic segments update automatically for easier ongoing analysis.
Dashboards and data quality. Real-time analytics dashboards align teams. Prioritize data accuracy and privacy controls to avoid flawed conclusions.
Why Usermaven is the ideal choice for measuring customer stickiness
Usermaven brings all of these needs into one platform built with SaaS products in mind. It combines product analytics, website analytics, and customer data, so you see how prospects move from first visit to long-term use without juggling tools.
Automatic and custom event tracking capture nearly every action, while funnel analysis and user path reports show how people progress through your app and where they stop. Advanced cohort analysis and retention curves let you compare stickiness across signup months, channels, and behaviors. Powerful segmentation based on user, company, and behavioral data makes it easy to build precise groups for analysis and campaigns.
Each user has a 360-degree profile that gathers all interactions in one place. Setup takes only a few minutes and does not rely on engineering. Usermaven’s tracking bypasses most ad-blockers and reaches about 99 percent data accuracy, so your stickiness metrics rest on solid ground. Privacy-focused design keeps you aligned with GDPR regulations while you work.
Users rate the platform 4.9 out of 5 on Product Hunt, Capterra, G2, and other sites, often praising its ease of use and clear reporting. For B2B SaaS product teams that care about churn and adoption, it is a natural fit.
Common mistakes when measuring customer stickiness
Even with the best tools, certain habits can distort your view of stickiness or slow progress. Avoiding these common errors will save time and make your data far more useful.
Tracking vanity metrics instead of meaningful engagement that drives real business value
Measuring too late in the customer lifecycle when retention opportunities have already passed
Ignoring segmentation and treating all customers the same regardless of their unique needs
Failing to define clear activation and engagement events that indicate true product adoption
Not connecting stickiness metrics to business outcomes like revenue growth and customer lifetime value
Over-relying on NPS without behavioral context that explains the underlying reasons for customer sentiment
To wrap it up,
Customer stickiness determines how deeply your product integrates into users’ workflows and directly impacts your retention and revenue growth. The metrics covered in this guide give you a clear view of where your product holds value and where users begin to drift away.
Improving customer stickiness requires consistent measurement and targeted action. With product analytics, behavioral tracking, and retention dashboards in Usermaven, teams can understand which customers keep returning, which behaviors signal long-term value, and where churn risk starts to appear.
Start measuring your stickiness metrics today, identify your strongest features, and build experiences that keep users coming back.
Ready to take control of your retention strategy? Book a demo with our team or start your free trial now to see how Usermaven can help you build a stickier, more valuable product.
FAQs
1. How do you measure customer stickiness for a new SaaS with low user volume?
For early-stage SaaS products, traditional benchmarks like DAU/MAU or NPS may not be reliable due to small sample sizes. Instead, focus on behavioral signals such as onboarding completion, repeat logins within the first 14–30 days, and usage of one core feature. Even a handful of users repeatedly performing the same high-value action can indicate early stickiness.
2. What is a good customer stickiness benchmark for SaaS products?
There is no universal benchmark, but common reference points include a DAU/MAU ratio of 20–30% for daily-use SaaS and strong retention past the first 60–90 days. The most useful benchmark is your own historical data. If stickiness improves cohort over cohort, you are moving in the right direction regardless of industry averages.
3. Can customer stickiness be high even if retention is flat?
Yes. A product can show strong engagement among a smaller core group while still losing casual or poorly fit users. This often happens when acquisition channels bring in mismatched customers. In this case, stickiness reveals product strength, while flat retention highlights targeting or onboarding gaps.
4. How does customer stickiness differ for B2B vs. B2C SaaS?
B2B SaaS stickiness is often driven by workflow dependency, team adoption, and switching costs, while B2C SaaS relies more on habit formation and frequency. As a result, B2B products should focus more on feature adoption, multi-user engagement, and integration usage rather than raw session counts.
5. How do you identify fake stickiness caused by switching costs?
Fake stickiness occurs when users stay subscribed but rarely engage. You can spot it by comparing retention metrics with activity metrics such as login frequency, feature usage, and session depth. If retention is high but engagement steadily declines, customers may be staying only because switching feels painful, not because they see value.
Wondering why each ad platform tells a different story about the same conversion? This guide breaks down cross platform marketing attribution in plain English, from models and data foundations to tools and setup steps, so you can finally connect campaigns to real pipeline and revenue.
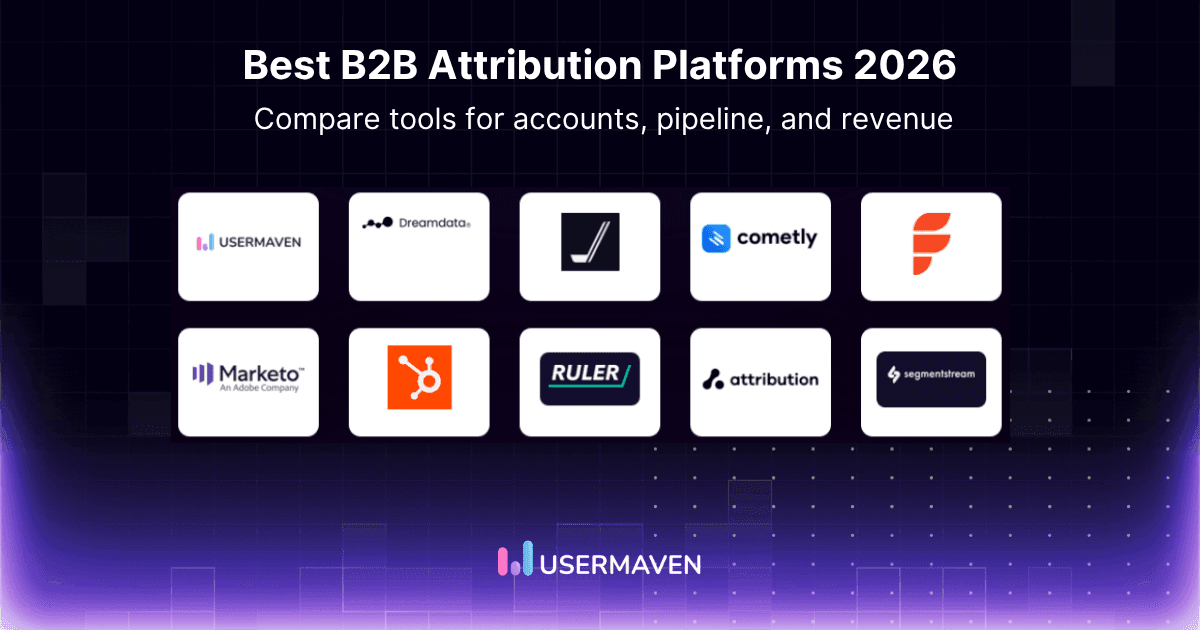
A B2B deal may involve several contacts, months of research, paid campaigns, organic content, webinars, sales calls, product activity, and CRM updates. Last-click reporting usually gives all the credit to the final interaction, even when earlier touchpoints created demand and moved the account toward a purchase. A B2B marketing attribution platform connects marketing activity with […]
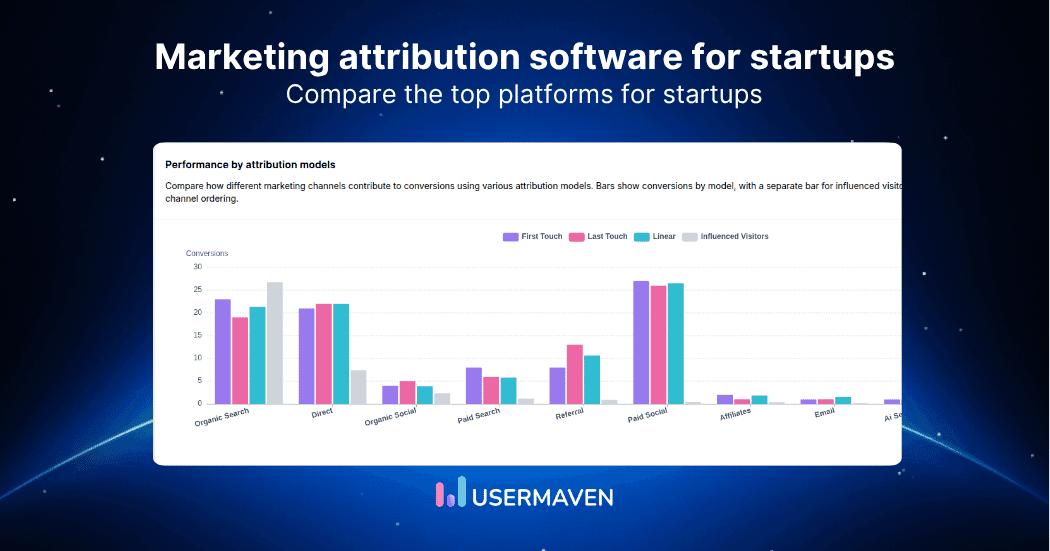
You are spending money on ads, content, and campaigns, but do you actually know which ones are driving revenue? For startups, where every dollar has to earn its keep, flying blind on marketing attribution is not just frustrating; it is expensive. Marketing attribution for startups has come a long way, but the sheer number of […]