Some customers are likely to buy again. Others may stop using your product next month. And some leads are much closer to converting than their activity suggests.
What if you could identify these patterns before they turn into results?
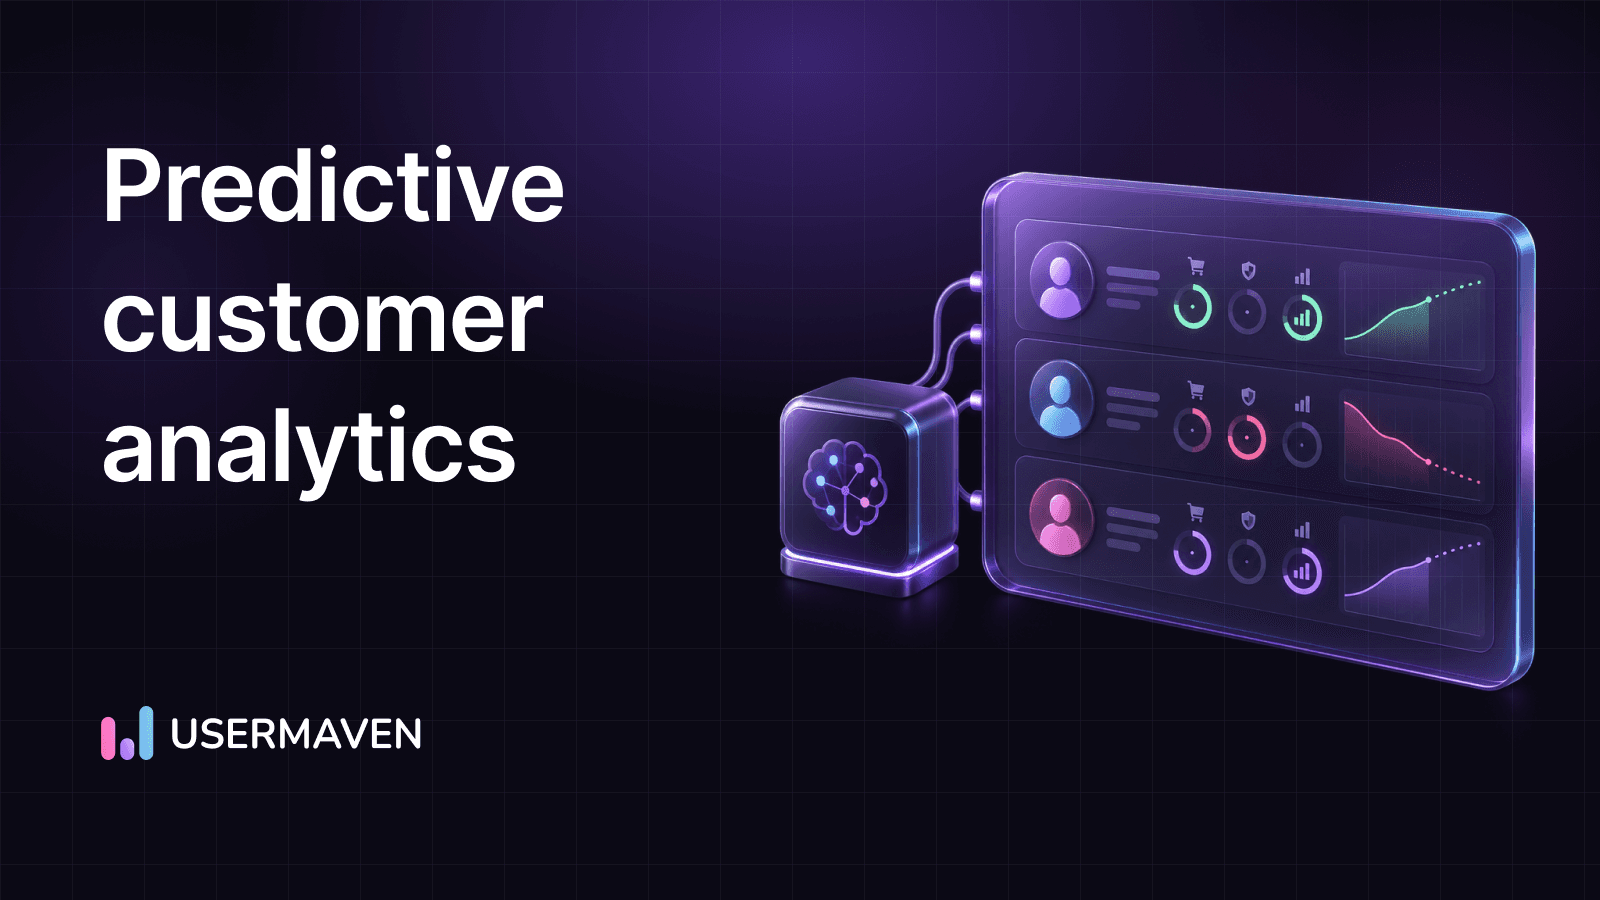
That’s what predictive customer analytics helps businesses do. It uses historical customer data, statistics, and machine learning to estimate what customers are likely to do next.
But predictions aren’t guarantees. Their value comes from helping teams make better decisions about marketing, sales, retention, and customer experience.
Here’s how predictive customer analytics works, which models businesses use, and how to apply it with practical examples.
See Usermaven in action
Book a free demo and discover how powerful analytics can grow your business.
Key takeaways
- Predictive customer analytics estimates future behavior. It uses historical data to forecast outcomes such as purchases, conversions, and churn.
- Different goals require different models. Churn prediction, lead scoring, purchase propensity, and lifetime value forecasting solve different problems.
- Data quality matters more than volume alone. Reliable predictions require relevant historical data, clear outcomes, and proper validation.
- Predictions should guide decisions, not replace judgment. A high-risk score identifies something worth investigating, not a guaranteed outcome.
- Business impact matters more than model accuracy alone. Measure whether predictions improve retention, conversion rates, revenue, or resource allocation.
What is predictive customer analytics?
Predictive customer analytics is the process of using historical customer data, statistical techniques, and machine learning to estimate future customer behavior.
It identifies patterns in previous interactions and uses them to calculate the likelihood of specific outcomes.
For example, businesses can use predictive analytics to estimate:
- Which customers are likely to cancel their subscriptions.
- Which leads are most likely to become paying customers.
- When a customer might make another purchase.
- Which accounts may be ready for an upgrade.
- How much revenue a customer could generate over time.
Unlike traditional customer behavior analytics, which helps explain what customers have done, predictive analytics focuses on what may happen next.
A simple example
Imagine a SaaS company with 5,000 active customers.
The company analyzes historical product usage, subscription activity, support interactions, and cancellation records.
Its predictive model identifies 300 accounts with an elevated probability of canceling within the next 30 days.
The customer success team can investigate those accounts and prioritize appropriate retention efforts.
However, the model doesn’t know with certainty which customers will leave. It estimates risk based on patterns in historical data.
That distinction is important because predictive analytics produces probabilities and forecasts, not guaranteed outcomes.
See Usermaven in action
Book a free demo and discover how powerful analytics can grow your business.
How does predictive customer analytics work?
Predictive customer analytics follows a process that turns historical customer information into forecasts that businesses can use.
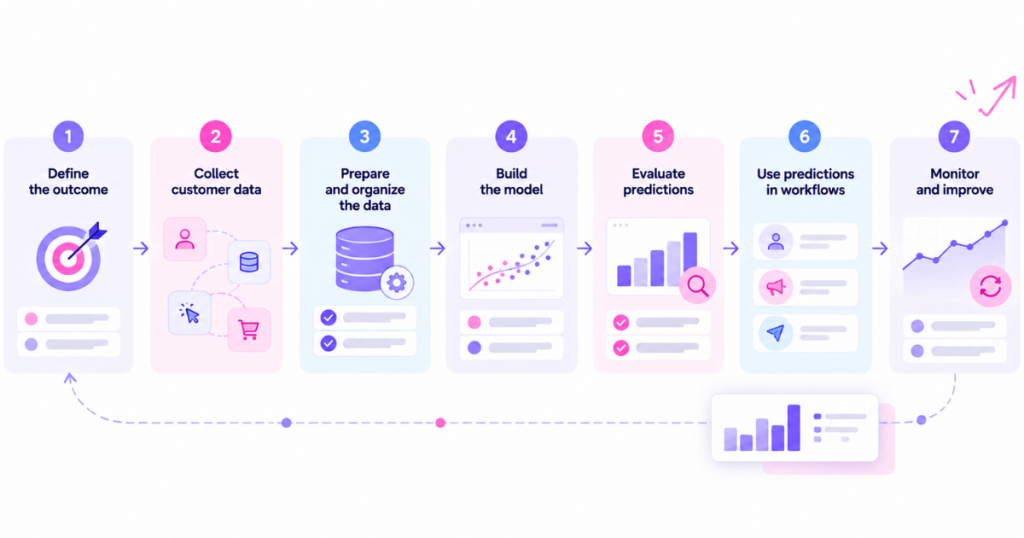
The process generally involves seven steps.
1. Define the outcome you want to predict
Start with a specific business question.
For example:
- Will this customer cancel within 30 days?
- Will this lead become a paying customer within 90 days?
- How much revenue will this customer generate over the next year?
- Will this account upgrade during the next quarter?
Each question requires a clearly defined outcome and prediction period.
For example, predicting whether a customer will churn “sometime in the future” is less useful than predicting whether they will cancel within the next 30 days.
2. Collect relevant customer data
Next, gather historical information that may help explain the outcome.
Common sources include:
- Website activity.
- Product usage.
- Purchase and subscription history.
- Marketing interactions.
- CRM records.
- Customer support interactions.
- Previous conversion and cancellation events.
For example, a churn prediction model might use login frequency, feature usage, subscription age, and support ticket history.
First-party data collected through direct customer interactions can provide valuable inputs, provided it is gathered and used with appropriate privacy controls.
3. Prepare and organize the data
Raw customer data often contains missing values, duplicate records, inconsistent formats, or tracking errors.
Before training a model, teams need to:
- Remove or resolve duplicate records.
- Handle missing values appropriately.
- Standardize dates and event definitions.
- Connect relevant customer identifiers.
- Label historical outcomes.
- Exclude information unavailable at prediction time.
For example, a model predicting churn must not use a cancellation confirmation recorded after the prediction date.
Doing so would introduce data leakage and make model performance appear better than it would be in real use.
4. Select and train a predictive model
Once the data is prepared, analysts choose a model based on the business question and available information.
Common methods include logistic regression, decision trees, random forests, gradient boosting, and time-series forecasting.
The model learns relationships between historical customer characteristics and known outcomes.
For example, it may learn that customers with declining product usage and unresolved support issues have historically experienced higher churn rates.
5. Evaluate the model
Before using predictions, test the model on data it hasn’t seen during training.
This helps determine whether the model can generalize to new customers rather than simply memorizing historical patterns.
Depending on the task, evaluation may include:
- Precision and recall.
- ROC-AUC or PR-AUC.
- Probability calibration.
- Mean absolute error.
- Performance across customer segments.
For time-dependent customer predictions, use validation that respects the order of events.
6. Use predictions in business workflows
Predictions become useful when they inform specific actions.
For example:
- Sales teams prioritize leads with higher conversion propensity.
- Customer success teams review accounts with elevated churn risk.
- Marketing teams tailor campaigns to relevant customer groups.
- Finance teams use lifetime value forecasts for planning.
A model’s output should support a decision, not automatically determine one.
7. Monitor and improve the model
Customer behavior changes over time.
A model trained on older data may become less reliable when pricing, products, customer segments, or market conditions change.
Monitor prediction quality, data freshness, and actual business outcomes.
Retrain or adjust the model when necessary.
What data is needed for predictive customer analytics?
The data you need depends on what you’re trying to predict.
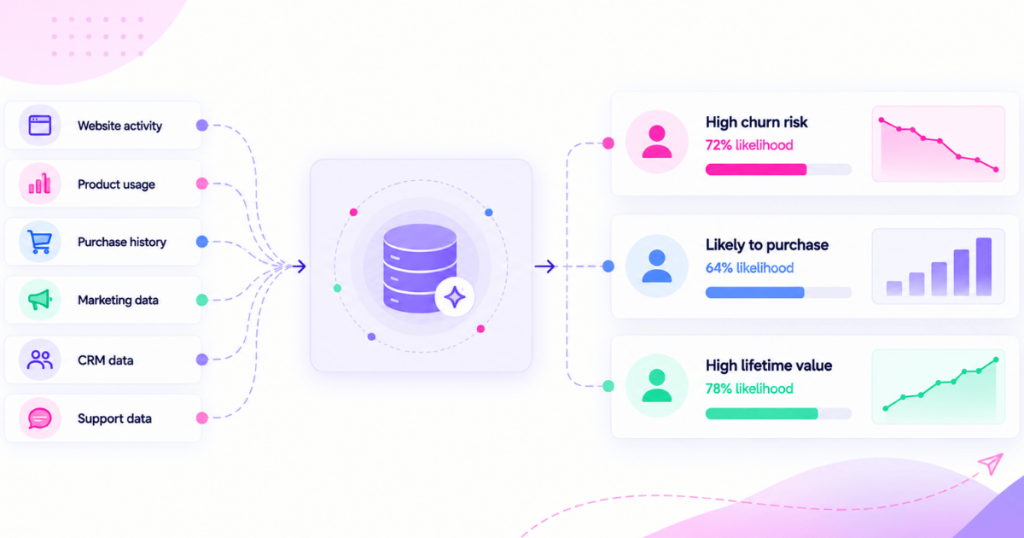
A purchase prediction model needs different information from a churn or lifetime value model.
| Data type | Examples | Potential use |
|---|---|---|
| Customer profiles | Account type, industry, company size | Segment-specific predictions |
| Website behavior | Page visits, content engagement, conversions | Purchase and lead propensity |
| Product behavior | Logins, feature usage, activation | Churn and expansion prediction |
| Purchase history | Orders, subscriptions, renewals | Repeat purchases and LTV |
| Marketing data | Campaigns, acquisition sources, touchpoints | Conversion propensity |
| CRM data | Lead stages, opportunities, sales history | Lead scoring |
| Support data | Tickets, issues, resolution history | Customer retention risk |
For example, product analytics can help businesses understand feature engagement, activation, and usage patterns that may become useful inputs to a predictive workflow.
Meanwhile, website analytics provides information about traffic sources, visitor interactions, and conversions.
Historical outcomes are essential
Customer activity alone isn’t enough for many predictive models.
You also need records of what happened afterward.
For churn prediction, that means knowing which customers canceled and which remained active.
For lead scoring, you need historical leads and their eventual sales outcomes.
The model learns by comparing earlier customer information with these known results.
How much data do you need?
There’s no universal minimum.
The amount depends on the prediction task, model complexity, outcome frequency, and consistency of historical data.
A business with 10,000 customers but only 20 recorded churn events may struggle to build a reliable churn model.
A smaller dataset with consistent tracking and enough examples of the outcome may be more useful.
Start by assessing whether your data supports the specific prediction you want to make.
Types of predictive customer analytics models
Different predictive models answer different customer-related questions.
Here are eight common types.
| Model | What it predicts | Business application |
|---|---|---|
| Churn prediction | Probability of customer cancellation | Retention |
| Purchase propensity | Likelihood of purchasing | Marketing personalization |
| Predictive lead scoring | Probability of a sales outcome | Lead prioritization |
| Customer lifetime value | Expected future customer value | Budget allocation |
| Next-purchase prediction | Timing or likelihood of another purchase | Lifecycle marketing |
| Conversion propensity | Likelihood of completing a conversion | Funnel optimization |
| Expansion propensity | Probability of upgrading or expanding | Account growth |
| Demand forecasting | Future customer or product demand | Business planning |
1. Customer churn prediction
Churn prediction estimates the likelihood that a customer will stop using or paying for a product within a defined period.
Common inputs include product activity, subscription history, support interactions, and engagement trends.
Example: A SaaS company predicts which accounts are likely to cancel within the next 30 days.
Accounts with elevated risk can be reviewed by customer success teams.
This is different from churn analysis, which examines historical customer losses and patterns.
2. Purchase propensity modeling
Purchase propensity models estimate how likely a customer or prospect is to make a purchase.
They may use browsing behavior, purchase history, engagement, and other relevant signals.
Example: An ecommerce business identifies returning visitors who have a high probability of purchasing a particular product category.
Marketing teams can use these predictions to make offers more relevant.
However, purchase likelihood doesn’t necessarily indicate that an offer will cause someone to buy.
3. Predictive lead scoring
Predictive lead scoring estimates how likely a lead is to reach a defined sales outcome.
This might be becoming a qualified opportunity, booking a demo, or closing a deal.
Example: A B2B company evaluates historical leads using firmographic information, website engagement, and CRM activity.
The model assigns higher scores to leads with patterns associated with previous successful opportunities.
Sales teams can use these scores alongside qualification criteria and account context.
4. Customer lifetime value forecasting
Predictive customer lifetime value models estimate the future value a customer may generate.
They may consider purchase frequency, expected retention, average revenue, and profit margins.
Example: A subscription business forecasts which customer groups are likely to generate more revenue over the next 12 months.
The business can use these forecasts to evaluate acquisition spending and retention investments.
Understanding customer lifetime value helps distinguish historical revenue from expected future value.
5. Next-purchase prediction
Next-purchase models estimate when a customer may buy again or which product category they may consider.
These models are particularly relevant to ecommerce and recurring-purchase businesses.
Example: A retailer uses historical purchase intervals to estimate when customers may need to reorder consumable products.
Marketing teams can schedule reminders around the predicted purchase window.
6. Conversion propensity modeling
Conversion propensity models estimate the likelihood that a visitor or lead will complete a defined action.
That action might be registering, requesting a demo, or making a purchase.
Example: A SaaS company identifies visitors whose engagement patterns resemble those of previous demo-booking customers.
The team can investigate which experiences support conversion and test relevant improvements.
Combining these predictions with funnel analysis can help teams understand where users currently abandon important steps.
7. Expansion propensity modeling
Expansion propensity models estimate which existing customers may be likely to upgrade, purchase additional services, or expand their accounts.
Useful inputs may include product usage, account growth, feature adoption, and subscription history.
Example: A SaaS company identifies accounts approaching usage limits or regularly adopting advanced features.
Account teams can investigate whether those customers would benefit from additional capabilities.
8. Customer demand forecasting
Demand forecasting estimates future customer activity or product demand.
It often relies on historical trends, seasonality, and other relevant factors.
Example: An ecommerce business forecasts demand for different product categories during the next quarter.
These forecasts can help with inventory, campaign planning, and resource allocation.
Unlike individual propensity models, demand forecasts often focus on aggregated customer behavior.
Predictive analytics vs. descriptive and prescriptive analytics
Not every form of customer analytics predicts the future.
Understanding the differences helps businesses choose the right approach.
| Analytics type | Main question | Example |
|---|---|---|
| Descriptive | What happened? | 200 customers canceled last month |
| Diagnostic | Why might it have happened? | Cancellations were concentrated among low-engagement accounts |
| Predictive | What is likely to happen? | 300 accounts have elevated cancellation risk |
| Prescriptive | What should we do? | Compare retention interventions to choose an effective response |
Predictive analytics estimates possible outcomes.
Prescriptive analytics goes further by helping evaluate potential actions, often using optimization, decision rules, or causal evidence.
For a deeper comparison, read our guide to predictive vs. prescriptive analytics.
See Usermaven in action
Book a free demo and discover how powerful analytics can grow your business.
8 practical use cases of predictive customer analytics
Predictive customer analytics can support decisions across marketing, sales, product, and customer success.
1. Identify customers at risk of churning
Predictive models can highlight accounts whose behavior resembles that of customers who previously canceled.
Customer success teams can review these accounts, investigate problems, and prioritize appropriate outreach.
Success metric: Reduction in customer churn or improvement in retained revenue, ideally measured against a comparison group.
2. Prioritize leads with higher conversion potential
Sales teams can use predictive lead scores to identify prospects more likely to become qualified opportunities or customers.
This may help reduce time spent on low-fit leads.
Success metric: Opportunity conversion rate, sales efficiency, or revenue per contacted lead.
3. Forecast customer lifetime value
Businesses can estimate expected future customer value and compare it across acquisition sources or customer segments.
These forecasts may support more informed budget allocation.
Success metric: Forecast accuracy and profitability of acquisition or retention decisions.
4. Personalize customer experiences
Predictive models can estimate which products, content, or experiences may be relevant to different customers.
For example, an ecommerce business may use purchase propensity to prioritize recommendations.
Success metric: Incremental conversion rate, revenue, or engagement rate.
5. Identify expansion opportunities
B2B companies can identify accounts showing signals associated with upgrades or additional purchases.
Account managers can then investigate whether an expansion opportunity exists.
Success metric: Expansion revenue and upgrade conversion rate.
6. Improve customer onboarding
Predictive models can estimate which new users are unlikely to activate successfully.
Teams can use these signals to investigate onboarding problems and test targeted assistance.
For example, a user who repeatedly encounters setup errors may need different support from someone who simply hasn’t returned.
Success metric: Activation rate and time to value.
7. Plan customer engagement campaigns
Next-purchase and engagement models can help marketing teams estimate when customers may be receptive to relevant communications.
This can support better campaign timing and audience selection.
Success metric: Incremental purchases, engagement, or campaign profitability.
8. Allocate marketing resources more effectively
Businesses can combine predicted customer value, conversion propensity, and acquisition costs to evaluate marketing opportunities.
However, forecasts should be considered alongside actual conversion and revenue performance.
For example, multi-touch attribution can help teams understand recorded marketing contributions, while predictive models estimate possible future outcomes.
These methods answer different questions and can complement each other.
Predictive customer analytics example for a B2B SaaS company
Let’s look at a hypothetical example of a SaaS company trying to reduce churn.
The company has 10,000 active subscription accounts and wants to predict which ones are likely to cancel within the next 30 days.
Step 1. Define the prediction
The objective is to estimate each active account’s probability of cancellation within 30 days.
Step 2. Gather historical data
The company collects:
- Account age.
- Subscription plan.
- Weekly product activity.
- Core feature usage.
- Support interactions.
- Previous billing events.
- Historical cancellation outcomes.
Only information available before each prediction date is included.
Step 3. Train and validate the model
The team trains a churn prediction model using historical account records.
It evaluates the model on a later, separate period to test how well it performs on unseen data.
Step 4. Group accounts by predicted risk
The model assigns risk probabilities.
For illustration, the company groups accounts into three categories.
| Risk group | Accounts | Observed 30-day churn rate |
|---|---|---|
| Low risk | 6,000 | 2% |
| Medium risk | 3,000 | 7% |
| High risk | 1,000 | 24% |
These are hypothetical results, not actual Usermaven customer data.
The high-risk group has a higher observed churn rate, suggesting that the model can help prioritize investigation.
However, the company still needs to evaluate calibration, precision, recall, and performance across relevant customer groups.
Step 5. Take action
The customer success team reviews high-risk accounts.
It investigates whether customers are experiencing setup problems, reduced engagement, unresolved support issues, or other difficulties.
Rather than automatically sending the same discount to every high-risk customer, the team chooses interventions based on the available evidence.
Step 6. Measure business impact
The company compares outcomes for customers receiving an intervention with an appropriate control group.
This helps determine whether the retention strategy actually improves results.
A prediction model can identify risk, but it doesn’t prove which action will prevent churn.
How to implement predictive customer analytics
You don’t need to begin with an advanced machine learning system.
A smaller, focused project is often a better starting point.
1. Choose one measurable use case
Start with a problem that has a clear business outcome.
For example, reducing churn or improving lead qualification.
Avoid trying to predict every customer behavior at once.
2. Audit your available data
Check whether you have reliable historical data, enough examples of the target outcome, and consistent customer identifiers.
If important events are missing, improve tracking before building the model.
3. Establish a baseline
Compare the proposed predictive model with a simpler approach.
For example, a rule identifying customers with no activity in the last 14 days may provide a useful churn-risk baseline.
A more complex model should demonstrate additional value.
4. Build and validate a small model
Start with an interpretable model when appropriate.
Test it on unseen data and evaluate whether its predictions are reliable enough for the intended decision.
5. Connect predictions to a workflow
Decide who will use the predictions and what actions they can take.
A churn score without an owner or defined response process may provide little business value.
6. Test the business impact
Measure whether using the predictions improves outcomes compared with existing processes.
For example, test whether model-guided retention outreach performs better than the current approach.
7. Monitor results over time
Review model quality, customer outcomes, and changes in underlying data.
Update the model or workflow when performance declines.
How to measure predictive analytics performance
A model that appears accurate isn’t necessarily useful.
The right evaluation depends on the business problem.
| Metric | What it measures | When it’s useful |
|---|---|---|
| Precision | Share of predicted positives that are correct | When false alerts are costly |
| Recall | Share of actual positives successfully identified | When missing at-risk customers is costly |
| ROC-AUC | Ability to rank positive outcomes above negative ones | General binary classification |
| PR-AUC | Precision-recall tradeoff across thresholds | Rare outcomes such as churn |
| Calibration | Whether predicted probabilities match observed frequencies | When using probability scores |
| Mean absolute error | Average absolute prediction error | Revenue or demand forecasts |
For example, imagine that only 5% of customers churn.
A model that predicts everyone will stay would be 95% accurate, but it would identify none of the customers at risk.
That’s why accuracy alone is often insufficient.
Model performance vs. business performance
It’s also important to distinguish between two questions:
- Does the model predict outcomes reliably?
- Does acting on those predictions improve business results?
A model may rank customers accurately without producing meaningful revenue or retention improvements.
The ultimate measure of success is whether the predictive workflow helps the business make better decisions.
Benefits of predictive customer analytics
When implemented appropriately, predictive analytics can provide several advantages.
More proactive customer retention
Instead of waiting until customers cancel, businesses can identify warning signals and investigate potential problems earlier.
Better sales prioritization
Predictive lead scoring can help teams focus on prospects with stronger estimated conversion potential.
More relevant customer experiences
Purchase and engagement propensity models can support more personalized communications and product experiences.
Improved resource allocation
Forecasts can help businesses evaluate where marketing, sales, and customer success resources may have the greatest value.
Stronger planning
Demand and lifetime value forecasts can support revenue planning, budgeting, and growth decisions.
These are potential benefits, not guaranteed outcomes. Results depend on model quality, data availability, implementation, and how predictions are used.
Common challenges and mistakes in predictive customer analytics
Predictive analytics introduces several risks that businesses need to manage.
Poor data quality
Missing events, duplicate records, and inconsistent customer identifiers can reduce prediction reliability.
Data leakage
Using information that wouldn’t have been available at prediction time can make a model appear more accurate than it really is.
Biased historical data
Models may reproduce patterns and inequalities present in historical customer records.
Evaluate whether predictions create unfair or inappropriate outcomes across relevant groups.
Overfitting
A model may perform well on training data but poorly on new customers.
Proper validation and ongoing monitoring help identify this problem.
Model drift
Changes in customer behavior, products, or markets can reduce predictive performance over time.
Privacy and consent
Customer predictions may involve personal information.
Businesses should follow applicable privacy requirements, minimize unnecessary data collection, and apply appropriate access controls.
Confusing prediction with causation
A model may show that customers with low product engagement have higher churn risk.
That doesn’t prove that increasing engagement will prevent cancellation.
Use experiments or other suitable causal methods to evaluate interventions.
Using predictions without a clear action
A predictive score is only useful when someone understands how to interpret it and what decision it supports.
When should a business use predictive customer analytics?
Predictive analytics is most useful when a business has:
- A recurring decision that could benefit from forecasting.
- Reliable historical customer data.
- Enough examples of the outcome being predicted.
- A clear way to act on predictions.
- Resources to monitor and evaluate performance.
It may not be the right starting point for a business with inconsistent tracking, very limited historical outcomes, or no process for acting on the results.
In those situations, improving descriptive analytics, customer segmentation, and reporting may deliver more immediate value.
How Usermaven helps you understand customer behavior and growth opportunities
Predictive analytics depends on reliable customer data.
Before a business can estimate future behavior, it needs to understand how customers discover its product, interact with it, move through the funnel, and contribute to revenue.
That’s where Usermaven can help.

Usermaven is an AI-powered marketing attribution platform that connects marketing spend and customer journeys to conversions, pipeline, and revenue.
It combines website and product analytics, multi-touch attribution, customer journey analysis, and AI-powered insights to help teams make better growth decisions.
Understand customer behavior across the journey
With Usermaven’s User Journeys, you can investigate how visitors and customers interact with your website and product.
You can explore common paths, important touchpoints, and differences between customer groups.
This helps teams understand observed behavior and identify patterns worth investigating.
Identify conversion and retention patterns
Usermaven’s Funnels, Segments, and retention analysis capabilities help teams examine customer behavior across important stages.
For example, you can investigate which customer groups abandon onboarding or whether retention differs across acquisition sources.
These insights can support decisions about customer experience and may provide useful inputs for a separate predictive modeling workflow.
Connect marketing performance to revenue
Predicting which customers may become valuable is one part of growth analysis.
Understanding which marketing activities contribute to actual business outcomes is another.
Usermaven’s attribution capabilities help teams examine how recorded marketing interactions contribute to conversions, pipeline, and revenue.
With connected CRM outcomes, marketing teams can evaluate performance beyond clicks and leads.
This provides a stronger foundation for decisions about acquisition spending and customer value.
Investigate changes with Maven AI
Maven AI helps teams analyze connected marketing and product data through natural-language questions.
For example, you can ask:
- “Which customer segments have the lowest retention?”
- “Where are users dropping off during onboarding?”
- “Which acquisition channels generate the most revenue?”
- “How has conversion performance changed this month?”
Maven AI can help investigate patterns and create reports or dashboards from connected data.
You can also configure AI Agents to monitor selected metrics and workflows on a recurring schedule.
Usermaven provides customer analytics, attribution, and AI-assisted analysis. These capabilities should not be confused with a dedicated predictive modeling system that automatically trains churn or purchase-propensity models.
Understand your customers before making your next growth decision.
Usermaven helps you connect customer behavior, marketing performance, and revenue outcomes so you can identify opportunities and invest more confidently in what works.
Book a demo to see how Usermaven can help you analyze customer journeys and marketing performance.
See Usermaven in action
Book a free demo and discover how powerful analytics can grow your business.
How PostNitro improved conversions with Usermaven
PostNitro used Usermaven to understand how visitors moved through onboarding, identify drop-off points, and recognize high-intent behavior. These insights helped the team introduce an interactive demo experience, which achieved an approximately 70% demo-to-signup conversion rate.
This shows how understanding customer behavior can help businesses identify opportunities and make more informed growth decisions.
Read the full PostNitro case study.
In summary
Predictive customer analytics helps businesses estimate what customers may do next, from purchasing and converting to upgrading or canceling.
The most useful predictions start with a clear business question, reliable historical data, and a model that’s properly evaluated.
But forecasting is only part of the process.
Businesses also need to understand what the predictions mean, choose appropriate actions, and measure whether those actions improve results.
Start with one practical use case, validate the model, and expand only when the approach demonstrates measurable value.
FAQs
1. What is an example of predictive customer analytics?
A SaaS company using historical product activity and subscription records to estimate which customers are likely to cancel within the next 30 days is an example of predictive customer analytics. The results can help prioritize customer success investigations.
2. Is predictive customer analytics the same as AI?
No. Predictive analytics can use machine learning and AI, but it can also use traditional statistical methods. AI is a broader category of technologies, while predictive analytics focuses on estimating future outcomes.
3. Can small businesses use predictive customer analytics?
Yes, if they have a clear use case and sufficient relevant data. Small businesses can begin with simple statistical models or rule-based baselines before investing in more advanced systems.
4. What are some examples of predictive analytics?
Amazon and Netflix are examples of predictive analytics.
Amazon uses predictive models to upsell and cross-sell with informed product suggestions to individual customers. This recommendation is based on users’ browsing and purchase history, showing products that might be valuable in addition to their purchases. Those selling on Amazon can benefit from these insights by aligning their product offerings with customer preferences to boost visibility and sales.
Netflix has an AI AI-powered algorithm that makes predictions using watch & search history, demographics, and other factors. According to a survey, Netflix’s recommendation algorithm influenced 75 – 80 % of the user activity.
5. What is the difference between predictive segmentation and behavioral segmentation?

Written by
Lauren Brooks
Lifecycle Marketing Strategist
Lauren Brooks is a lifecycle marketing strategist with 4+ years of experience helping SaaS businesses create meaningful customer experiences. She specializes in user engagement, retention, and conversion optimization, helping brands build stronger customer relationships beyond acquisition.
All articles by Lauren →