Getting lost in the complexities of analytics can be frustrating (shh! nobody is referring to Google Analytics 4).
But, if the product onboarding is tons of work, too!
You’d probably give up, right?
Wait, we are here!
New to Usermaven? We want to make sure our users are fully equipped to ace the product onboarding methods, tips, and tricks.
That’s why we ensure that Usermaven allows a smooth onboarding experience. For those who still have difficulty in SaaS product onboarding, this guide will definitely help.
Let’s get started.
Why is product onboarding important?
Product onboarding is the gateway to a successful user journey, especially crucial for SaaS companies relying on subscription-based models.
It’s where users form their initial impression and decide whether to stick around.
A smooth onboarding experience can skyrocket your success, while a bumpy one can send users running for the hills- and Usermaven totally gets it!
Know your users: Segment them based on needs and tailor onboarding experiences accordingly.
Define “activation“: Identify the key moment when users find value and guide them towards it.
Keep it frictionless: Make signup quick and easy, removing unnecessary hurdles.
Use clear copy: Keep instructions concise and focused on what users need to know.
Interactive walkthroughs: Engage users with personalized, step-by-step guidance relevant to their goals.
Pro tip: You can even track your user’s journey during onboarding.
Remember
Onboarding is an ongoing process, not a one-time event.
Data and analytics are your friends. Use them to track progress and optimize your onboarding flow.
There’s no one-size-fits-all approach—experiment and adapt to find what works best for your users.
Onboarding queries in Usermaven
Below is an example of a query we received about onboarding. A new customer sought guidance on tracking their “Sign Up” process.
Our team efficiently addressed the query, and the user expressed satisfaction with our response. We are committed to providing reliable service for our valued customers.
Now, let’s talk about how Usermaven provides easy and smooth product onboarding, allowing you to have a no-code analytics experience.
Onboarding insight in Usermaven
Usermaven’s dedicated “Product Insights“ section offers a hassle-free approach to monitoring essential onboarding metrics. This includes tracking user engagement, identifying completion rates, and evaluating conversion rates based on user-specific or company-wide perspectives.
Setting up onboarding insight in Usermaven
Creating an onboarding insight in Usermaven is a straightforward process.
Navigate to “Product Insights,” select “Onboarding,” and click “Create New.”
Provide a name, add onboarding steps, choose the order, and set the window size for your funnel. Save your insight to begin tracking onboarding metrics seamlessly.
Managing insights in Usermaven
Usermaven provides a central hub for managing insights. From the “Manage Insights” section, you can edit, delete, or set insights as default. These controls empower you to tailor your tracking approach based on evolving needs.
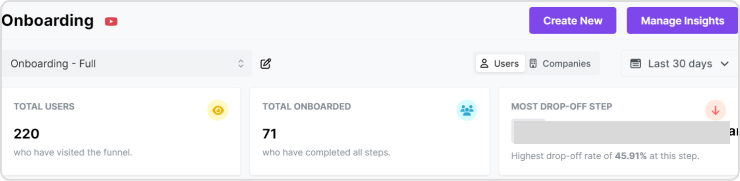
Overview of the onboarding dashboard
Accessing the Onboarding Dashboard in Usermaven provides a quick snapshot of key metrics like Total Users, Total Onboarded Users, and Identifying Drop-Off Points. These insights serve as a foundation for further analysis.
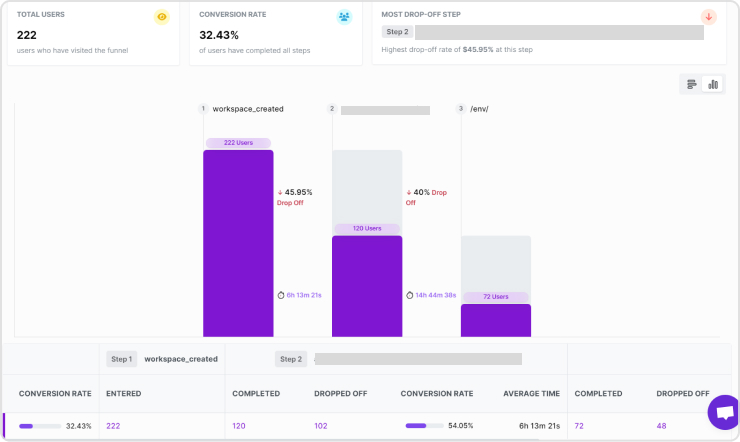
Deep dive into onboarding insights
For a detailed view, click on the ‘Deep Dive’ button to access in-depth statistics and insights about user behavior within the specific funnel. Metrics such as Entered, Completed, Drop-off Rate, Overall Conversion Rate, and Average Time offer a comprehensive understanding of user progression.
Funnel breakdown for in-depth analysis
Usermaven allows a breakdown of onboarding funnel traffic based on location, technology, and the first touchpoint. This granular view aids in identifying influential factors contributing to drop-offs and optimizing strategies for specific regions, devices, or sources.
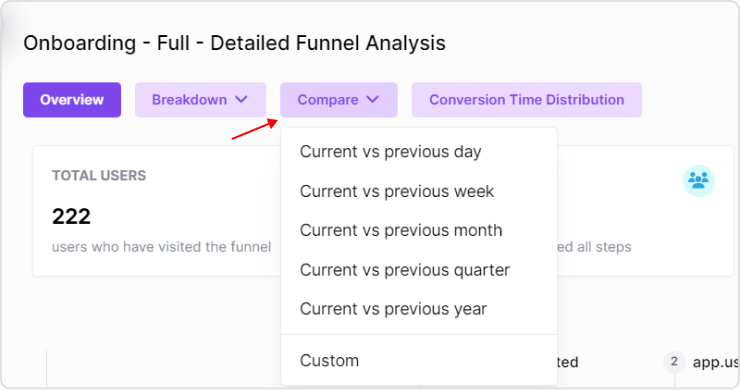
Funnel comparison for trend analysis
Comparing onboarding funnels over different time periods helps identify trends and assess the impact of changes. Evaluate performance for the current day against previous days, weeks, months, or set custom date ranges for a thorough trend analysis.
Conversion time distribution analysis
The Detailed Funnel Analysis Dashboard provides insights into time-related metrics, including average time for each step and the entire funnel. Visual representations and detailed insights empower you to optimize user engagement based on time dynamics.
User details for individualized insights
The ‘User Details‘ section offers a breakdown of users who completed or dropped off at each onboarding step. This detailed information, including user names, first seen, and last seen timestamps, aids in analyzing completion rates and identifying potential drop-off points.
Conclusion
With Usermaven’s easy-to-use product onboarding insights, you can understand user behavior, identify friction points, and optimize the onboarding experience for better outcomes.
Keep in mind that a seamless onboarding journey is crucial for acquiring and retaining users.
As a SaaS attribution software, Usermaven goes beyond onboarding analytics by helping you understand which channels, campaigns, and touchpoints drive user activation and long-term customer value. With these insights, you can ensure users get the most from your product from day one and set them up for success.
A SaaS marketing team evaluates six attribution tools over three months and signs a $ 24,000-a-year contract. Eight weeks into implementation, they realize the tool tracks pipeline beautifully but has no idea what happens to a customer after the deal closes. Choosing the wrong attribution tool is expensive twice, once in the contract, once in […]
Your traffic is up. But revenue isn’t. What’s going on? When marketers open their web analytics dashboard, sessions are usually the first number they check. It tells you how many times people visited your site, but a rising session count doesn’t always mean things are going well. In analytics, the number of sessions is the […]
Every company wants better data. But better data does not come from adding another dashboard, tracking every possible event, or giving the data team a long list of reports to build. That is where many analytics implementation projects start to go wrong. The tool may be powerful. The data may be there. The team may […]