Incrementality testing measures the additional conversions or revenue caused by a marketing activity by comparing observed outcomes with a credible estimate of what would have happened without it. The strongest tests assign comparable customers or markets to treatment and control conditions before measuring lift.
A campaign might claim 360 purchases, but a valid holdout can reveal how many would have occurred anyway. That distinction matters when deciding whether a channel deserves more budget, not just more attribution credit.

This practical guide shows how to select an experiment, set up assignments and revenue tracking, calculate four different lift measures, detect broken tests, and make a decision without overstating the evidence.
Key takeaways
Causal question: A test estimates what advertising changed; attributed conversions alone cannot supply the counterfactual.
Assignment comes first: Keep eligible treatment and control populations comparable, with stable assignments and enforceable exclusions.
Power before launch: Set the business-relevant effect, primary metric, sample size, conversion lag, and analysis plan in advance.
Four lift measures: Percentage-point lift, relative lift, incremental conversions, and incremental share answer different questions.
Test integrity: Audit group allocation, contamination, outcome coverage, and stopping rules before trusting the point estimate.
Business decision: A statistically uncertain or economically small lift should not trigger automatic budget increases.
What is incrementality testing?
Incrementality testing is a controlled way to estimate how a marketing intervention affects a business outcome. The intervention might be showing retargeting ads, increasing spend in selected markets, or withholding a campaign from a randomly chosen audience.
Its central concept is the counterfactual: the outcome that would have occurred for the treated population without the intervention. Because that outcome cannot be observed directly, a study needs a credible comparison.
| At a glance | Practical definition |
|---|---|
| Purpose | Estimate the causal effect of a defined marketing change |
| Treatment | Eligible group assigned to receive the intervention |
| Control | Comparable group assigned to the no-intervention condition |
| Primary output | Incremental conversions, revenue, or another preselected outcome |
| Best use | Validate whether material campaigns or spending changes add value |
| Main failure risk | Biased assignment, contamination, incomplete outcomes, or imprecise results |
This article focuses on implementing a trustworthy test. The broader role of incrementality in marketing includes deciding where causal measurement fits alongside other marketing methods.
Unlock insights that drive growth
How do incrementality tests establish causality?
In a randomized holdout, eligible participants are assigned to treatment or control before the outcome occurs. Randomization helps balance known and unknown influences between groups; the holdout estimates what the treated population might have done without advertising.
Assignment is not the same as exposure
A customer assigned to treatment may never actually see an ad. Comparing only customers who were exposed with customers who were not exposed can reintroduce bias, because ad delivery and customer activity may be related.
For the primary intention-to-treat estimate, compare outcomes according to original assignment when that aligns with the experiment objective. Document actual exposure separately as an execution or diagnostic measure.
Different experiments answer different questions
A user-level ad holdout tests eligibility for a defined campaign. A geographic spend increase tests a market-level intervention. The resulting effects describe those conditions; they do not automatically generalize to every campaign or future budget.
The difference between campaign credit and experimental evidence is particularly important when interpreting incrementality vs. attribution reports side by side.
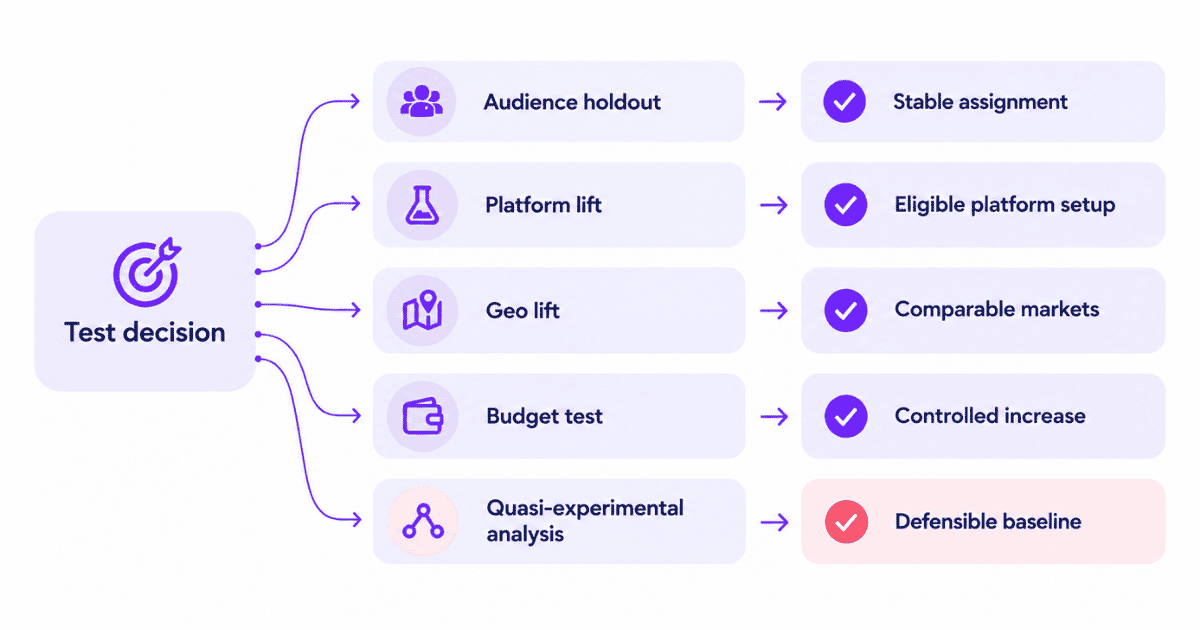
Which incrementality test should you run?
Choose the design that best represents the intended decision and can be executed without unacceptable contamination. An elegant experiment that a media team cannot enforce is not a credible experiment.
| Method | Suitable decision | Main execution requirement | Limitation |
|---|---|---|---|
| Randomized audience holdout | Does retargeting add purchases? | Stable user/account assignment and ad exclusions | Control leakage and cross-device identity |
| Platform conversion lift | Does an eligible platform campaign create lift? | Platform-supported campaign, conversions and scale | Account eligibility and platform scope |
| Geo lift experiment | Does regional spend add sales? | Comparable markets, pre-period data and spillover controls | Few assignment units and market shocks |
| Budget-change test | Does another $10K of spend pay back? | A controlled increase and relevant comparison | Marginal response may vary with spend |
| Quasi-experimental analysis | What if randomization is unavailable? | Defensible counterfactual and sensitivity checks | Relies on untestable or strong assumptions |
In AppsFlyer’s documented remarketing approach, eligible audiences are split before sending treatment groups to connected ad partners while the control group is withheld. The remarketing incrementality setup illustrates why control exclusion must be implemented, not merely reported.
External evidence 1 of 2. AppsFlyer describes its own premium workflow; its specific allocation settings are not universal requirements.
What about TV, offline, and blended media?
When user-level exposure control is not feasible, geographic tests can evaluate region-level TV, retail, or blended-media interventions. Test feasibility depends on stable historical outcomes, comparable markets, intervention strength, and limited spillover.
A marketing agency managing mixed channels should document whether the intervention covers one campaign, one channel, or the entire paid-media plan; the difference determines which budget decision the result can inform.
How to plan an incrementality experiment
A credible test begins with a short pre-registered plan. The plan protects the study from shifting definitions once preliminary results become visible and gives the analyst a clear set of checks.
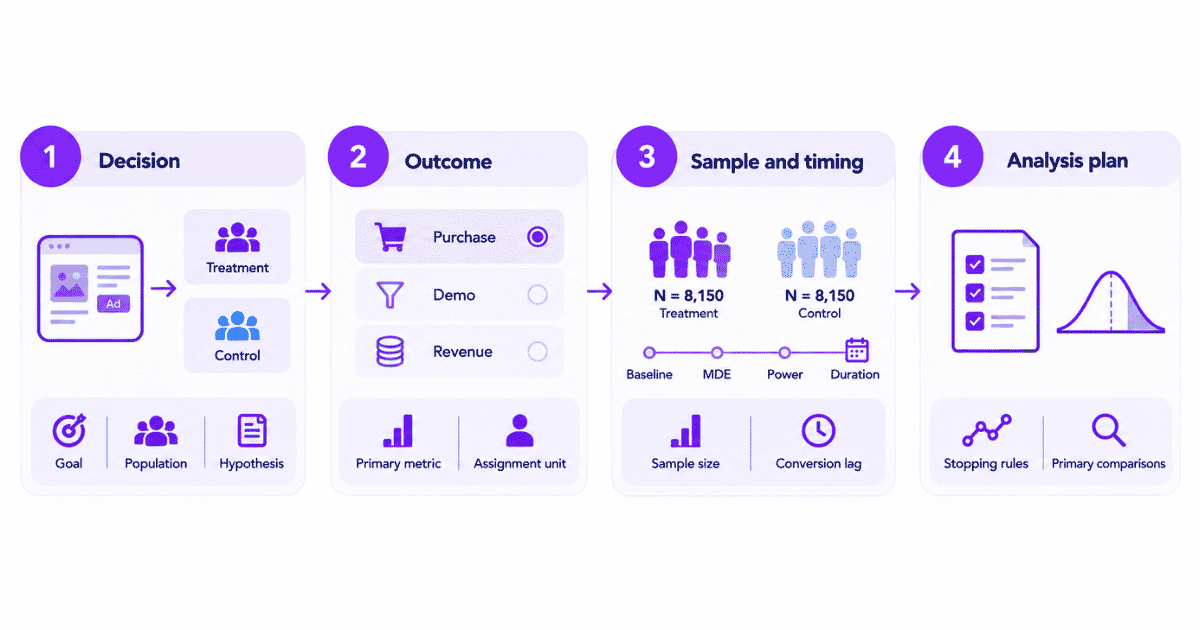
1. Define the decision and hypothesis
Write the business decision first: “Should we continue this retargeting campaign at its current spend?” Then state a testable hypothesis, such as whether eligibility for retargeting increases the purchase rate among recent non-purchasers.
Specify treatment, control, eligible population, primary outcome, and who is authorized to act on the result. A hypothesis about purchases should not be replaced mid-test with an easier-to-improve click metric.
2. Pick the outcome and assignment unit
Choose one primary metric before launch, such as purchasers per eligible customer, net purchase revenue, or qualified opportunities per assigned account. Secondary metrics can help explain the result but should not silently become the new success criterion.
Choose the assignment unit that matches how treatment can be delivered and outcomes measured. User-level tests may need stable cross-device IDs; sales-led tests may need account-level assignment to prevent colleagues from entering different conditions.
For long B2B cycles, clearly distinguish a booked demo or pipeline stage from closed-won revenue. Connected outcomes in a B2B SaaS measurement workflow can help report the funnel, but a lead lift should not be described as proved revenue lift.
3. Plan sample size, MDE, and duration
Minimum detectable effect (MDE) is the smallest effect the study is designed to detect with specified power and false-positive risk. Determine the baseline conversion rate, MDE, group allocation, power, significance level, and expected conversion lag before scheduling the test.
A smaller target effect generally requires more eligible participants. Duration should follow the sample and conversion maturation plan, not an arbitrary promise that every test needs two weeks.
For scale, a fixed-sample two-sided comparison designed to detect an increase from 5% to 6%, at 5% significance and 80% power, needs approximately 8,150 people per group under simple independent-binomial assumptions. Our later 6,000-per-group example illustrates the formulas, but is not a substitute for this prospective power calculation.
| Planning input | Illustrative question | Why it changes the design |
|---|---|---|
| Baseline rate | Do about 5% of eligible customers buy? | Determines expected outcome volume |
| MDE | Would a 1-point absolute change justify the cost? | Sets the smallest target signal |
| Statistical power | Is an 80% detection chance appropriate? | Affects sample requirements |
| Significance level | What false-positive risk is accepted? | Influences decision threshold |
| Assignment ratio | Is 50/50 feasible for the business? | Affects precision and holdout cost |
| Conversion lag | Do purchases mature within seven or 30 days? | Defines post-intervention observation |
For geo experiments, the power assessment should operate at the market level and account for historical variation. Thousands of purchases across a handful of regions do not create thousands of independent randomized markets.
See what's working. Fix what's not. Grow faster.
4. Fix analysis and stopping rules in advance
Specify whether the study uses a fixed sample or a statistically valid sequential procedure, how many primary comparisons will be made, and when results will be evaluated. Repeatedly stopping at the first attractive p-value can invalidate a fixed-sample analysis.
Spotify’s experimentation curriculum highlights sample-ratio mismatch, inadequate power, and result interpretation as recurring experiment failures. Use those principles to finalize the analysis plan before launch.
External evidence 2 of 2. Spotify is cited here for general experimentation quality, not marketing-platform product capabilities.
How to set up treatment and control groups
An experiment plan becomes credible only when the assignment and exclusion rules actually operate as intended. These setup decisions should be checked before activating media.
Keep the randomization unit stable
Generate and persist the assignment in the system that controls the intervention. If a customer is assigned to the holdout, subsequent sessions and eligible devices must not silently switch that customer into treatment.
For account-level B2B testing, keep all relevant account members in the same condition. For market tests, record the exact geo boundaries and dates used to deliver or withhold spending.
Enforce the control exclusion
An audience holdout requires that control participants remain outside the tested campaign. Check account exclusions, retargeting lists, partner audience sync, frequency policies, and overlapping campaigns that could deliver equivalent treatment.
Record where residual exposure is unavoidable. A clean holdout with modest sample size is usually easier to interpret than a larger one with uncontrolled overlap.
Log assignment independently of conversion
Keep the denominator as all eligible assigned participants, including customers who never return to the website. Building the treatment denominator from visitors who clicked or saw an ad can bias the estimated effect.
A useful implementation pattern is assignment service → stable participant ID → assignment log → purchase or goal event → design-aware analysis. Product tracking can support the log, but it must not decide the experimental validity.
How to calculate incremental lift
The same experiment can produce several correct lift values with different interpretations. Publish the label and denominator with every result, rather than presenting an unlabeled “20% incremental” claim.
ILLUSTRATIVE CAMPAIGN / EQUAL-SIZE RANDOMIZED GROUPS
| Metric | Treatment | Control |
|---|---|---|
| Eligible customers | 6,000 | 6,000 |
| Customers purchasing | 360 | 300 |
| Conversion rate | 6.0% | 5.0% |
Absolute lift in percentage points
Absolute lift = Treatment rate − Control rate. Here, 6.0% − 5.0% = 1.0 percentage point. This is the difference in observed conversion rates, not a 1% relative improvement.
Relative lift against the control rate
Relative lift = (Treatment rate − Control rate) ÷ Control rate × 100. Here, 1 percentage point ÷ 5% = 20%. Treatment converted 20% more often than the control baseline.
Estimated incremental conversions
With equal-sized groups, the estimate is 360 − 300 = 60 additional purchases in the treatment population. If group sizes differ, apply the control conversion rate to the treatment population before subtracting.
Incremental share of treatment conversions
Incremental share = Estimated incremental purchases ÷ Treatment purchases × 100. Here, 60 ÷ 360 = 16.7%. This is the estimated share of treatment purchases above the no-treatment baseline, not the 20% relative lift.
| Lift measure | Example result | What it means |
|---|---|---|
| Absolute conversion lift | 1.0 percentage point | Difference between the two conversion rates |
| Relative lift | 20% | Difference relative to the control rate |
| Incremental conversions | 60 | Estimated added purchases in treatment |
| Incremental share | 16.7% | Estimated added share of treatment purchases |
These four metrics describe a point estimate. A basic two-proportion analysis of 360/6,000 and 300/6,000 would produce an approximate 95% confidence interval of about 0.18 to 1.82 percentage points for the rate difference, conditional on independent assignment and ordinary binomial assumptions.
That interval does not validate the experiment design. It also would not apply unchanged to account-clustered, geo, repeatedly monitored, or otherwise dependent observations.
To evaluate the revenue consequences rather than purchases alone, keep the monetary outcome definition consistent. The role of a credible baseline is developed in incremental revenue, while incremental revenue attribution separates experimental effects from model-assigned revenue.
How to collect experiment data reliably
For interpretation, marketers need both an immutable record of assignment and a complete record of eligible outcomes. An attribution dashboard alone cannot reconstruct missing holdout assignments.
Build the event and identity specification
The assignment system should emit a durable record keyed to the randomized unit. Every counted purchase should carry a transaction identifier; if outcomes are linked to customers, the join must preserve group membership and deduplicate across channels.
| Field | Purpose | Implementation check |
|---|---|---|
| experiment_id | Identifies the specific intervention | Stable across all events |
| assignment_unit_id | Identifies user, account, or market | Consistent with randomization |
| assigned_variant | Treatment or control label | Written at assignment time |
| assigned_at | Assignment timestamp | Precedes eligible outcome |
| eligible_flag | Flags the pre-declared population | Same criteria for both groups |
| conversion_id | Unique sale or goal event | Deduplicate repeat imports |
| outcome_value / currency | Comparable purchase or revenue value | Use finance-consistent rules |
| occurred_at | Actual outcome timestamp | Matches maturation window |
Record assignments and outcomes in Usermaven
Usermaven’s A/B test tracking documentation describes sending an ab_test_assigned custom event with test_name and variant properties. The same identifiers can accompany relevant goal events, allowing descriptive segmentation in Trends and Funnels.
Those examples are an event-tracking pattern rather than a ready-made randomized marketing holdout. The experiment still requires an external assignment and delivery system, plus design-appropriate statistical analysis.
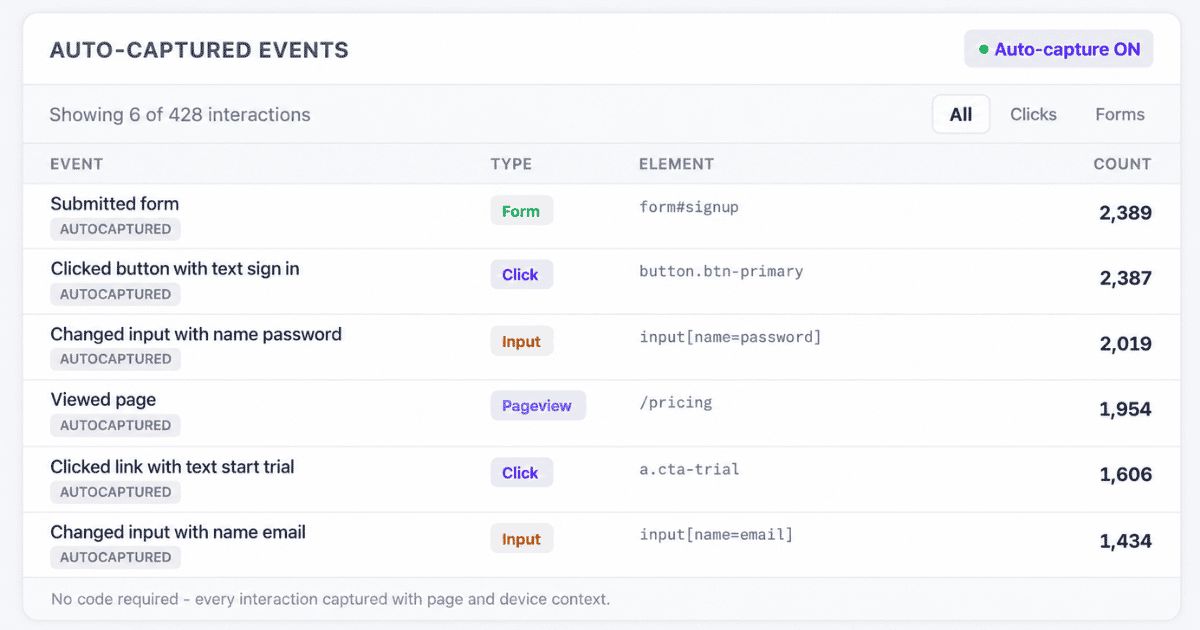
Meaningful outcome events can be configured through conversion goals and monitored in Events. When a purchase happens off-site, Event Sources can bring supported verified payments, refunds, or CRM-related events into reporting.
Distinguish funnel exploration from causal estimation
An observed funnel analysis can reveal where assigned groups diverge and whether key events are missing. It does not automatically correct invalid group assignment, exposure leakage, or the dependence structure of a geo experiment.
Similarly, paid ads attribution remains useful for campaign credit between tests. The estimated incremental conversions must still come from the experiment, not from adjusting attribution weights.
How to know whether a test is reliable
Run an integrity audit before interpreting lift. A result that appears statistically precise can still be wrong if group assignment, exclusions, or outcome records were compromised.
Experiment QA: Diagnose before deciding
| Check | Failure signal | Action |
|---|---|---|
| Sample-ratio mismatch | Assigned treatment/control counts deviate unexpectedly | Audit randomizer, eligibility, joins, and dropped events |
| Control contamination | Holdout members receive tested ads | Repair exclusion or narrow claim to actual intervention |
| Pre-period imbalance | Groups materially differ before treatment | Review randomization or matching assumptions |
| Missing outcomes | Orders absent from one group or source | Reconcile against transaction and CRM records |
| Duplicate events | Purchase IDs repeat after import or sync | Deduplicate before counting |
| Conversion lag | Recent cohorts have immature outcomes | Use preregistered observation and maturation windows |
| Unplanned early stopping | Team ended test after first favorable reading | Use fixed-sample or valid sequential procedure |
| Geo spillover | Media reaches neighboring control markets | Reassess market assignment or design |
| Wide uncertainty | Interval includes materially negative and positive outcomes | Label inconclusive and avoid forced scaling |
Usermaven’s Measurement Trust Center can highlight campaign tracking, customer matching, and connection issues that affect observed data. These checks improve measurement hygiene but do not certify randomization or causal identification.
Use a stop, investigate, or proceed rule
Stop when assignment or control exclusion fails and the planned estimand cannot be recovered. Investigate when event completeness or an unexpected allocation split is unresolved. Proceed to inference only when essential integrity checks pass and the predefined analysis can be executed.
Document every correction. Excluding problematic customers after seeing outcomes may itself bias the result, even when it appears to make the groups cleaner.
How to interpret inconclusive or negative lift
An inconclusive test is not proof that advertising does nothing. It means the available evidence does not distinguish the effect from the range of outcomes compatible with the study and its assumptions.
Statistical evidence and business value differ
A small positive lift may be precisely estimated but uneconomic after media costs. A larger point estimate may still be too uncertain to justify scaling. Decision criteria should consider the uncertainty interval and the cost of a wrong budget move.
Negative lift deserves investigation
A negative effect can occur when an intervention crowds out organic conversions, changes customer behavior, or simply performs poorly. It can also arise from chance or a broken comparison. Investigate before turning a negative estimate into a universal channel conclusion.
For spending decisions, iROAS translates incremental revenue into revenue per relevant ad dollar, but still requires contribution-margin and cost checks before claims of profitability.
Common incrementality testing mistakes
The failures below are easy to miss because dashboards can still show clean charts and precise percentages when the underlying comparison is compromised.
| Mistake | Why it matters | Better approach |
|---|---|---|
| Analyze only people who saw an ad | Exposure selection can bias group comparisons | Use assignment-based primary analysis |
| Change the goal mid-test | Increases selective reporting risk | Predefine one primary outcome |
| Use a universal two-week duration | Ignores MDE, power, and conversion lag | Plan duration around feasibility |
| Treat geo markets like independent users | Understates clustering and market variation | Analyze at the assignment-unit level |
| Subtract raw counts from unequal groups | Conflates group size with effect | Normalize to a comparable population |
| Use attributed revenue as causal lift | Attribution does not supply a control | Keep credit separate from experiment estimate |
| Call an uncertain result “no effect” | Absence of precision is not proof of zero | Report bounds and limitations |
Broader marketing measurement should combine continuous reporting with appropriately designed experiments; neither source of evidence should be presented as a universal substitute for the other.
How to turn test results into budget decisions
The test result should be translated into the business choice stated before launch. Do not infer that every additional dollar will deliver the same effect seen at the tested spend and audience.
| Evidence | Practical interpretation | Possible action |
|---|---|---|
| Positive lift, credible and economically worthwhile | Supports benefit within tested conditions | Consider bounded scale-up |
| Positive point estimate, wide interval | Value remains uncertain | Extend evidence or design a more sensitive test |
| Precise near-zero effect | Little value detected for tested intervention | Reassess spend or targeting |
| Credible negative effect | Intervention may be harmful | Investigate and consider reducing activity |
| Failed integrity checks | Effect cannot be relied upon | Repair design; do not claim causal lift |
The ecommerce measurement context is useful when tying purchase events, repeated orders, and net revenue into a decision. For longer B2B cycles, avoid treating an increase in demo bookings as equivalent to incremental closed-won revenue.
A documented result should always state the tested population, intervention, date range, outcome, effect estimate, uncertainty, financial threshold, and what changes next. This becomes an asset the team can revisit when budgets or customer behavior change.
Final verdict on incrementality testing
Incrementality testing is valuable when it answers a specific business question with a credible comparison. Define the decision and outcome first, preserve the treatment/control assignment, plan statistical precision, and verify event collection before interpreting lift.
Use the appropriate lift measure and uncertainty interval rather than a single attractive percentage. A trustworthy result may justify scaling, reducing spend, or running another experiment; an invalid result justifies none of those conclusions.
Accurate conversions and revenue make the analysis easier to defend. To see how Usermaven connects recorded campaign activity, customer journeys, and business outcomes, book a demo.
FAQs
1. What is incrementality testing in marketing?
Incrementality testing estimates the additional conversions or revenue caused by a marketing intervention using a credible counterfactual, often a randomized holdout. It distinguishes outcomes influenced by advertising from outcomes that would have occurred anyway.
2. What is the difference between A/B testing and incrementality testing?
Incrementality testing is a causal application of experimentation to additional business outcomes. A/B testing can optimize versions of an experience; an incrementality study specifically asks whether the intervention changed outcomes relative to no intervention.
3. How do you calculate incremental lift?
Subtract the control outcome rate from the treatment rate for absolute lift. Divide that difference by the control rate for relative lift. Convert the rate difference to incremental outcomes using the relevant treatment population.
4. How long should an incrementality test run?
Duration depends on the baseline outcome rate, minimum detectable effect, allocation, statistical power, conversion lag, and the experimental design. Plan the observation window before launch instead of relying on a universal number of weeks.
5. Can incrementality testing show negative results?
Yes. A valid study may estimate that an intervention reduced the chosen outcome. Interpret the magnitude, uncertainty, contamination risk, and business economics before deciding whether to stop or change the campaign.
6. Can Usermaven run an incrementality experiment?

Written by
Junaid Ahmed
Content Writer & Digital Marketer
Junaid Ahmed is a content and copywriter with 3+ years of experience creating research-driven content across SaaS, B2B, ecommerce, and digital marketing. He specializes in turning complex topics into clear, practical content that helps marketers better understand their challenges, evaluate solutions, and make informed decisions. His work spans educational content, industry insights, and actionable marketing guides.
All articles by Junaid →