We all know data drives decisions. But let’s be honest, getting to the right numbers hasn’t always been easy.
Remember when you had to wait days (sometimes weeks) for analysts or developers to pull a simple report? By the time you finally got the answers, things had already moved on. And if you weren’t code-savvy, you were probably stuck relying on others to understand what was happening in your own campaigns.
That model doesn’t work anymore. Business moves too fast. Teams can’t afford to wait around for the data they need right now.
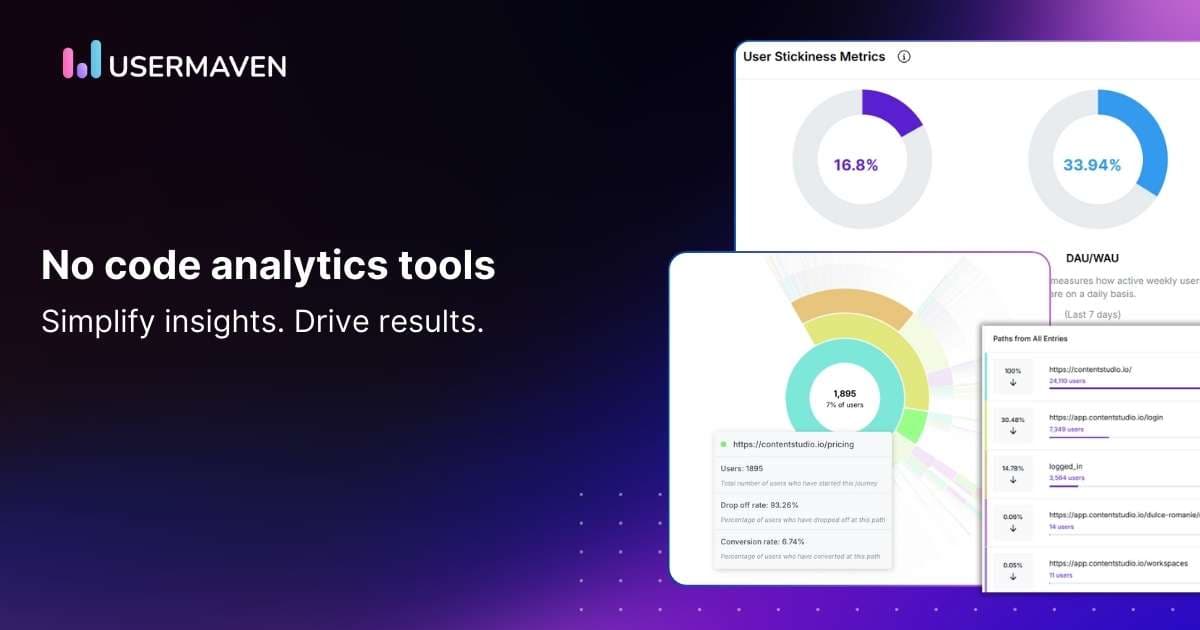
This is where no code analytics tools step in. They take the complexity out of data and give control back to the people who need it most: marketers, product managers, and growth teams.
With a few clicks, you can explore customer journeys, see which channels are working, and make smarter decisions without ever touching a line of code.
No more bottlenecks. No more chasing IT support. Just instant insights, right when you need them.
What are no code analytics tools?
No code analytics tools are platforms that let you collect and analyze data without writing a single line of code. No SQL. No Python. No waiting on a developer.
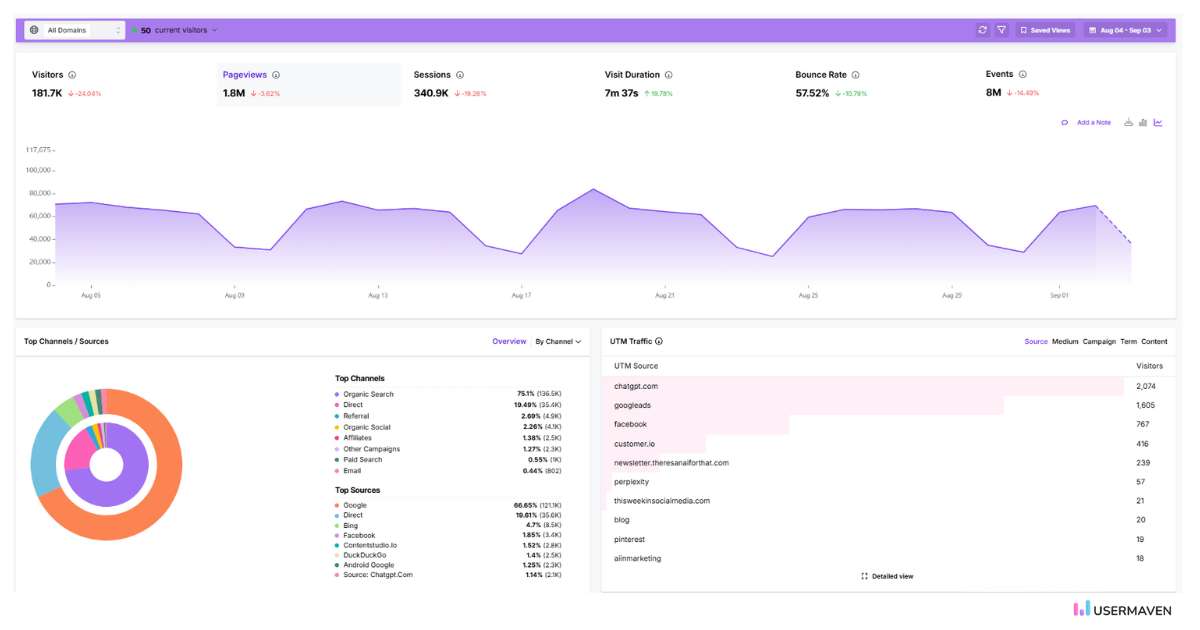
They’re built for people who don’t have a technical background. Marketers, managers, and decision-makers can all use them without relying on analysts or developers to translate the numbers.
What makes them so powerful is their simplicity. Dashboards are user-friendly, often with drag-and-drop features and built-in automation. That means anyone in your company can create reports, track performance, and spot trends on their own.
Most of these tools also play nicely with the systems you’re already using. Whether it’s your CRM, e-commerce platform, or marketing stack, integrations make it easy to keep everything connected. And since they track events in real time, you don’t have to wait days for answers; you can just see what’s happening as it happens.
They also break down silos inside organizations. Teams across departments can share reports, align on the same insights, and make faster decisions without technical barriers slowing things down.
But the biggest shift isn’t in the technology; it’s in the access. No code analytics puts data directly into the hands of the people who need it most. Marketers, sales teams, and leadership can all explore insights without waiting for someone else to pull the numbers.
Benefits of no code analytics tools
The most significant advantage of no code analytics is accessibility. Data is no longer locked away with IT or analysts; it’s available to anyone in the company who needs it. Marketers, managers, and sales teams can all explore insights on their own.
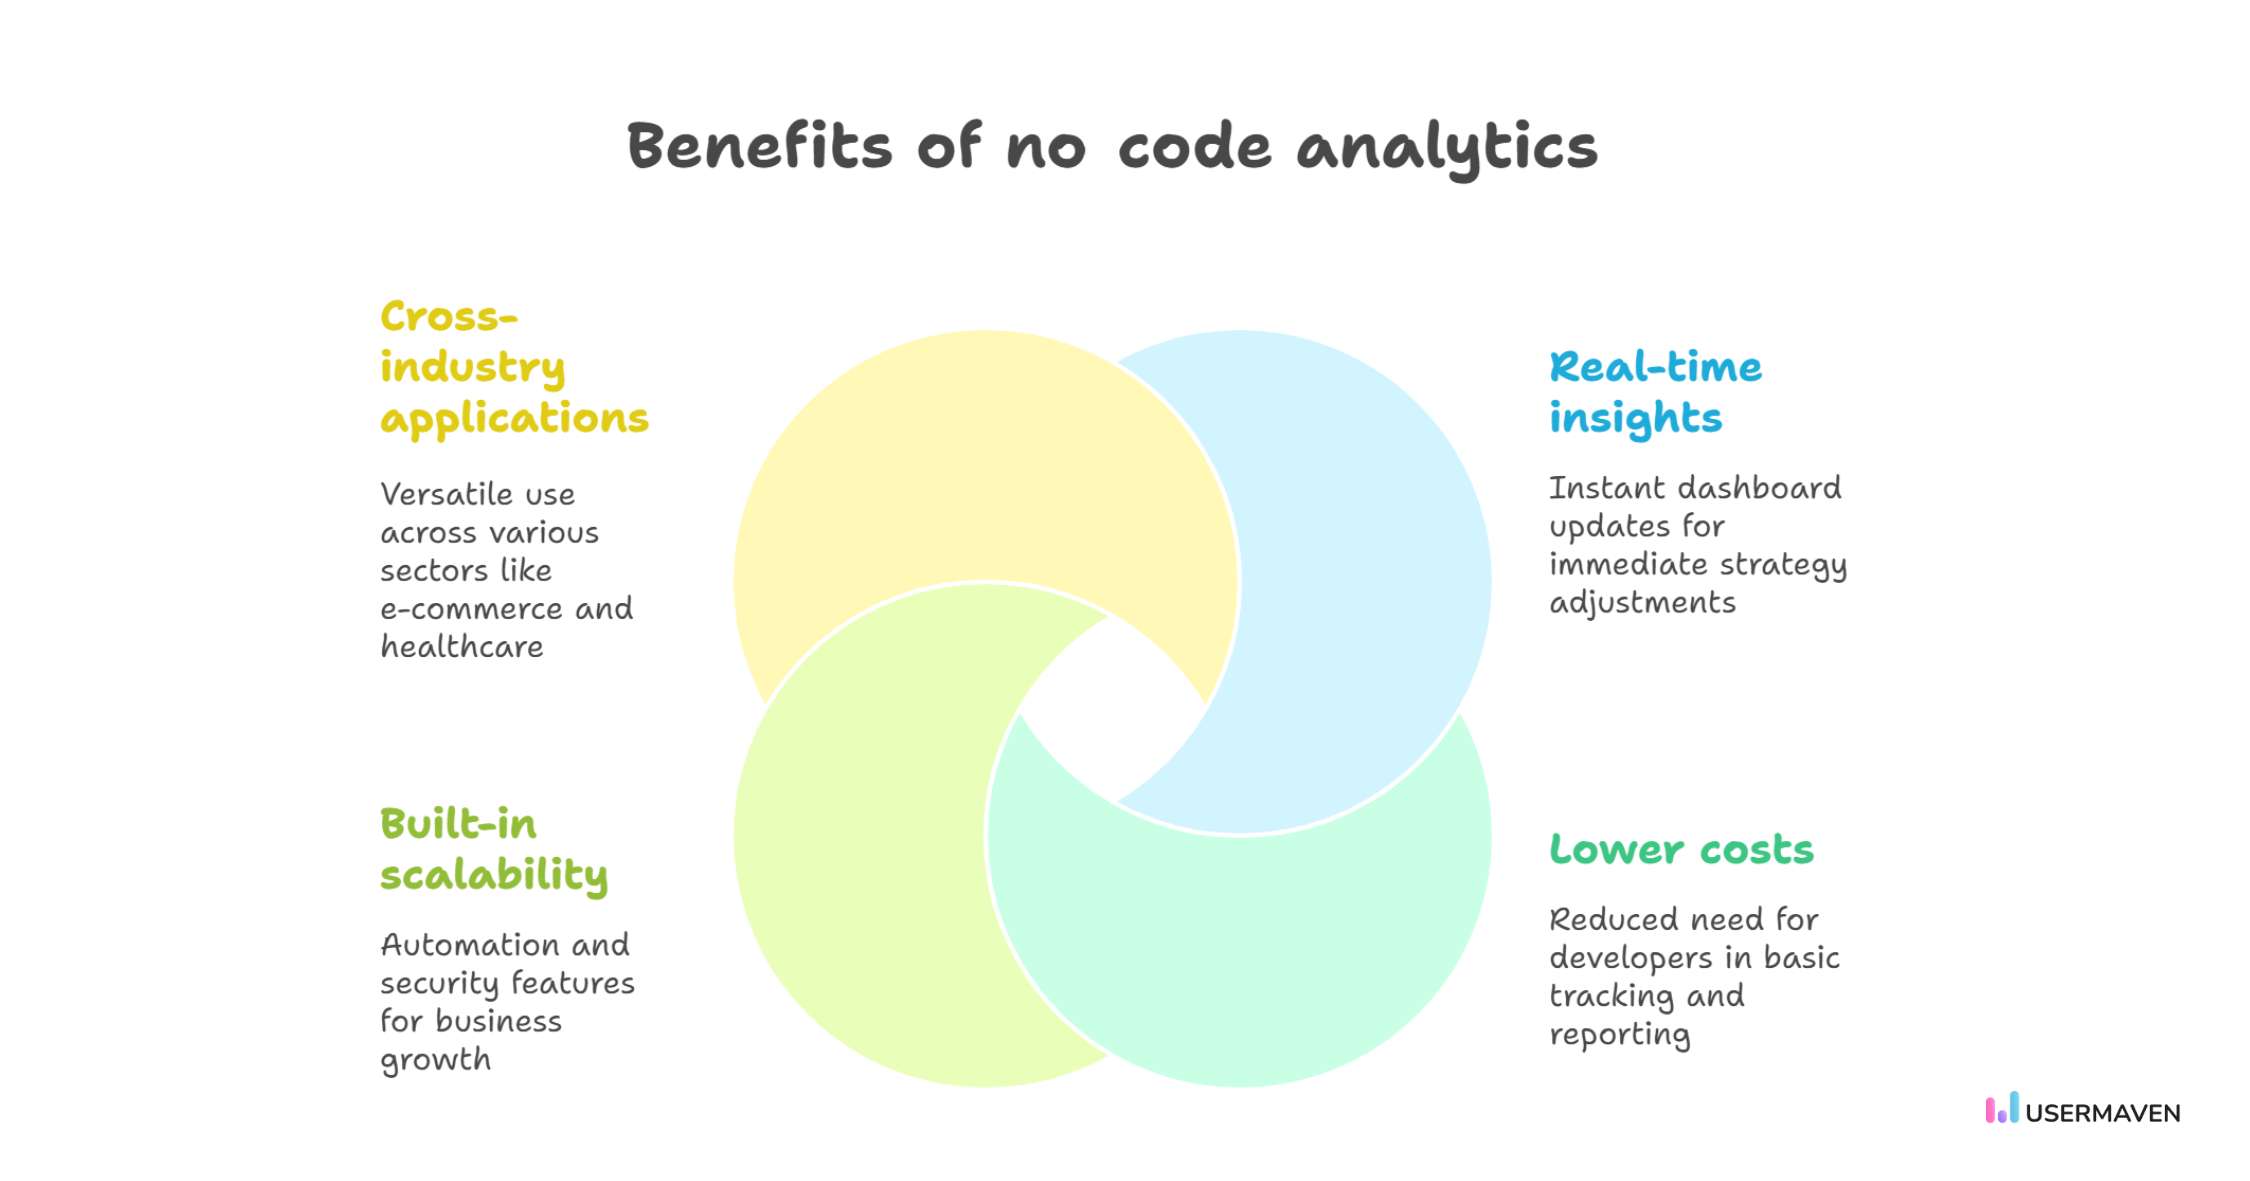
Here’s how no code analytics makes a difference:
- Real-time insights: Dashboards update instantly, so you can spot what’s happening right now and adjust your strategy without waiting on reports.
- Lower costs: No need to hire developers for basic tracking or reporting. The tools are designed to work right out of the box.
- Built-in scalability: With automation and security features, no code analytics grows with your business while keeping data safe.
- Cross-industry applications:
- E-commerce teams can track abandoned carts.
- SaaS companies can monitor churn and retention.
- Healthcare providers can simplify reporting for patients.
- Marketers can measure campaigns across multiple channels.
For marketers, the value goes even deeper. No code analytics doesn’t just measure campaign performance; it ties into broader digital strategies like SEO and building high-quality backlinks, helping you see which efforts actually boost visibility and authority.
And the results back it up: according to Demand Sage, 78% of marketers report positive returns from link-building. With analytics making those results easier to track, proving ROI becomes far simpler.
Types of no code analytics tools
No code analytics isn’t one-size-fits-all. The tools fall into different categories depending on whether you want to improve your product, measure campaigns, make executive decisions, or optimize customer experiences.
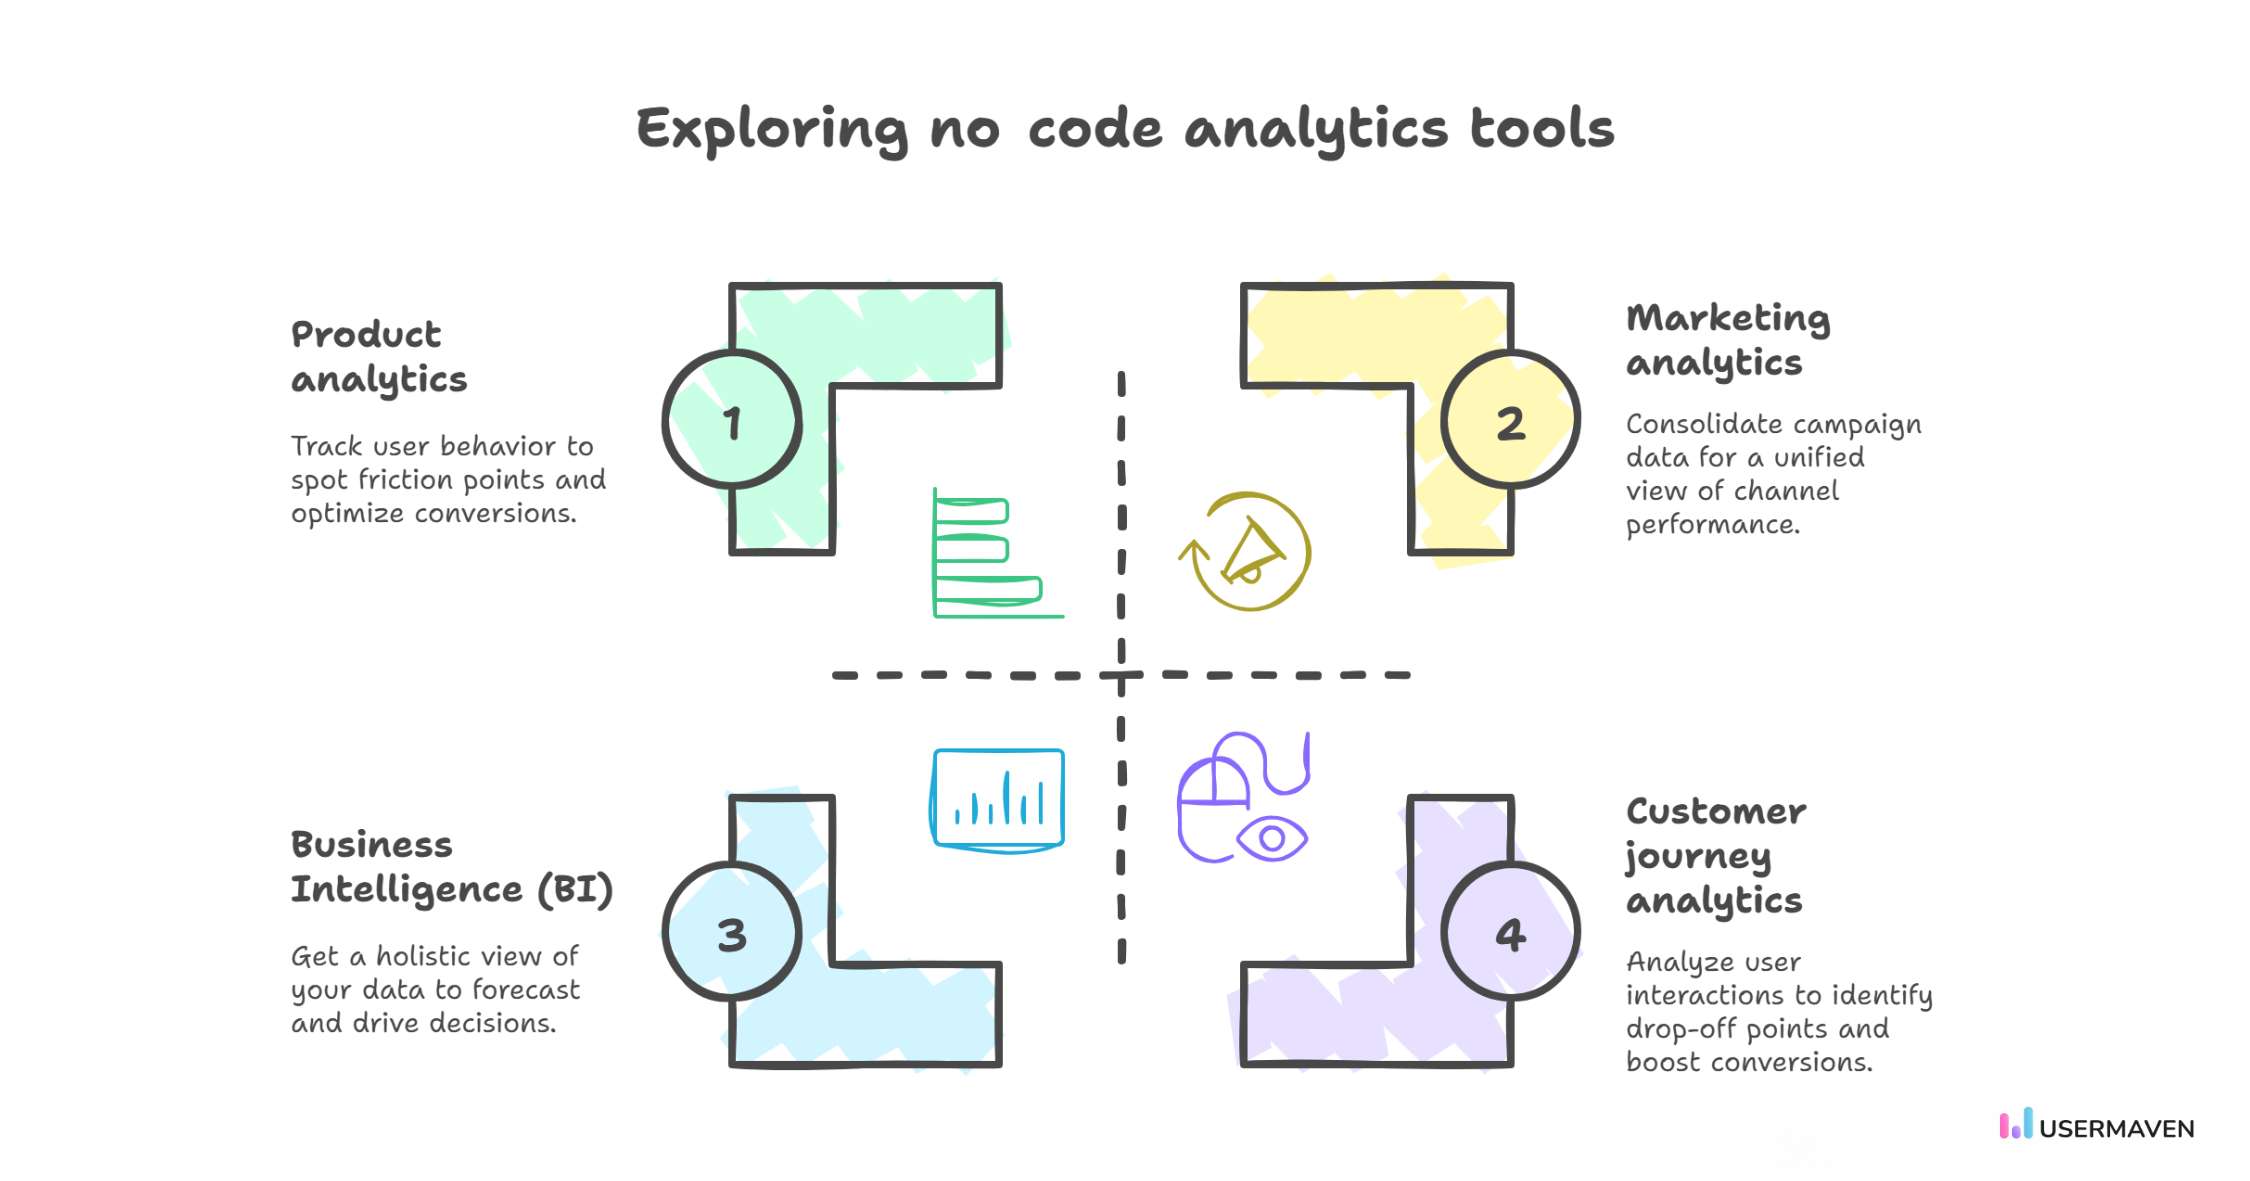
Here’s a closer look at the main types and how they deliver value in practice:
Product analytics tools
Think of product analytics as a microscope for your digital product. These tools let you dig into user behavior: where they click, what features they ignore, and at what point they decide to drop off. With features like funnel analysis and retention tracking, you can spot friction points and fix them before they cost you your users.
Examples to explore:
- Usermaven
- Mixpanel
- Heap
Best for: Product managers, UX teams, and growth teams who need fast answers to improve the user journey.
Marketing attribution and analytics tools
Marketing analytics platforms act as your campaign control center. Instead of logging into five different dashboards to check ad spend, email performance, and social reach, you get one consolidated view.
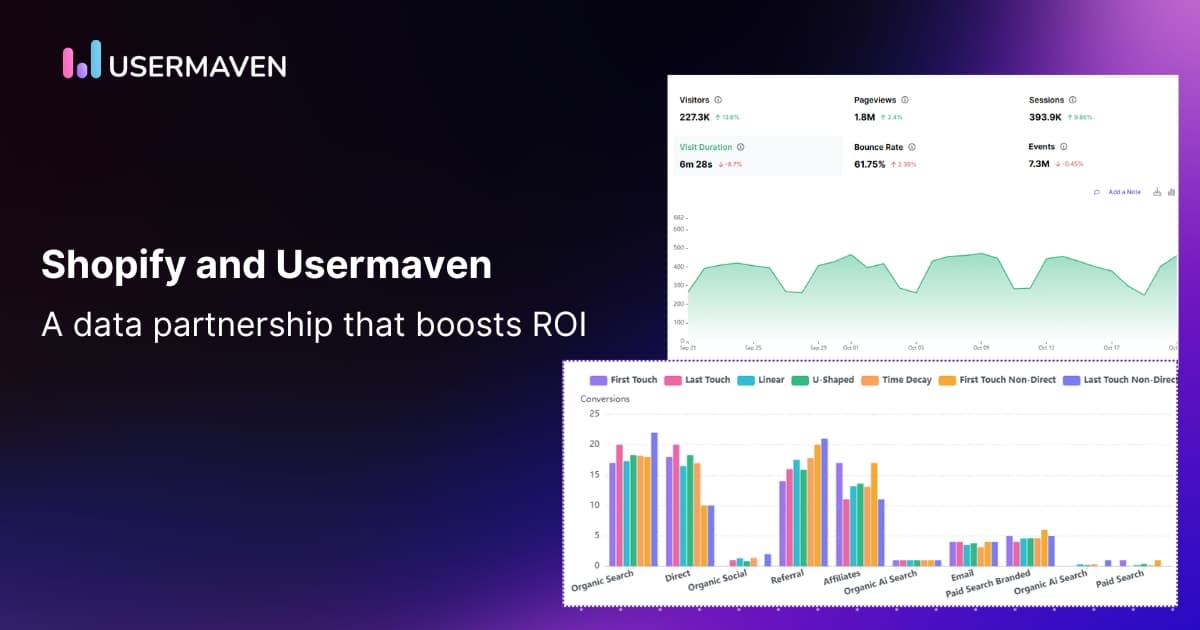
The real magic? Seeing how all those channels work together. As marketing attribution software, Usermaven helps teams connect campaign performance, channel activity, ROI, and revenue impact without relying on code-heavy reporting workflows.
Imagine comparing the ROI of your paid ads versus organic SEO in just a few clicks. Or spotting that email campaigns drive more revenue when paired with retargeting ads. These connections are complex to see when your data lives in silos.
Examples to explore:
- Usermaven
- HubSpot Marketing Hub
- Supermetrics
Best for: Marketing teams and agencies who need to prove ROI quickly and optimize budgets.
Business Intelligence (BI) platforms
BI tools take a bird’s-eye view. They’re not about single campaigns or features, but the entire organization. From sales pipelines to financial performance, BI platforms connect different data sources into visual dashboards that executives can actually act on.
They also come with predictive analytics, helping leaders answer not just “what happened” but “what’s likely to happen next.” That forward-looking view is what makes BI so valuable at the C-suite level.
Examples to explore:
- Tableau
- Microsoft Power BI
- Looker (Google Cloud)
Best for: Executives, operations, and finance teams who need company-wide insights at scale.
Customer journey analytics tools
Customer journey analytics goes beyond traffic numbers to show how people interact with your product or site. Heatmaps, user journeys, and conversion funnels reveal where users drop off, what catches their attention, and how they move from first click to conversion.
This insight is crucial for UX and marketing teams. For example, if you notice users dropping off at the shipping step during the checkout process, you gain a clear understanding of where to focus your improvements. By tracking the complete user journey, you can identify exactly which touchpoints need attention to keep customers moving toward conversion.
Examples to explore:
- Usermaven
- Hotjar
- Crazy Egg
Best for: UX designers, CRO specialists, and digital teams focused on improving conversions.
When choosing an analytics solution, it’s important to consider whether you want to build your own or buy a pre-built platform. If you’re unsure which option fits your needs, check out our blog on build vs. buy analytics.
Conclusion
Data shouldn’t feel like a roadblock. It should feel like a lever you can pull whenever you need clarity. That’s the fundamental shift no code analytics brings: turning complex reporting into something fast, simple, and within reach for everyone.
The real win isn’t just saving time. It’s building a culture where teams can move with confidence, experiment more freely, and make smarter decisions without waiting on someone else to “unlock” the data for them.
That’s why Usermaven is becoming essential. It makes it easy to track the customer journey, understand which channels and touchpoints matter most, and see results in real time, without the technical barriers that used to hold teams back.
So, if you’re still relying on slow, outdated reporting systems, maybe it’s time to ask: what opportunities are you missing while you wait?
See Usermaven in action
Book a free demo and discover how powerful analytics can grow your business.
FAQs about no code analytics tools
1. Can no code analytics tools support multiple team members working on the same data?
Yes, these tools allow collaboration across departments by providing shared access to reports and insights, breaking down data silos.
2. What types of data can no code analytics tools track?
No code analytics tools can track a wide range of data, including user behavior, campaign performance, and customer journeys, in real time.
3. What makes no code analytics tools cost-effective compared to traditional analytics platforms?
No code tools eliminate the need for hiring specialized developers or analysts to manage data, making them more cost-effective. They’re ready to use out of the box and require minimal setup or technical resources.
4. Why should I consider switching to Usermaven for no code analytics?
Usermaven offers powerful features like customer journey tracking, real-time insights, and easy integration with existing systems, making it an ideal choice for teams looking to streamline their data analysis and decision-making.
Updated

Written by
Ryan Mitchell
Marketing Analytics Strategist
Ryan Mitchell is a marketing analytics strategist specializing in campaign measurement, customer journeys, and marketing performance. He writes about analytics, reporting, and data-driven marketing strategies, helping SaaS and B2B teams measure what matters across every stage of the customer journey.
All articles by Ryan →