A shopper spots your product on Instagram, clicks a Google ad a day later, opens an email, then buys by typing your URL. Meta, Google, and your email platform all claim that same order. Marketing attribution tools for ecommerce exist so those overlapping reports turn into one reliable story about what truly drove the sale.
When every channel seems profitable, budget decisions become guesswork and experiments feel risky. It gets harder to know which campaigns deserve more spend and which quietly burn cash.
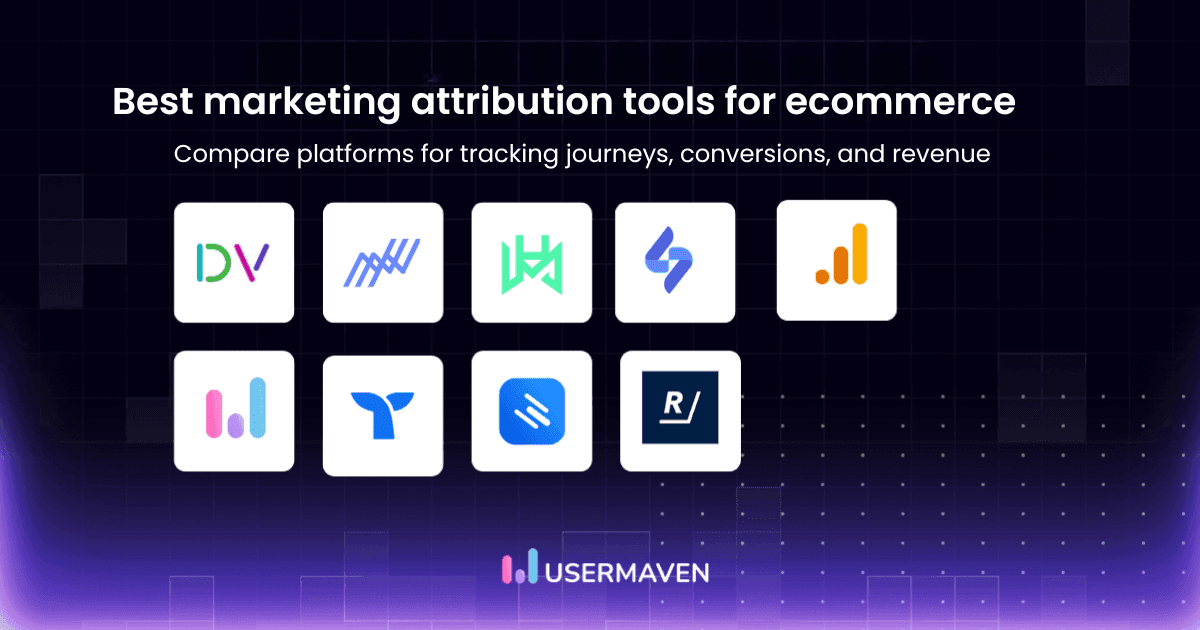
This guide compares nine leading tools across attribution depth, ecommerce integrations, product and revenue tracking, customer path visibility, setup effort, pricing, and which business types they fit best. By the end, you will know which stack matches your store.
Ready to replace channel bias with clear data before your next budget review? Keep reading.
If you want a quick refresher on concepts before looking at tools, start with ecommerce attribution. It explains how different models work and why platform numbers rarely match your payment processor. Then come back here to pick the right software.
Key takeaways
The best tool depends on store size, channel mix, and measurement maturity. A single marketer at a new Shopify store needs something simple. A scaled DTC brand with an in-house data team needs deeper models and exports.
Ecommerce-first tools often center on ad and order reporting, not full analytics. They can nail paid performance yet leave product behavior, funnels, and retention for other platforms. Decide whether you want a focused attribution layer or a more complete analytics stack.
Multi-touch attribution gives far more context than last-click reports. It shows how discovery, retargeting, and email work together instead of fighting for credit. That view helps protect top-of-funnel channels when budgets tighten.
Pricing ranges from free options like GA4 to custom enterprise contracts. Total cost depends on traffic volume, tracked events, and needed services. Always factor setup time and internal resources alongside the monthly fee.
What should an ecommerce attribution tool measure?

An ecommerce attribution platform should measure far more than which last click brought a purchase. A strong tool connects channels, onsite behavior, and order data into one view that both marketing and finance teams can trust. These measurement areas form a simple checklist.
Marketing channels
A solid tool connects paid search, paid social, organic search, email, affiliates, referrals, and direct visits in one model. It should pull spend from Google Ads, Meta, TikTok, and other networks, then line that up with traffic from SEO and partnerships.
Cross device identity matters so one customer does not look like three visitors. Without this, every platform still claims full credit.
Multiple touchpoints
Modern shoppers move through discovery, consideration, retargeting, and closing steps before buying, a journey well-documented in e-commerce user journey research. Your attribution software should show how many touches happen before an order and which patterns repeat for high value customers.
It also needs support for several marketing attribution models, not just last click. That way you can compare how views change when you favor first touch, last touch, or time decay.
Orders and revenue
Channel reports that stop at clicks miss the point for ecommerce teams. The tool should connect campaigns to order count, order value, new customer revenue, repeat purchases, and refunds.
Research on OTA distribution channels’ hotel impacts and broader ecommerce data find average online cart abandonment close to seventy percent, so seeing abandoned carts by channel is just as important as completed orders. Revenue figures also need to reconcile with your payment processor to avoid double counting.
Product performance
Not every product line drives the same margin or repeat behavior. Good attribution software shows which campaigns introduce, assist, and sell specific products or categories.
It should highlight when one ad group mostly sells low-margin items while another quietly brings high-value bundles. That connection between SKU-level data and channel spend guides smarter merchandising and promotion decisions.
Customer paths
Beyond single conversions, teams need to see the sequence of channels, pages, products, and events before someone buys. Strong tools visualize the full customer path so you can spot common routes and friction points.
Combining attribution with a proper user path map makes it easier to design better experiences. This also helps teams explain performance to leadership without drowning them in raw tables.
First-party data
With cookies fading and privacy laws tightening, first party and server side tracking now matter more than pixel based tracking alone. Your platform should collect data directly from your site and backend so ad blockers and browser limits do not wipe out half your conversions.
Server side events, conversion APIs, and consent aware tracking all support more accurate models. That foundation keeps reports reliable even as platforms change rules.
9 best marketing attribution tools for ecommerce
This section walks through each tool with a short overview, who it suits best, key ecommerce features, and pricing notes. The goal is to help you align these tools with your own use cases, not to crown a single winner for every store.
1. Usermaven – best for attribution and customer paths

Usermaven combines attribution, product analytics, and website analytics in one dashboard. It tracks users across channels and devices, then links them to carts and orders that accounts for time decay and channel sequencing. That view helps ecommerce teams trust revenue numbers when ad platforms disagree. In a documented ContentStudio case study, this setup lifted signups by 128 per cent and demo bookings by 242 per cent.
Best for
Usermaven suits ecommerce teams that want marketing attribution, website behavior, product insights, customer paths, and revenue reporting in a single platform.
Key ecommerce features
Multi touch attribution across paid search, paid social, email, and organic traffic. The attribution workspace supports several models, including first-click, last-click, linear, U-shaped, and time-decay. Teams can compare views before standardizing on one model for reporting.
Product and revenue analytics that tie campaigns to specific SKUs, categories, and cohorts. The product analytics area shows which products acquire new customers versus drive repeat purchases. That helps marketers promote profitable ranges instead of chasing vanity volume.
Maven AI and no code tracking for fast setup. The Maven AI assistant answers plain language questions like “which Facebook ad drives highest LTV” without manual querying. Automatic event tracking picks up key clicks and purchases so most stores see clean data within days.
Pricing
Usermaven offers a free trial so teams can validate tracking before committing. Growth plans start at 84 dollars per month, while Scale plans with higher attribution limits start at 199 dollars and enterprise options are available on request.
2. Triple Whale – best for Shopify and DTC reporting

Triple Whale focuses on Shopify and direct-to-consumer brands that want store and ad data in one place. It pulls in orders, ad spend, and creative performance so marketers can watch blended profit rather than channel metrics alone.
Best for
Triple Whale fits Shopify brands that want store performance, advertising, profitability, and creative reporting together in a central dashboard.
Key ecommerce features
Native Shopify order attribution that lines up orders with Meta, Google, and TikTok campaigns. This helps teams see which ads actually close sales rather than just generating clicks. It also separates first-time customers from returning buyers.
Profitability metrics that factor product costs, ad spend, and discounts. Marketers can quickly spot channels that bring in revenue but fail to deliver profit. Cohort views show how long it takes to break even on new customers.
Creative performance and agency-focused views. Teams and agencies can compare images, videos, and hooks across campaigns. Shared dashboards give clients and internal stakeholders the same reference point.
Pricing
Triple Whale uses plan-based and business-size-based pricing, with entry plans around several hundred dollars per month. Details often depend on store revenue or gross merchandise value.
For a deeper cost breakdown, the Usermaven blog’s review of Triple Whale pricing summarizes current tiers and common add ons.
3. Northbeam – best for high-spend DTC brands

Northbeam targets larger DTC and ecommerce advertisers that spend heavily across paid channels. Its pitch centers on first-party attribution, advanced media measurement, and marketing mix modelling.
Best for
Northbeam fits DTC brands that run big paid budgets and have a performance or analytics team in place.
Key ecommerce features
First-party attribution built around server-side tracking and durable identifiers. This helps recover conversions lost to browser changes and ad blockers. It also improves signal quality for ad platform optimization.
Multi touch measurement with path reports and creative analysis. Teams can see how often certain channels or creatives appear in strong converting paths. That supports clearer budget and testing plans.
Media mix modeling for higher-level planning. Northbeam estimates revenue impact for each channel at different spend levels. This suits brands planning large campaigns across Meta, Google, YouTube, and TV.
Pricing
Northbeam works on a demo-led, custom pricing model, with public entry points in the four-figure per month range. Costs scale with spend, data volume, and modeling scope.
If you are comparing options, the guide to a Northbeam alternative gives you clear differences in pricing and feature depth.
4. Cometly – best for paid-media attribution

Cometly focuses on tying ad spend from Meta, Google, and TikTok to revenue and CRM outcomes. It centers on performance marketers who want faster feedback loops on creative and audiences.
Best for
Cometly works well for performance marketing teams that need a clear path from ad clicks to CRM opportunities or purchases.
Key ecommerce features
Server-side tracking and conversion APIs for Meta, Google, and TikTok. This reduces lost conversions from browser limits and gives cleaner signals back to ad platforms. Better signals usually mean smarter automated bidding.
Path tracking that connects first ad click through to lead, purchase, or subscription. Teams can see which sequences of campaigns and remarketing sets repeat in their best converting paths. That helps refine account structure.
AI-assisted reporting to surface patterns and anomalies. Instead of digging through many charts, users get alerts when ROAS or CPA shifts beyond normal ranges. That supports quicker reactions during heavy testing periods.
Pricing
Cometly publishes entry-level pricing on its site with higher tiers gated behind demos. Plans generally scale based on ad spend and tracked revenue.
5. Rockerbox – best for enterprise measurement

Rockerbox serves brands that want an integrated view across digital, offline, and brand marketing. It blends user-level attribution with marketing mix modelling and incrementality testing.
Best for
Rockerbox suits large omnichannel brands that need multi-touch attribution, MMM, and structured testing rather than only ad platform reporting.
Key ecommerce features
Multi touch attribution that covers paid, organic, affiliate, and direct channels. Teams can compare several models and slice results by product or audience. Path reports help explain why certain campaigns look strong across models.
Marketing mix modeling and incrementality testing for strategic decisions. Rockerbox estimates channel impact at different spend levels and supports geo holdout experiments. This helps validate which channels drive incremental revenue.
Offline channel measurement and warehouse integrations. Brands can pull in TV, direct mail, or in store data alongside digital channels. Connections to Snowflake or BigQuery support deeper custom analysis.
Pricing
Rockerbox pricing is fully custom and shaped by measurement scope, data volume, and needed services. Many brands also pay for managed measurement support on top of software.
For more detail, Usermaven’s breakdown of Rockerbox pricing explains common contract structures. The comparison page on a Rockerbox alternative outlines how all-in-one attribution tools differ from Rockerbox’s enterprise focus.
6. Hyros – best for high-ticket and direct-response brands

Hyros specialises in tracking paid ads, calls, and leads for direct response and high-ticket offers. It strongly appeals to advertisers who run aggressive funnels across multiple ad networks.
Best for
Hyros fits direct response businesses and higher-ticket ecommerce brands that lean heavily on paid traffic and sales calls.
Key ecommerce features
Ad attribution that spans Meta, Google, YouTube, and other networks. Hyros tags users across many funnels and landing pages. This helps identify which campaigns actually close sales.
Call tracking and lead-to-purchase matching. Brands that rely on phone consults or sales reps can follow revenue back to the original ad. That closes a common blind spot for high-ticket funnels.
Server-side measurement and optimization signals pushed back to ad platforms. Cleaner signals give automated bidding more accurate targets. That can improve ROAS for scaled accounts.
Pricing
Hyros uses revenue-based tiers that start around the mid-three figures to low four figures per month. Larger advertisers move into custom pricing as tracked revenue grows.
To see how those tiers look in practice, check Usermaven’s review of Hyros pricing. The Hyros vs Hyros alternative comparison explains when a broader analytics tool can replace a pure ad tracker.
7. SegmentStream – best for algorithmic attribution

SegmentStream provides algorithmic attribution and conversion modeling for ecommerce and multichannel brands. It is built to work with limited cookies and partial conversion data.
Best for
SegmentStream suits data-driven ecommerce teams that want modelled conversions across several channels.
Key ecommerce features
- Algorithmic attribution that uses conversion modeling instead of relying only on last click data. This helps brands keep measuring channel performance as tracking restrictions increase.
Integration with major ad platforms and analytics tools. SegmentStream can read existing analytics and ad data, then apply its models to estimate revenue impact for each channel and campaign.
Predictive insights on conversion probability and expected value. Teams can use these scores to adjust targeting or budgets toward audiences that are more likely to convert.
Pricing
SegmentStream typically works on a demo-led, custom pricing model. Costs vary based on traffic volume, data sources, and modeling scope.
8. Ruler Analytics – best for calls and offline revenue

Ruler Analytics targets businesses that generate leads and sales through calls, forms, and offline steps, as well as through online carts. It fits some ecommerce setups, especially where sales teams play a role.
Best for
Ruler Analytics works well for service businesses and ecommerce teams that drive revenue through calls, forms, sales reps, or offline conversions.
Key ecommerce features
Form and call tracking that connects leads back to campaigns. This helps teams see which ads and keywords drive real conversations. It also highlights wasted spend on low-quality leads.
CRM integrations that sync leads and opportunities with platforms like HubSpot and Salesforce. Closed revenue then flows back into Ruler’s attribution reports. Offline sales can be added to complete the picture.
Multi touch models and, on higher plans, marketing mix modeling. This suits organizations that want both path level and aggregate measurement. It goes beyond simple first or last click views.
Pricing
Ruler Analytics uses traffic-based plans that start in the low hundreds of dollars per month. Pricing rises with session volume and feature sets.
Usermaven’s article on Ruler Analytics pricing digs into plan tiers and limits. The Ruler Analytics alternative page helps teams decide when a product-led analytics platform makes more sense.
9. Google Analytics 4 – best free starting point

Google Analytics 4 sits closer to a general analytics platform than a dedicated attribution tool. Still, its free price and standard reports make it a common baseline for ecommerce stores.
Best for
GA4 suits smaller stores that need a free starting point for ecommerce events and channel reporting.
Key ecommerce features
Ecommerce event tracking with revenue, item, and funnel data. Stores can track product views, add to carts, checkouts, and purchases. That supports basic funnel optimization.
Channel acquisition reporting and model comparison. GA4 lets teams compare last click, first click, and data driven attribution within the interface. According to Google Analytics Help, data driven attribution uses machine learning to distribute credit across many touchpoints.
Audience reporting and Google Ads integration. Marketers can build remarketing audiences based on behavior and send them directly to Google Ads. That keeps ad and analytics data in sync.
Pricing
Standard GA4 is free for most use cases. Google Analytics 4 360, its enterprise version, adds higher limits and dedicated support on custom contracts.
Many teams follow Google’s own ecommerce measurement documentation when setting up GA4. The Google Analytics Help center provides templates for recommended events, funnels, and attribution settings. You can explore alternatives to Google Analytics as well to see the difference from an advanced attribution tool.
The easiest GA4 alternative for marketers and product teams
Quick comparison of ecommerce attribution tools
Before detailed profiles, this table gives a fast snapshot of how each tool positions itself for ecommerce teams. Use it to narrow your reading list to the few options that match your store size and channel mix.
| Tool | Category | Best for | Key ecommerce strengths | Pricing |
|---|---|---|---|---|
| Usermaven | Attribution + analytics | Growing ecommerce teams | 7 models attribution, customer paths, product behavior, revenue, AI | Public |
| Triple Whale | Ecommerce measurement | Shopify and DTC brands | Order attribution, profitability, creative reporting | Public or custom |
| Northbeam | Attribution + MMM | High spend DTC brands | First-party attribution, media measurement, MMM | Demo or custom |
| Cometly | Paid media attribution | Performance marketing teams | Server-side tracking, ad attribution, CRM revenue | Public or demo |
| Rockerbox | Enterprise measurement | Omnichannel brands | MTA, MMM, incrementality, offline channels | Custom |
| Hyros | Paid ad attribution | High ticket and direct response brands | Ad tracking, call attribution, revenue matching | Public or custom |
| SegmentStream | Attribution + analytics | Data-driven ecommerce teams | Cookieless attribution, algorithmic modeling, predictive insights | Demo or custom |
| Ruler Analytics | Lead and revenue attribution | Call-heavy and service businesses | Forms, calls, CRM, offline revenue | Public |
| Google Analytics 4 | Web analytics | Free basic attribution | Ecommerce events, channel reporting, model comparison | Free |
How to choose an ecommerce attribution tool

Choosing among marketing attribution tools for ecommerce starts with your own stack, not the market map. The right choice aligns cleanly with your store platform, channels, and internal skills. These steps help narrow the field.
Start with the store platform
Begin by checking how well each tool connects with Shopify, WooCommerce, Magento, custom storefronts, and subscription systems. Native integrations usually mean cleaner order data and fewer tracking gaps.
Also look at payment connections to Stripe, PayPal, or your processor. Strong ecommerce integrations reduce setup work and later maintenance.
Review the channel mix
A brand driven mostly by Meta and TikTok ads needs different capabilities from one focused on search, affiliate marketing, email, and retail. List the channels that drive most revenue today and those you plan to test.
Then confirm that your shortlisted tools support tracking and spend imports for each. This avoids surprise blind spots after onboarding.
Decide how much attribution depth is required
Some teams only need reliable last click numbers that match their bank account. Others want multi touch attribution, marketing mix modeling, and incrementality tests.
Clarify which questions you need answered this year — strategies to increase direct bookings and similar channel-specific research suggest that aligning measurement depth to your actual channel mix leads to better budget decisions. If multi touch and MMM both matter, make sure the platform supports both without a separate contract or workflow.
Check product and revenue reporting
Look closely at how each tool handles products, margins, and lifecycle value. Strong options can tie campaigns to specific items, categories, order values, refunds, and repeat revenue.
They also help separate the cost of acquiring new buyers from the cost of retaining them. This matters when channels bring low first order ROAS but strong lifetime value.
Consider implementation effort
Compare self serve, no code tracking with sales led onboarding and heavier deployment. A tool that looks perfect but needs months of engineering work might lag behind a simpler platform you can launch this week.
Check whether event tracking is automatic or manual and who needs access to tag managers or codebases.
Compare total cost
Total cost includes more than the headline subscription. Ask about traffic or event limits, overage fees, support tiers, and contract length.
Some platforms jump several tiers once you pass modest traffic thresholds. The Usermaven guide to marketing attribution software cost breaks down common pricing models in more detail.
How we evaluated the tools
All nine tools were evaluated against the same ecommerce attribution criteria, so the comparison stays focused on real buying decisions rather than feature count.
The goal is to help teams see which platforms fit their current measurement needs, which ones may be too complex, and which could feel limiting as channels, orders, and revenue grow.
We looked at ecommerce focus, attribution model flexibility, channel coverage, product and order data, customer path visibility, integrations, setup effort, AI capabilities, pricing transparency, and overall business fit.
This evaluation also reflects ideas from Shopify’s guide to multi-touch attribution, which explains how ecommerce brands can compare touchpoints across the customer journey instead of relying on a single final interaction.
Common mistakes when comparing ecommerce attribution tools

Buying attribution software can feel confusing, especially when each vendor claims to fix the same problems. These common mistakes often lead to regret or stalled implementations.
Choosing based only on dashboards
Pretty dashboards help people skim numbers, but they do not guarantee accurate tracking. Under the surface, data collection methods and modeling choices matter far more.
Always ask vendors to show how a reported number traces back to underlying events, users, and costs.
Treating every tool as equivalent
GA4, Triple Whale, Rockerbox, and Usermaven overlap but solve different jobs. Some focus on ad accounts, others on full paths, and others on high level modeling.
Treating them as interchangeable often ends with gaps in either detail or strategy. Match tool type to your current challenges.
Relying only on last-click
Last click attribution often undervalues discovery channels like TikTok, YouTube, or top funnel influencer marketing. Those channels might rarely win the final click but still seed most future buyers.
Comparing last click against at least one multi touch view protects those early touches from knee jerk budget cuts.
Ignoring repeat revenue
Looking only at first-order ROAS hides channels that bring in loyal, high-value customers. Subscription, replenishment, and cross sell revenue usually matter more than one sale.
Any serious attribution setup should show how channels differ on lifetime value, not just initial purchases.
Buying enterprise complexity too early
Some platforms combine multi touch attribution, MMM, incrementality tests, and managed consulting. That level of detail suits a small set of brands with dedicated analytics resources.
For many ecommerce teams, starting with a simpler, self serve tool is faster and more sustainable. A dedicated comparison of affordable attribution tools can help identify lower-cost options that still cover multi-touch models, revenue tracking, and ecommerce integrations.
To see how often ad platform reports differ from independent attribution, the ad platform discrepancies walk you through real-world examples and their impact on budgets.
Final verdict
The best marketing attribution tools for ecommerce which shine in different situations: Usermaven.
Usermaven stands out for teams that want attribution plus rich customer paths and behavior data in one place. Triple Whale serves Shopify first brands that live inside store and ad dashboards. Northbeam and Rockerbox cater to larger programs that mix digital, offline, and advanced modeling.
Cometly and Hyros lean into paid media performance and fast ROAS feedback. SegmentStream focuses on algorithmic, cookieless attribution. Ruler Analytics favors call heavy and offline influenced revenue paths. GA4 remains a practical free baseline for events and simple model comparison.
Conclusion
If you need a broader self-serve platform, Usermaven gives growing ecommerce teams attribution, Shopify integration, website analytics, product analytics, customer journeys, and Maven AI without enterprise overhead. It helps you connect campaigns, customer behavior, purchases, and revenue in one place instead of relying only on platform-reported ROAS.
High-spend DTC brands and omnichannel retailers may still evaluate Northbeam or Rockerbox for MMM and incrementality testing. But for teams that want clear ecommerce attribution, faster setup, and revenue visibility without a heavy measurement stack, Usermaven is the stronger fit.
Ready to see Usermaven in action? Explore the platform or book a demo for a closer look.
See what's working. Fix what's not. Grow faster.
FAQs
1. What is an ecommerce attribution tool?
An ecommerce attribution tool is software that connects marketing touchpoints to online orders and revenue. It tracks channels, campaigns, and onsite behavior, then assigns credit for each purchase so teams see which efforts drive real sales.
2. What is the best marketing attribution tool for ecommerce?
Usermaven fits teams wanting attribution plus customer paths, while Triple Whale, Northbeam, Rockerbox, and others serve different sizes and channel mixes. The best choice matches your platform, budget, and measurement needs.
3. Which attribution tool is best for Shopify?
For Shopify-focused brands, Triple Whale works because it centres on Shopify order data, ad spend, and profitability. Usermaven also supports Shopify stores that want broader analytics, product insights, and multi-touch attribution in one place.
4. What is the difference between ecommerce analytics and attribution?
Ecommerce analytics tracks general behavior like page views, funnels, and revenue totals. Attribution focuses on how specific marketing touchpoints, channels, and campaigns influence each conversion. In practice, attribution answers “where did this sale come from” while analytics answers “what happened on the site.”
5. Do ecommerce brands need multi-touch attribution?
Most growing ecommerce brands benefit from multi touch attribution. It shows how discovery, remarketing, and email work together rather than crediting only the last click. That context helps protect upper-funnel channels that seed future demand but rarely close the sale alone.
6. Is Google Analytics 4 an attribution tool?
Google Analytics 4 includes attribution reports, but it is mainly a web and app analytics platform. GA4’s model comparison and are helpful starting points, yet many brands add a dedicated attribution tool for deeper revenue and product views.
Updated

Written by
Junaid Ahmed
Content Writer & Digital Marketer
Junaid Ahmed is a content and copywriter with 3+ years of experience creating research-driven content across SaaS, B2B, ecommerce, and digital marketing. He specializes in turning complex topics into clear, practical content that helps marketers better understand their challenges, evaluate solutions, and make informed decisions. His work spans educational content, industry insights, and actionable marketing guides.
All articles by Junaid →