What if the reason your ads “don’t work” isn’t the ads, it’s your dashboard?
Most ecommerce brands live inside the Shopify analytics dashboard, checking sales, orders, and traffic. It feels like the control room of your business, until you try to answer tougher questions like:
Which marketing channels actually drive profit, not just clicks?
What role does content or email play before a purchase?
Are my ad campaigns really paying off, or am I double-counting conversions?
That’s when the limits start to show.
Shopify gives you the basics. Usermavengives you the bigger picture, connecting marketing, website, and store data for clear customer journey insights.
Here, we’ll compare Shopify vs. Usermaven to see which dashboard helps ecommerce brands make smarter, data-driven decisions.
A quick look at Shopify analytics and Usermaven
Before comparing features, it helps to understand what each tool is designed to do.
Shopify analytics gives you the essentials: sales, orders, customers, and traffic. It’s built for quick store checks and performance snapshots right inside your dashboard. Perfect for daily visibility and operational reporting.
Usermaven, on the other hand, is an advanced ecommerce analytics tool. It goes beyond surface metrics to show how your marketing, content, and customer behavior connect to actual revenue. With features like a custom dashboard for conversion tracking, attribution, and funnel analysis, it gives ecommerce brands a clear view of what truly drives growth.
When Shopify analytics is enough and when it’s not
If your weekly questions look like this:
What were sales yesterday, and which products sold?
Which discount code performed best?
How many first-time vs returning customers did we get?
…Shopify’s native dashboard is fine.
If your weekly questions look like this:
Which marketing channels and campaigns actually drive profit, not just clicks?
How do multi-touch journeys look before someone purchases?
Which steps in the checkout funnel leak the most by device and source?
What is our cohort payback window and LTV by acquisition source?
Which content and ads assist conversions, not only last-click?
…you’ve outgrown Shopify’s default reports, and you need Usermaven.
Shopify Analytics vs. Usermaven: Side-by-side comparison
Here’s a look at how Shopify analytics and the Usermaven dashboard handle ecommerce tracking, attribution, and reporting.
Decision area
Shopify analytics dashboard
Usermaven dashboard
Sales & orders
Strong. Fast access to revenue, orders, products.
Strong. Mirrors key sales metrics while tying them to channels and journeys.
Marketing source accuracy
Limited. Often last-click or blended; assisted views are shallow.
Track ad creative, landing pages, and on-site content that assist conversions.
Shopify ROI tracking
Simple ROAS approximations.
ROAS/ROI tied to journeys, attribution models, and cohort payback.
Data trust & identity
Session-based views; identity stitching is basic.
Strong identity stitching. Shopify data tracking aligns with web events for clearer user-level truth.
Exports & reporting
CSV and standard reports.
Custom dashboards, scheduled reports, team workspaces, and export options.
Setup & effort
None. Built-in.
Light. Connect store, tags, and UTMs; guided onboarding.
Where Shopify analytics shines
Shopify deserves credit. For store operators, you get:
Sales snapshots: revenue, orders, AOV, top products.
Basic customer splits: new vs. returning, top locations.
Marketing overview: a simple “Marketing” section with source-level summaries.
Inventory and discount tracking: valuable for merchandising teams.
If your brand is small, channels are few, or you’re testing product-market fit, the built-in ecommerce dashboard keeps you moving without extra tools.
Shopify analytics limitations (and why they matter)
It is great for quick snapshots, but it starts to show cracks when you need deeper answers about where your growth really comes from.
Attribution is shallow You’ll often see a last-click skew. Upper-funnel content and discovery channels get underreported. That leads to underfunding what actually drives assisted conversions. Impact: You cut the top-of-funnel too early, and slow growth.
Journeys are hard to see Multi-touch journeys, TikTok view → Google search → email click → purchase, are not clear. Impact: Budget decisions become guesswork because you can’t see assists.
Funnels have limited segmentation You can view a checkout funnel, but segmenting by marketing channels, campaigns, or creative is hard. Impact: You can’t tell whether Meta drives cart adds while Google secures checkout.
Cohorts and LTV are thin You get basic customer counts, but LTV by channel and cohort payback are limited. You can’t answer “When do we break even on this campaign?”
Blended view hides waste A nice single number can mask channel inefficiency. Impact: You keep spending on a channel with great clicks but poor revenue attribution.
These aren’t flaws in Shopify; they’re simply the trade-offs of a dashboard built for quick store checks, not deep, data-driven ecommerce insights.
How Usermaven fills the gaps
Shopify shows what happened, Usermaven explains why it happened. Here’s how it fills each gap that Shopify analytics leaves open:
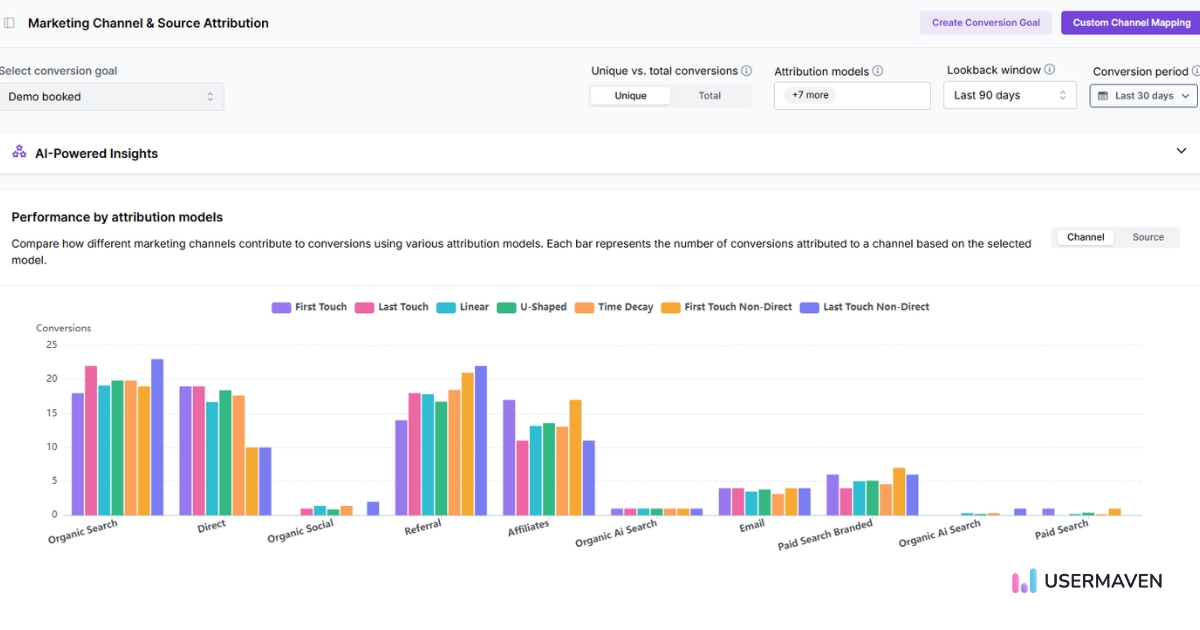
Multi-touch attribution built for Shopify
For ecommerce teams, Usermaven is revenue attribution software that connects ads, content, email, search, and store revenue across the full customer journey, not just the last click.
You can:
See first-touch, last-touch, and data-driven models side by side.
Attribute revenue to content, ads, email, and search assists.
Identify under-credited campaigns that quietly drive conversions.
Manage multi-touch attribution for Shopify without messy spreadsheets.
Result: Your ad budget flows to the right channels. You defend top-of-funnel spend with real data, not guesses.
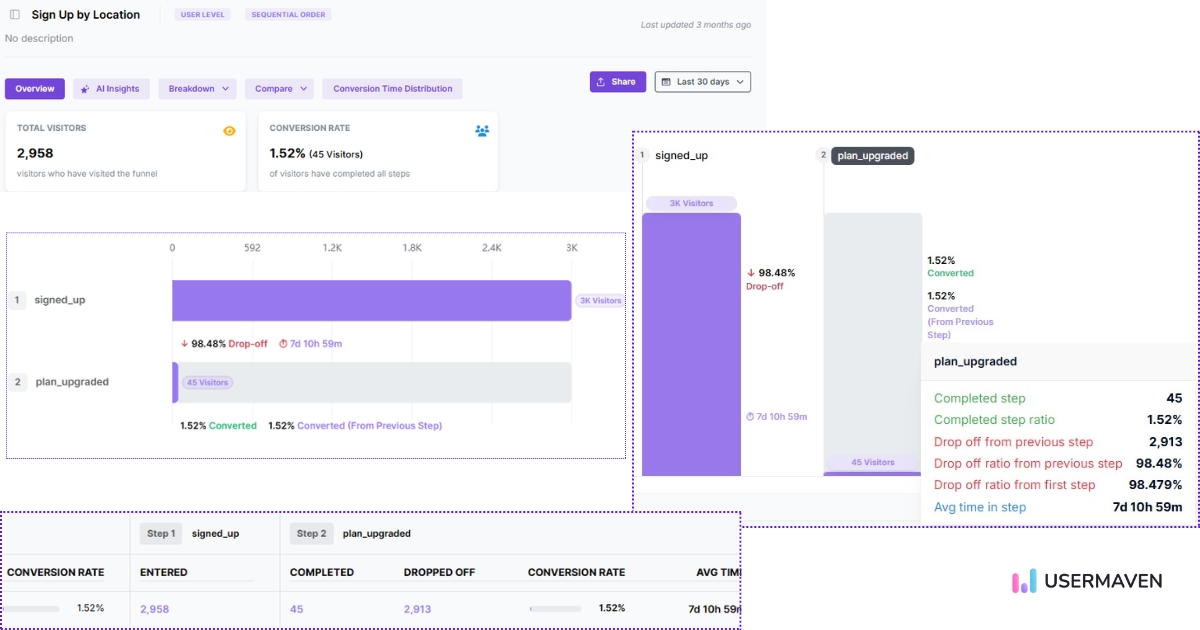
Funnels you can actually act on
With Usermaven’s funnel builder, you can map the entire buying path from landing page to purchase, then segment it by campaign, keyword, device, or geography. This helps you pinpoint where traffic drops, test checkout experiences, and connect every fix directly to key ecommerce KPIs.
Result: You fix the leaks that matter most and improve conversions backed by data.
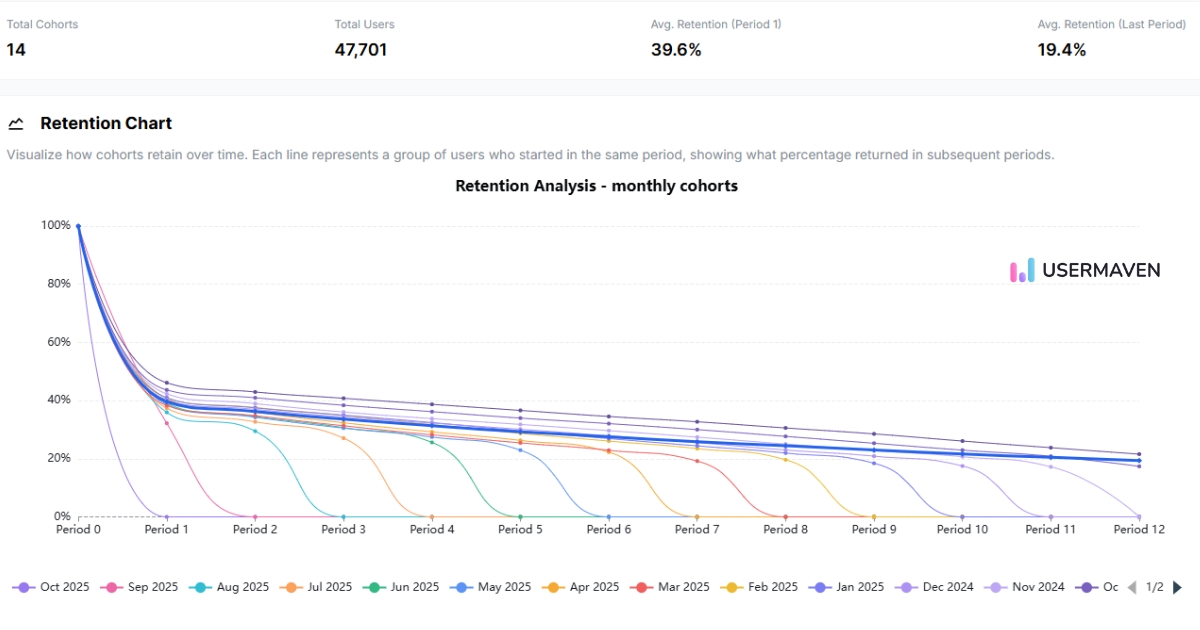
Cohorts and LTV by source
Usermaven helps you understand long-term performance, not just daily sales.
You can:
Track cohorts by acquisition channel or campaign.
Measure repeat purchase rates and time-to-second order.
Monitor payback windows and profitability timelines.
Tie Shopify ROI tracking to customer lifetime value.
Result: Smarter bidding, better promo planning, and confident scaling backed by real numbers.
Customer journey analytics you can show in a slide
Usermaven turns complex customer paths into clear visual stories. It shows full journeys from first touch to purchase, highlights assist touchpoints, and compares high-LTV versus one-time buyers.
Result: Shareable visuals that make sense to everyone, from marketers to leadership.
A cleaner source of data
Usermaven keeps your data consistent and reliable across every tool.
It does this through:
Identity stitching that connects anonymous visits to known customers.
UTM hygiene and event governance built into your workflow.
Alignment between Shopify data tracking and on-site behavior.
Result: Fewer reporting mismatches, clearer insights, and full confidence in every number.
Website analytics tool for modern marketers & agencies
*No credit card required
Real scenarios: where the difference shows up
Numbers tell part of the story, but real results show how these differences play out in day-to-day ecommerce decisions.
1) Ad budget reallocation
Problem: Meta looks weak in Shopify’s last-click view. Search looks strong. What Shopify shows: Search “wins.” What Usermaven reveals: Meta assists 40% of converting sessions, starting journeys that close later via branded search or email. Decision: Maintain Meta for prospecting. Increase branded search caps modestly. Add email journeys to capture mid-funnel.
2) Creative testing beyond CPC
Problem: Your creative team keeps asking, “which video actually drives revenue?” What Shopify shows: Clicks and sessions look similar. What Usermaven shows: Creative A spikes add-to-cart but stalls at checkout; Creative B drives fewer clicks but converts at higher AOV. Decision: Keep A for traffic at the top-funnel. Scale B for purchase campaigns. Adjust landing page for A’s audience to fix checkout drop-off.
3) Lifecycle marketing and payback
Problem: You can’t tell when email or SMS drives payback on Meta-acquired cohorts. What Shopify shows: Email revenue, but not cohort payback by source. What Usermaven shows: Meta-acquired cohorts hit payback in 28 days when email triggers ship within 48 hours of first purchase. Decision: Lock in post-purchase flows and bid to a 30-day payback target.
Measuring depth and usability
Features and dashboards are only part of the story. What really matters is how deep the data goes, how accurate it stays, and how easily your team can use it.
Here’s how Shopify analytics and Usermaven stack up when you look beneath the surface.
Measuring the metrics depth
Before choosing any ecommerce analytics tool, it helps to see what kind of metrics each one focuses on and how detailed they get.
Funnel analysis with campaign and device segmentation
Cohorts and LTV by source and campaign
Assisted conversions and journey steps
ROAS/ROI tied to actual revenue, not just clicks
Content and creative influence on conversion
Data quality and trust
With any ecommerce dashboard, accuracy depends on three things:
Clean tracking: Consistent UTMs, event names, and cross-domain setup.
Identity stitching: Joining anonymous and known sessions.
Attribution logic: Transparent models you can explain.
Shopify analytics handles core store data well. Usermaven helps you enforce tracking hygiene and stitches identities so web behavior and store events tell the same story. That means fewer data discrepancies and more confidence in every report.
Collaboration and reporting
Once the numbers are right, teams need to turn them into action. That’s where reporting flexibility matters most.
Shopify
Simple exports and canned reports.
Good for finance and ops snapshots.
Usermaven
Custom dashboards for growth, lifecycle, and paid media.
Scheduled reports for weekly standups.
Workspace views for agencies and brand teams.
Side-by-side views for Shopify analytics comparison in exec decks.
Implementation and maintenance
Setup time often decides whether a tool actually gets used.
Shopify:
Zero setup, analytics come built-in with every store
Usermaven:
Quick connection with Shopify and your website
Simple event confirmation and UTM alignment
Guided setup that ensures your funnels and attribution start tracking cleanly
Tip: Start by aligning campaign naming conventions and mapping your core ecommerce conversion funnel (landing page → product → checkout → purchase).
You’ll start seeing meaningful insights almost immediately.
Result: Shopify gives you instant visibility. Usermaven gives you ongoing clarity.
Cost and ROI
Every analytics tool has a cost, but the right one should quickly pay for itself.
Shopify analytics is part of your platform fee. It’s the cheapest way to get basic visibility.
Usermaven pays for itself when you can shift even a small portion of ad spend from low-performing tactics to proven journeys. The lift from accurate revenue attribution and conversion tracking compounds over time.
Common objections (and honest answers)
“We don’t have time to add another tool.” If you spend five figures on ads each month, you’re already “paying” for bad attribution. A few hours to set up Usermaven dashboard views can stop ongoing waste.
“Our agency already reports on performance.” Great, give them better data. Agencies move faster and make bolder calls when they can see multi-touch attribution and funnel leaks in one place.
“Shopify already shows marketing.” It does. But when budgets get tight, you need more than a blended view. That’s when deeper ecommerce performance tracking pays off.
The bottom line!
If you’re relying on a blended last-click view, you’re flying half-blind. Pair Shopify’s store reporting with a dashboard built for growth decisions.
That’s where Usermaven stands out as marketing attribution software for ecommerce teams. It connects Shopify data, customer journeys, marketing touchpoints, and revenue outcomes in one place, so you can see what drives sales and turn those insights into action with clarity you can trust.
Ready to see it in action?
Book a demo and discover how Usermaven can turn your ecommerce dashboard into a true growth engine.
See Usermaven in action
Book a free demo and discover how powerful analytics can grow your business.
*No credit card required
FAQs
1. Can I use Shopify analytics and Usermaven together?
Yes. Many ecommerce brands use Shopify analytics for operational metrics and Usermaven for marketing and revenue insights. Connecting both gives you a complete view; Shopify covers sales performance, while Usermaven adds multi-touch attribution, funnel tracking, and customer journey analytics.
2. How does Usermaven integrate with Shopify for event tracking?
Usermaven connects directly to your Shopify store using a simple tracking pixel. Once added, it automatically captures key customer actions such as product views, add-to-cart, and checkout completion. These events sync in real time to your Usermaven workspace, where you can analyze funnels, cohorts, and revenue attribution without writing code.
3. What makes Usermaven different from other ecommerce analytics tools?
Unlike many ecommerce analytics tools that focus only on traffic or conversions, Usermaven provides a complete view. It connects marketing attribution, product usage, and customer lifetime value. It’s designed to help ecommerce brands make growth decisions, not just report numbers.
4. How secure is the data shared between Shopify and Usermaven?
Usermaven uses secure, encrypted data transfer between your store and its analytics servers. It follows GDPR-compliant standards and stores only essential event data for analytics purposes. Sensitive customer details like payment information are never accessed or processed.
5. Does Usermaven work with ecommerce platforms other than Shopify?
Yes. Usermaven also works with platforms like WooCommerce, BigCommerce, and custom-built stores. Its flexible event tracking system makes it adaptable to any ecommerce setup.
Ruler Analytics pricing is based on monthly website traffic and the level of measurement a business needs. Current plans start at $400 per month for up to 10,000 visits and rise to $2,000 per month for more than 100,000 visits. The final cost can also depend on product, data, and integration requirements. Features such as […]
A shopper may discover a product through a Meta ad, return through Google Search, open an email, and complete the order by visiting the store directly. Every platform may claim credit for the same sale. Without reliable ecommerce attribution, teams cannot tell which interaction created demand, which one assisted the decision, and which one simply […]
An agency onboards a new ecommerce client and realizes the attribution tool built for their B2B SaaS clients does not handle Shopify data at all. Two months later, a different client asks for white-labeled reports, and the same platform cannot produce them either. Most attribution tools help marketers see performance. Agencies need tools that help […]