Choosing digital analytics tools should start with a business question, not a dashboard screenshot. A platform that explains website traffic may not reveal why customers abandon onboarding or which campaigns create revenue.
For most website reporting, Google Analytics 4 is a practical starting point. Mixpanel and Amplitude suit product teams; Fullstory and Contentsquare investigate experience friction. Usermaven is a strong fit when marketing teams need acquisition, customer journeys, and revenue attribution together.

Key takeaways
- Best for acquisition-to-revenue measurement: Usermaven connects marketing attribution with website and product activity, customer records, and downstream outcomes.
- Best general-purpose starting point: Google Analytics 4 tracks traffic, engagement, and configured conversions across websites and apps.
- Best for product behavior: Mixpanel, Amplitude, and PostHog support event-based funnels, retention, and deeper product analysis.
- Best for experience friction: Fullstory, Contentsquare, and Microsoft Clarity reveal where visitors struggle through recordings and behavioral signals.
- Best buying principle: Validate event quality, identity matching, and conversion reconciliation before comparing dashboard designs.
What are digital analytics tools?
Digital analytics tools collect and analyze activity across websites, apps, campaigns, and customer touchpoints. They help teams measure acquisition, behavior, conversion, retention, and—in some platforms—revenue contribution.
The category is broad. Website analytics explains who visited and where traffic came from. Product analytics examines actions after entry. Experience analytics helps explain friction. Marketing attribution connects touchpoints to selected business outcomes.
For example, a SaaS company might use website analytics to identify a high-traffic landing page, product analytics to find onboarding drop-offs, and attribution to connect paid campaigns with upgraded accounts.
Digital analytics categories at a glance
| Category | Primary question | Example metrics | Typical tools |
|---|---|---|---|
| Website analytics | Where do visitors come from? | Sessions, engaged visits, landing-page conversions | GA4, Matomo, Plausible |
| Product analytics | What do users do after signup? | Activation, funnels, retention, feature adoption | Mixpanel, Amplitude, PostHog |
| Experience analytics | Where does the interface create friction? | Rage clicks, replay patterns, journey abandonment | Fullstory, Contentsquare, Clarity |
| Marketing attribution | Which touchpoints contribute to business outcomes? | Attributed revenue, pipeline, cost per customer | Usermaven |
| Mobile measurement | Which app campaigns lead to installs and actions? | Installs, post-install events, mobile attribution | AppsFlyer |
The most useful choice depends on the decision a team needs to make. A heatmap and a revenue attribution report answer different questions, even when both are called digital analytics.
Which digital analytics tool fits your goal?
The following shortlist compares the 13 platforms by their strongest use case and an important buying consideration. These are editorial recommendations, not claims that any platform works only in one category.
Digital analytics tools comparison
| Tool | Best for | Main strength | Consider before buying |
|---|---|---|---|
| Usermaven | Marketing, growth, and B2B SaaS teams | Acquisition-to-revenue attribution with journeys | Requires reliable conversion, CRM, and identity data |
| Google Analytics 4 | General website and app reporting | Traffic sources, events, and Google ecosystem | Implementation and channel definitions need review |
| Mixpanel | Product managers | Funnels, cohorts, product intelligence | Event volume and instrumentation scope |
| Amplitude | Product-led teams | Behavioral analysis and experimentation | Data design and advanced-plan requirements |
| PostHog | Engineering-led teams | Analytics, replay, flags, and experiments together | More technical ownership may be needed |
| Fullstory | UX and product experience teams | Session context and friction investigation | Replay governance and commercial fit |
| Contentsquare | Large digital experience teams | Journey, zone, and experience analysis | Platform breadth and implementation resources |
| Adobe Analytics / CJA | Enterprise analytics programs | Cross-channel analysis and governance | Integration complexity and enterprise costs |
| Matomo | Teams prioritizing data hosting control | Web analytics with on-premise option | Hosting and maintenance for self-managed use |
| Piwik PRO | Regulated or governance-heavy organizations | Analytics with consent and governance tools | Check the exact deployment and feature package |
| Plausible | Content sites and small teams | Lightweight website reporting | Less depth for product and revenue journeys |
| AppsFlyer | Mobile app growth teams | Mobile install and campaign measurement | Mobile integrations and attribution constraints |
| Microsoft Clarity | Teams starting UX investigation | Heatmaps and session recordings | Not a full product or revenue analytics system |
13 best digital analytics tools in 2026
We assessed these platforms against five practical criteria: measurement coverage, useful analysis, implementation effort, data governance, and pricing structure. Category fit matters more than a universal feature count.
1. Usermaven: Marketing attribution and revenue
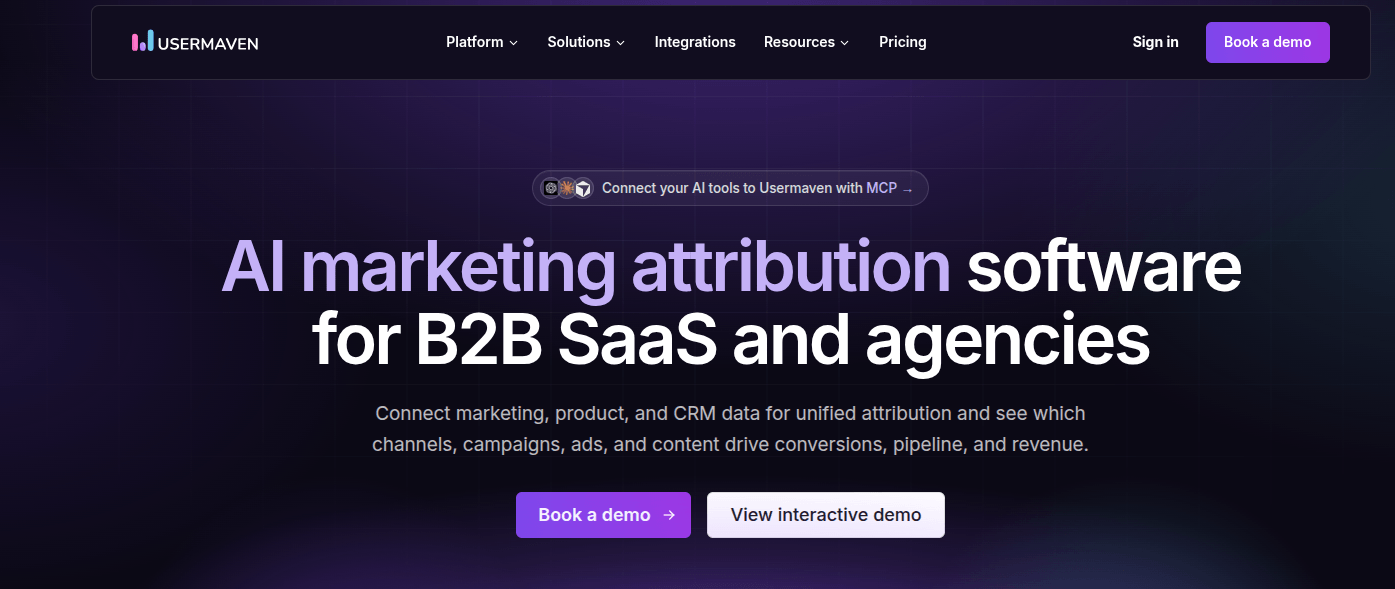
Best for: SaaS, B2B marketing, agencies, and growth teams connecting traffic and campaigns to customers, pipeline, and revenue.
Usermaven combines website analytics, product events, funnels, journeys, and multi-touch attribution. The key advantage is moving from a channel report to a business question: which campaigns help produce qualified customers and revenue?
Its platform can connect ad sources and CRM data, track conversion paths, and analyze customer and company activity. This makes it especially relevant when a lead-to-customer journey spans multiple visits and channels.
Maven AI supports natural-language analysis and scheduled Agents. Usermaven also provides MCP access and a Measurement Trust Center that checks campaign data, customer matching, integrations, conversion feedback, and other data-health signals.
Trade-off: Revenue-level analysis is only as dependable as identity stitching, conversion definitions, and connected business records. Usermaven is not a replacement for dedicated session replay or qualitative usability research.
Pricing: Current public plans are Business and Enterprise, with demo-led, needs-based pricing. Review the current Usermaven pricing structure rather than older fixed-price blog references.
Teams weighing a narrower event-analysis stack against a revenue-focused platform can compare the Usermaven alternative to Mixpanel.
2. Google Analytics 4: General website analytics

Best for: Businesses needing a widely adopted foundation for website and app engagement, acquisition, and conversions.
GA4 organizes activity around events, with reports for traffic acquisition, engagement, key events, ecommerce, and advertising performance. It is particularly convenient for teams already using Google’s marketing products.
Its exploration features and attribution reporting can go beyond simple last-click summaries. However, meaningful answers still depend on correct key-event setup, campaign parameters, consent settings, and channel classifications.
Trade-off: Teams seeking account-level CRM attribution may need additional integrations and a carefully maintained identity strategy. GA4 is not inherently incapable of attribution, but its standard reporting may not match complex revenue workflows.
Pricing: Standard GA4 is available at no software license cost; the enterprise-oriented Google Analytics 360 offering is commercial.
For teams evaluating acquisition-to-revenue reporting, see where a GA4 alternative changes the measurement workflow.
3. Mixpanel: Product funnels and retention

Best for: Product managers and growth teams measuring activation, repeat usage, and feature engagement.
Mixpanel lets teams analyze event sequences, audience cohorts, retention, and product journeys. Its current platform also includes AI features, session replay, heatmaps, experiments, and feature flags, so it should not be described as event reports alone.
A useful application is comparing onboarding completion for users who tried a specific feature against those who did not. That analysis can identify a behavioral association worth testing in an experiment.
Trade-off: Costs and reporting quality depend on event definitions and volume. Teams should scope noisy auto-captured events before assuming the free allowance represents production usage.
Pricing: Free and usage-based paid options are available, plus enterprise arrangements. The Mixpanel pricing explainer provides additional cost considerations.
4. Amplitude: Product strategy and experimentation
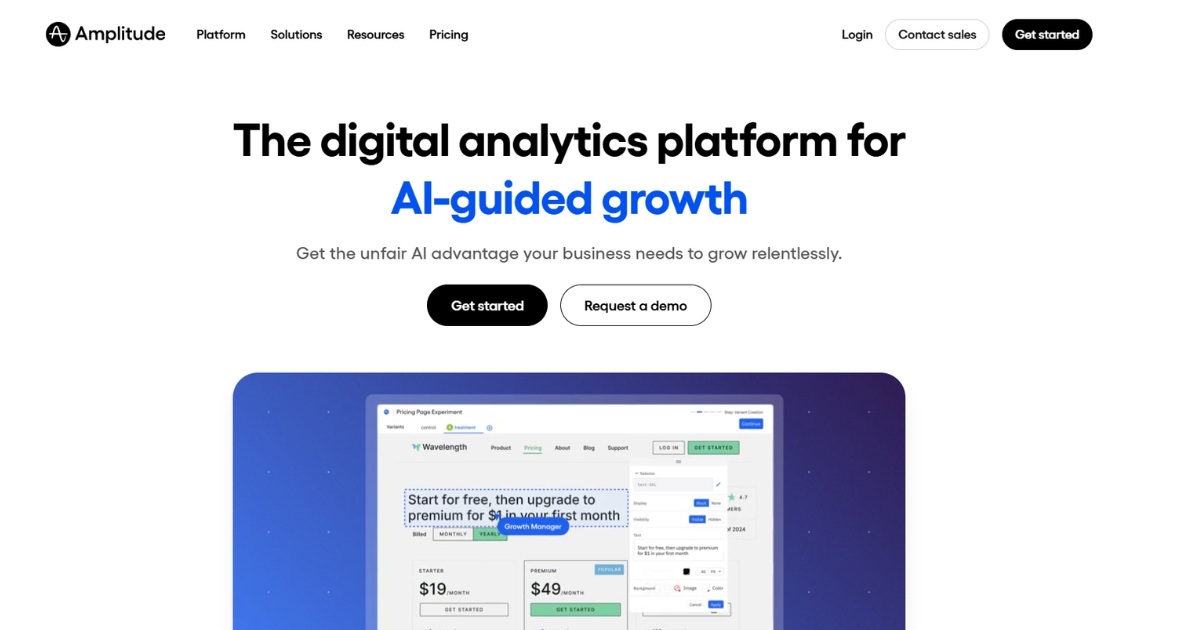
Best for: Product-led companies exploring activation, behavioral cohorts, feature impact, and retention.
Amplitude combines product analytics with experimentation and digital experience capabilities. Teams can use funnels, retention views, behavioral segments, and experiments to investigate how changes affect defined product outcomes.
For example, a product team might isolate customers who completed an onboarding milestone, then compare their subsequent retention with users who did not reach it. This describes an association, not proof of causation.
Trade-off: Results depend heavily on consistent event naming, identity rules, and cohort definitions. Large deployments may also require governance and paid capabilities beyond the entry plan.
Pricing: Free, Plus, Growth, and Enterprise plans exist; pricing and included events vary. The Amplitude alternative comparison explains when a revenue-centric requirement changes the shortlist.
5. PostHog: Developer-led product analytics

Best for: Technical teams that want analytics alongside feature flags, experiments, and debugging workflows.
PostHog connects product events with funnels, paths, retention analysis, session replay, feature flags, and experimentation. Its technical workflow appeals to teams that prefer instrumenting, investigating, and iterating within one developer-oriented stack.
Autocapture can provide useful starting data, but critical business actions still need explicit definitions. Engineering teams can connect experiments with the behavior and recordings of affected users.
Trade-off: The broad toolset can mean more implementation and operational decisions than a simple traffic dashboard. Evaluate event volume, recording retention, and access controls as usage grows.
Pricing: A recurring free allowance and usage-based upgrades are available. For broader context, review these product analytics alternatives before deciding whether to combine analytics and attribution.
6. Fullstory: Session context and friction

Best for: UX and product teams investigating confusing interfaces and unexpected abandonment.
Fullstory focuses on digital experience intelligence, combining session context with behavioral analysis. Recordings and interaction signals help researchers see what happened around a failed form, difficult navigation, or broken user flow.
For example, a funnel might show that payment completion fell. Replay analysis can then reveal repeated errors or confusing interactions near the affected step.
Trade-off: Recordings explain behaviors but do not independently measure whether a marketing channel caused revenue. Privacy masking, retention, sampling or coverage, and governance should be evaluated during procurement.
Pricing: Enterprise-oriented packages and commercial terms vary by scope. Teams comparing replay depth with product analytics can review Heap vs. Fullstory vs. Usermaven.
7. Contentsquare: Enterprise digital experience
Best for: Established digital businesses improving complex websites, ecommerce journeys, and large-scale experience performance.
Contentsquare emphasizes digital experience analysis through journey exploration, visual behavior analysis, and friction signals. Its product analytics capabilities also incorporate technology previously known as Heap.
That broader ecosystem matters when comparing older lists. Heap and Hotjar should not be treated as unrelated standalone choices without acknowledging the current Contentsquare product family.
Trade-off: Enterprises may benefit from the depth, but smaller teams can find the platform broader than needed. Evaluate implementation responsibility, data governance, and which modules are actually included.
Pricing: Plan details depend on products, traffic, and enterprise requirements; request a current scoped quote.
8. Adobe Analytics / CJA: Enterprise journeys

Best for: Large organizations with extensive cross-channel datasets, governance needs, and dedicated analytics resources.
Adobe Analytics supports detailed enterprise reporting. Adobe Customer Journey Analytics (CJA) extends analysis across online and offline datasets brought into Adobe Experience Platform, using common identifiers and data views.
That distinction matters for businesses trying to analyze behavior across web, app, service, and offline interactions. CJA also supports advanced journey analysis and contemporary integrations for AI-assisted workflows.
Trade-off: The value depends on existing architecture and disciplined data modeling. Procurement, identity design, integration work, and user enablement are significant considerations.
Pricing: Enterprise contracts; request product-specific proposals rather than assuming Adobe Analytics and CJA are the same package.
9. Matomo: Self-hosted website analytics

Best for: Organizations that want substantial control over analytics hosting and data operations.
Matomo provides website analytics, campaign measurement, goals, and visitor analysis with both cloud and on-premise deployment options. It is a credible GA4 alternative for teams prioritizing infrastructure ownership and configurable privacy practices.
Matomo has also expanded its AI-related workflow through MCP access, so it should not be dismissed as an outdated reports-only product.
Trade-off: Self-hosting involves infrastructure, backups, updates, and security ownership. Advanced modules, support, or cloud usage can change total cost.
Pricing: Self-hosted and commercial cloud/enterprise paths exist. Compare implementation trade-offs with the Matomo alternative page.
10. Piwik PRO: Governed analytics programs

Best for: Teams with rigorous consent, privacy, data access, and deployment requirements.
Piwik PRO brings web and product-style analytics together with tools for consent management and tag governance. It is often shortlisted when analytics ownership and information governance are central buying concerns.
A regulated organization, for instance, may evaluate where data is hosted, how consent choices affect collection, and whether administrators can control access at the required level.
Trade-off: The presence of privacy-related features does not make a deployment compliant by default. Legal requirements, consent configuration, and data flow still need independent review.
Pricing: Commercial packages and limits vary. Request a current quote with hosting, consent, and support requirements clearly specified.
11. Plausible: Lightweight website reporting

Best for: Blogs, content businesses, and small teams seeking readable website metrics without a large implementation project.
Plausible focuses on straightforward website reporting, campaign tracking, and goals. It is useful when the primary task is understanding traffic performance rather than reconstructing complex product and CRM journeys.
A publishing team can use it to inspect landing-page performance and referral trends without maintaining a highly customized analytics implementation.
Trade-off: Teams needing advanced product cohorts, customer identity stitching, or multi-touch revenue attribution will likely require additional tools.
Pricing: Paid plans generally scale with website traffic and selected features. See the Plausible alternative comparison for a broader attribution use case.
12. AppsFlyer: Mobile growth measurement

Best for: Mobile app marketers measuring installs, post-install activity, and acquisition campaigns.
AppsFlyer is a mobile measurement platform designed around app marketing attribution and related workflows. It helps connect campaign activity to installs and selected in-app events across mobile ecosystems.
This is distinct from general website reporting. A mobile app subscription business may need to know whether an installation source also produces trial activations and renewals.
Trade-off: Mobile attribution depends on SDK integration, platform privacy rules, identifier availability, and campaign data. Attribution outputs should not be equated with incremental causal lift.
Pricing: Usage and service requirements influence commercial terms. Confirm the relevant measurement and privacy capabilities during evaluation.
13. Microsoft Clarity: Accessible UX diagnostics
Best for: Teams that want to investigate website interactions with heatmaps and session recordings.
Microsoft Clarity helps visualize clicks, scrolling, and recorded sessions. It is an approachable companion to an existing website analytics platform, especially when the question is why a page performs unexpectedly.
For example, a marketer can notice a landing-page conversion decline in web analytics, then investigate whether visitors repeatedly click a noninteractive element.
Trade-off: Recordings and heatmaps show interaction patterns, not a complete account journey or CRM revenue attribution. Teams should verify privacy handling, masking, and suitability for their audience.
Pricing: Clarity’s core analytics offering is free; check current terms and integration requirements before deployment.
How do you choose the right digital analytics tool?
The best digital marketing analytics tools answer the decisions an organization actually makes. Start with the intended outcome, then evaluate whether the platform collects the necessary evidence.
Seven questions to ask before buying
| Evaluation factor | Ask this before committing | A weak answer looks like |
|---|---|---|
| Business outcome | Which decision will the report change? | “We want more dashboards.” |
| Event coverage | Are key actions reliably collected? | Missing checkout, signup, or activation events |
| Identity and accounts | Can activity join across devices and CRM records? | A lead and customer appear as separate people |
| Attribution rules | How are channels, lookbacks, and models defined? | Different platforms claim the same sale without context |
| Data governance | Who can access data, and what is retained? | No clear consent, masking, or export policy |
| Total cost | What happens at expected event and replay volumes? | A low entry price hides costly production usage |
| Usability | Can the actual team answer questions unaided? | Every report requires an engineering ticket |
Do not buy on the number of supported charts. First define a decision such as reallocating paid spend, reducing churn, or fixing an onboarding step.
The right measure follows the decision. For instance, lead-to-customer conversion rate = new customers ÷ eligible leads × 100. Both the numerator and denominator need consistent time windows and definitions.
For a broader set of measures, you can use the digital marketing metrics and KPIs guide.
What should you validate before switching tools?
A two-week proof of concept can expose measurement problems that a polished sales demo will not. Use the same controlled test across shortlisted platforms wherever possible.
A five-stage measurement reliability audit
| Stage | Verification test | What failure tells you |
|---|---|---|
| 1. Define | Document one conversion, owner, and reporting window | Teams may be comparing different outcomes |
| 2. Collect | Complete a test journey and confirm each critical event arrives once | Event loss or duplication is distorting funnels |
| 3. Match | Move from anonymous visitor to known lead or account and confirm identity continuity | Customer journeys may fragment at signup |
| 4. Reconcile | Match a known deal, order, or subscription to the analytics conversion record | Reported conversions may not reflect business records |
| 5. Decide | Reproduce a channel or segment recommendation from documented inputs | The team cannot explain the decision or trust the metric |
Example: A campaign that appears successful
Assume Campaign A generates 120 reported signups, but only 45 reach the CRM as eligible leads. Of those, nine become paying customers.
If the analytics stack measures signups alone, Campaign A can look outstanding. A revenue-oriented view asks whether the 120 signups reconcile with 45 eligible leads and nine customers.
It also checks for duplicate events, delayed conversions, and differences between platform-reported and observed outcomes. That is the difference between measuring activity and validating a decision.
Attribution remains a model of observed touchpoints, not proof that a campaign caused a sale. Use incrementality experiments when the decision requires causal lift rather than credit assignment.
For Usermaven implementations, the Measurement Trust Center helps surface issues with campaign tracking, customer matching, connected platforms, conversion feedback, and data confidence.
Can one tool replace an entire analytics stack?
Sometimes—but only when the tools being replaced answer overlapping questions. Consolidation reduces tool switching and reporting disagreement, yet specialized systems can still be valuable.
A content site may need GA4 or Plausible for traffic and Clarity for UX investigation. A product-led startup may prefer PostHog or Amplitude for behavioral experiments.
A SaaS marketing team may prioritize Usermaven when campaign performance must connect with signups, product activity, CRM stages, and revenue. In that case, isolated traffic and attribution dashboards can create avoidable reconciliation work.
What the revenue connection changes
Consider two channels with similar signup counts. Channel A generates more visitors, while Channel B produces fewer signups but a higher share of paying customers.
A traffic-only report favors A. A connected customer and revenue view can show why B deserves more investment—provided acquisition, identity, and financial records are accurate.
In its published ContentStudio customer story, Usermaven reports 128% signup growth, 92% more plan upgrades, and 242% more demo bookings during the documented improvement program.
These are customer-reported outcomes alongside tracking, funnel, and marketing changes—not evidence that software installation alone caused the increases.
The broader lesson is to compare tools on the decision chain they support: source → behavior → conversion → customer → revenue.
Final verdict: Choose the decision, then the tool
The best digital analytics tools are not interchangeable. GA4 is a sensible general starting point, Mixpanel and Amplitude suit product questions, and Fullstory or Contentsquare help diagnose experience problems.
For teams where marketing performance must be tied to pipeline and revenue, Usermaven is worth shortlisting alongside the specialized platforms. Verify identity matching, conversion quality, and reporting definitions before committing.
If connecting acquisition, customer journeys, CRM outcomes, and revenue is the priority, book a Usermaven demo to evaluate the platform against your measurement requirements.
FAQs about digital analytics tools
1. What is the best digital analytics tool for small businesses?
For straightforward traffic reporting, GA4 or Plausible can be sufficient. For basic UX diagnostics, add Microsoft Clarity. Small SaaS teams that must connect campaigns with paying customers should also evaluate Usermaven.
2. What is the difference between web and product analytics?
Web analytics emphasizes visits, sources, engagement, and landing pages. Product analytics focuses on actions inside an app or product, including activation, feature adoption, funnels, and retention. Some platforms cover both.
3. Which tools are best for digital marketing analytics?
GA4 is useful for general acquisition and conversion reporting. Usermaven fits teams connecting marketing touchpoints with CRM outcomes and revenue. AppsFlyer is specialized for mobile acquisition. Choose based on what conversion means to the business.
4. Are free digital analytics tools enough?
Free plans can cover meaningful website or product measurement, but event limits, retention, governance, and integrations vary. Validate the cost and collection quality at real production volumes before deciding a free plan is sufficient.
5. Can a digital analytics tool prove marketing lift?
No attribution report alone proves causal lift. Attribution assigns credit using observed touchpoints and model rules. To determine whether marketing caused additional conversions, use a well-designed incrementality experiment with a credible control group.
6. Can I replace Google Analytics 4 with another platform?
Yes, if another platform covers the organization’s reporting, integration, privacy, and historical-data needs. Many teams keep GA4 for Google ecosystem reporting while using other tools for product analysis, UX investigation, or revenue attribution.

Written by
Adeel Khan
Growth Marketing Expert
Adeel Khan is a full-stack SaaS marketer with 10+ years of experience in content marketing, paid advertising, analytics, and conversion rate optimization. He shares practical insights and strategies drawn from hands-on experience, helping B2B SaaS marketers improve performance and make better marketing decisions.
All articles by Adeel →