In this guide, we compare leading marketing campaign analytics tools by core features, pricing, tradeoffs, and overall fit.
What are campaign analytics tools?
Campaign analytics tools are software platforms that help you track, measure, and understand the performance of your marketing campaigns.
They add context to campaign data by bringing performance across channels into one view. Instead of reading paid, organic, email, referral, and product touchpoints separately, you can see how each one contributes to the overall result.
That makes campaign analysis in marketing more useful. You are not just reporting on activity. You are understanding what influenced conversions, where drop-offs happened, and which campaigns are worth improving or scaling.
Most campaign tracking and analytics tools help you answer questions like:
Which campaigns are driving qualified traffic?
Which channels are leading to conversions?
Where are users dropping off before converting?
Which campaigns influence revenue, not just clicks?
What should be optimized, paused, or scaled?
Top campaign analytics tools worth considering
The right tool depends on what you want to measure, how much context you need, and how complex your reporting workflow is.
The table below gives you a quick side-by-side view of the best campaign analysis tools to help narrow the list faster.
Tool
Primary focus
Best for
Pricing model
Usermaven
Attribution and unified campaign analytics
SaaS, ecommerce, and growth teams
Tiered monthly plans with an annual discount
Google Analytics
Web and campaign analytics
Teams already using Google tools
Free plan with enterprise custom pricing
Mixpanel
Behavioral and product analytics
Product-led teams
Free plan plus usage-based pricing
Amplitude
Behavioral analytics and retention
Digital product teams
Free plan plus tiered and custom pricing
HubSpot Marketing Hub
Campaign analytics with CRM
B2B and pipeline-focused teams
Tiered pricing based on seats and contacts
Heap
Auto-captured behavioral analytics
Teams that want flexible event tracking
Free plan plus custom pricing by session volume
Kissmetrics
User-level analytics and revenue tracking
Lifecycle and conversion-focused teams
Tiered pricing based on event volume
Matomo
Privacy-first analytics
Compliance-conscious teams
Paid cloud plans plus self-hosted options
Plausible Analytics
Lightweight campaign reporting
Small teams and simple websites
Usage-based monthly pricing
Ruler Analytics
Marketing attribution and revenue tracking
Lead-gen and B2B teams
Tiered pricing based on traffic and requirements
Dreamdata
B2B attribution and pipeline analytics
Revenue teams and ABM-focused teams
Free entry point plus custom pricing
Whatagraph
Marketing reporting and dashboards
Agencies and in-house reporting teams
Tiered monthly pricing based on source credits
AgencyAnalytics
Agency reporting and dashboards
Agencies managing multiple clients
Tiered monthly pricing by plan level
Databox
KPI dashboards and performance reporting
Teams focused on executive reporting
Free plan plus tiered monthly pricing
Tableau
BI and campaign dashboards
Teams combining multiple data sources
Seat-based pricing by user role
Funnel
Marketing data centralization
BI-led and warehouse-led teams
Custom pricing based on use case and scale
Supermetrics
Marketing data pipelines
Teams reporting in Sheets or BI tools
Pricing varies by destination and connectors
AppsFlyer
Mobile attribution and ROI measurement
App marketing teams
Free entry plan plus volume-based pricing
TapClicks
Multi-channel reporting operations
Agencies and media teams
Custom quote-based pricing
Semrush
Search and competitive campaign analysis
SEO and content-focused teams
Tiered monthly subscription pricing
Hotjar
UX and post-click behavior analysis
Landing page and CRO teams
Free plan plus tiered monthly pricing
Zoho Analytics
Self-service BI and dashboards
Budget-conscious teams
Tiered monthly pricing by users and rows
Salesforce Marketing Cloud Intelligence
Enterprise campaign intelligence
Large Salesforce-based teams
Starter pricing plus higher-tier annual plans
ThoughtSpot
Search-driven analytics and BI
Teams that want self-serve analysis
Seat-based pricing plus enterprise plans
Adobe Analytics
Enterprise analytics and journey analysis
Large organizations with complex reporting needs
Custom enterprise pricing
1. Usermaven
Usermaven is an attribution platform built for marketers who want to tie campaigns to conversions, revenue, and the full customer journey. It helps teams move beyond traffic reporting by showing which channels and touchpoints actually influence outcomes.
Because it combines campaign analytics with behavioral insight, it fits naturally into a conversion-focused stack. It is especially useful for teams that want clearer attribution without stitching together several different tools.
A clean interface makes the platform approachable for non-technical teams.
Does not offer a free plan, but users can explore the platform through a free trial
Reporting feels easier to act on because views are built for marketers, not just analysts.
May be more than you need if you only want basic campaign reporting
Real-time dashboards make campaign monitoring easier for fast-moving teams.
Pricing: Paid plans start at $84/month, making it a strong-value option for teams that want attribution, analytics, and reporting in one platform. There’s also a 14-day free trial, and choosing annual billing gives you an additional 15% discount.
Good fit for: SaaS, ecommerce, and growth teams that want attribution and campaign analytics without a heavy setup.
Maximize your ROI
with accurate attribution
*No credit card required
2. Google Analytics
Google Analytics remains one of the most widely used tools for campaign measurement, especially for teams already working inside Google’s ecosystem. It is useful for acquisition, event tracking, and conversion reporting, but often needs more setup and interpretation than simpler campaign-focused platforms.
Key features
Campaign tracking works well with UTM parameters and Google Ads.
Event-based measurement supports conversion analysis across journeys.
Attribution reporting helps compare touchpoints across channels.
Custom reports and explorations allow deeper campaign analysis.
Native Google ecosystem integrations help centralize ad and site data.
Pros
Cons
Standard GA4 is free to use.
Reporting can feel less intuitive for non-specialists.
Familiar choice for teams already using Google Ads and Search Console.
Getting clean campaign views often takes extra configuration.
Enterprise pricing is not clearly published by Google.
Pricing: Google Analytics is free. Google Analytics 360 pricing is not publicly available and requires contacting sales.
Good fit for: Teams already invested in Google tools that want broad web and campaign analytics.
3. Mixpanel
Mixpanel is a behavioral analytics platform that works well when campaign teams want to see what acquired users actually do after they arrive. It is strongest for event-based analysis and conversion behavior rather than simple top-level reporting.
Key features
Event tracking captures campaign-driven actions in detail.
Funnel analysis highlights where users abandon conversion flows.
Segmentation compares campaign audiences by behavior.
Cohorts help track retention after acquisition.
Dashboards support ongoing growth reporting.
Pros
Cons
Flexible enough for deeper behavioral analysis than many reporting tools.
Pricing rises as tracked event volume grows.
Useful when marketing and product teams need to work from the same data.
It leans more toward product analytics than all-in-one campaign attribution.
Some teams still need another tool for broader cross-channel reporting.
Pricing: Free plan available with usage limits; paid pricing is usage-based, so cost increases as event volume grows.
Good fit for: Product-led teams that want campaign performance tied to user behavior.
4. Amplitude
Amplitude is built for behavioral analysis, cohorts, and engagement reporting. For campaign teams, it is most useful when the goal is to understand how acquired users behave after signing up rather than just how traffic converts on-site.
Key features
Event and cohort analytics reveal post-campaign behavior.
Custom dashboards help track acquisition alongside engagement.
Experimentation and audience tools support growth analysis.
Pros
Cons
Strong choice for teams that care about retention as much as acquisition.
Setup can feel heavier than simpler campaign tools.
Useful for connecting paid or lifecycle campaigns to downstream product behavior.
Public pricing is only partly transparent beyond entry tiers.
It is better for behavioral depth than lightweight attribution reporting.
Pricing: Free starter plan available with feature limits; paid plans start at $49/month, with higher tiers custom-priced.
Good fit for: Digital product teams that want campaign insights beyond first conversion.
5. HubSpot Marketing Hub
HubSpot Marketing Hub brings campaign analytics into a broader CRM and inbound marketing workflow. It stands out when teams want campaign reporting tied closely to forms, email, lead management, and lifecycle data.
Key features
Campaign analytics sit alongside CRM and contact data.
Email and form reporting help connect campaigns to lead generation.
Attribution tools support channel and source analysis.
Dashboards combine campaign, pipeline, and conversion reporting.
Segmentation helps compare campaign performance by audience.
Pros
Cons
Strong fit for B2B teams that want marketing and CRM context together.
Costs can climb quickly with more contacts and higher tiers.
Helpful when campaign reporting needs to connect to pipeline stages.
Free and lower tiers are limited for deeper analytics needs.
Convenient for teams already standardized on HubSpot.
It is broader marketing software, not a focused attribution platform.
Pricing: Free tools are available with limits; paid Marketing Hub plans are public and scale by tier, seats, and marketing contacts, so cost rises with usage.
Good fit for: B2B teams that want campaign analytics tied to CRM and pipeline.
6. Heap
Heap is known for automatic event capture, which helps teams analyze campaign-driven behavior without planning every event upfront. That makes it useful for teams that want more flexibility in how they investigate conversion paths later on.
Key features
Automatic event capture records clicks, views, and submissions.
Retroactive analysis lets teams define events after data is collected.
Session-level behavior can add context to campaign performance.
Pros
Cons
Saves time upfront because teams do not need to tag everything manually.
Most paid tiers are quote-led rather than fully transparent.
Helpful when teams want to revisit unanswered questions later.
Pricing scales with sessions, which can become expensive as traffic grows.
It can feel more specialized than a straightforward campaign reporting tool.
Pricing: Free plan includes limited sessions and history. Paid tiers are custom-priced and scale with session volume.
Good fit for: Teams that want automatic event tracking and flexible behavioral analysis.
7. Kissmetrics
Kissmetrics focuses on user-level analytics and revenue-oriented conversion tracking. It is a good option for teams that want campaign analysis centered on users and customer journeys rather than anonymous sessions alone.
Key features
User tracking helps connect campaigns to user activity.
Funnel reports show where prospects abandon the path to conversion.
Cross-device tracking helps build a fuller customer view.
Pros
Cons
User-based reporting can make campaign impact easier to understand.
Pricing increases with event volume.
Useful for teams focused on lifecycle and revenue, not just visits.
The product has a narrower ecosystem than some larger platforms.
It may feel more specialized than newer all-in-one analytics tools.
Pricing: Starts at $99/month after a $1 seven-day trial; pricing scales with event volume, and enterprise plans are custom.
Good fit for: Teams that want user-level campaign and conversion reporting.
8. Matomo
Matomo is a privacy-first analytics platform that gives teams more control over data ownership and deployment. It is especially relevant when campaign reporting needs to meet stricter compliance or self-hosting requirements.
Key features
Campaign reporting works with standard source and UTM tracking.
On-premise deployment gives more control over data.
No-sampling reporting helps preserve data quality.
Pros
Cons
Strong privacy and data ownership story.
The interface can feel less modern than newer tools.
Flexible cloud or self-hosted deployment.
Some teams may need more polish for everyday reporting.
Pricing: Matomo Cloud is paid, and self-hosted/on-premise options vary by setup and support needs.
Good fit for: Privacy-conscious teams that still need campaign and conversion reporting.
9. Plausible Analytics
Plausible is a lightweight analytics tool for teams that want simple campaign reporting without the complexity of bigger platforms. It works best for straightforward acquisition and conversion analysis rather than deep attribution modeling.
Easy to adopt for small teams that want clarity over complexity.
It is not built for advanced attribution work.
Pricing increases with pageviews and custom event volume.
Pricing: Paid plans start at $9/month and scale by total pageviews and custom events
Good fit for: Small teams that want simple campaign tracking without GA4 complexity.
10. Ruler Analytics
Ruler Analytics is built around marketing attribution and revenue measurement. It is especially useful for teams that need clearer visibility from campaign click to lead, call, opportunity, and revenue.
Key features
Multi-touch attribution connects campaigns to revenue outcomes.
Lead-to-revenue tracking closes the loop on performance.
Call tracking adds offline conversion visibility.
Journey reporting shows how channels contribute across touchpoints.
CRM integrations support sales-connected reporting.
Pros
Cons
Strong fit for lead-gen teams that need clearer revenue accountability.
Cost rises with traffic volume and integration requirements.
Helpful when offline conversions matter alongside form fills.
It is more specialized than broad analytics platforms.
Standard contracts are annual, which reduces flexibility.
Pricing: Starts at £179/month for lower-traffic plans, but the final cost depends on traffic and requirements.
Good fit for: B2B and lead-gen teams that want campaign attribution tied to revenue.
11. Dreamdata
Dreamdata is a B2B attribution and activation platform designed to connect campaign activity with pipeline and revenue. It is most relevant for companies that need account-level campaign insight rather than general website analytics.
Key features
B2B attribution ties campaigns to pipeline and revenue.
Account-level analytics help teams evaluate buying journeys.
Audience activation supports campaign follow-up across channels.
Web analytics and CRM data are brought into one view.
Benchmarks and journey reporting help prioritize spend.
Pros
Cons
Purpose-built for B2B revenue teams rather than broad web analytics.
Larger plans are custom-priced.
Useful when campaign reporting needs account and pipeline context.
Best results depend on mature CRM and GTM data quality.
Narrower fit than a general analytics platform.
Pricing: Small companies can start for free. Larger companies move to custom pricing, so the cost depends on company size and setup.
Good fit for: B2B teams that need campaign analytics connected directly to the pipeline and revenue.
12. Whatagraph
Whatagraph is a reporting-focused platform that helps teams turn campaign data into polished dashboards and client-ready reports. It focuses more on aggregation and presentation than deep attribution analysis.
Client-ready visualizations support external sharing.
Connectors pull data from ad and marketing platforms.
AI-assisted workflows help simplify reporting.
Pros
Cons
Strong choice when visual reporting quality matters.
It is more reporting-led than attribution-led.
Useful for agencies and in-house teams that share frequent updates.
Pricing typically rises with connected source credits.
Larger reporting setups can push teams into much higher tiers.
Pricing: Pricing starts at $249/month, and the total cost increases with source credits and plan level.
Good fit for: Agencies and marketing teams that need fast, presentation-ready campaign reports.
13. AgencyAnalytics
AgencyAnalytics is built for agencies that need campaign dashboards and client reporting across SEO, PPC, and social channels. It is strongest as an operational reporting tool rather than a deep attribution platform.
Key features
Automated dashboards pull data from 85+ integrations.
Client reporting is easy to brand and schedule.
PPC, SEO, and social metrics live in one interface.
Unlimited integrations per client support broader reporting.
Agency workflows are built into the platform.
Pros
Cons
Purpose-built for agency reporting workflows.
It focuses more on reporting than attribution depth.
Client-facing deliverables are easy to create and share.
Pricing grows as agency size and reporting needs expand.
Some advanced capabilities sit higher up the plan ladder.
Pricing: Starts at $59/month, and costs scale as agency needs and plan levels grow.
Good fit for: Agencies that want streamlined, client-ready campaign reporting.
14. Databox
Databox is a dashboarding and performance reporting tool that helps teams monitor campaign KPIs from multiple sources in one place. It is useful when visibility and executive reporting matter more than deep attribution logic.
Key features
Dashboards centralize campaign KPIs from multiple tools.
Automated reports help teams track performance consistently.
Custom metrics support channel-specific views.
AI-assisted analysis helps surface key changes.
Hourly data updates keep reports current.
Pros
Cons
Strong for executive-facing KPI reporting.
Attribution depth is not its core strength.
Makes multi-source campaign reporting easier to operationalize.
Costs rise as additional data sources are added.
Transparent pricing helps with evaluation.
Teams needing deeper raw-data analysis may outgrow entry plans.
Pricing: Free plan is available with limits. Paid plans start at $199/month.
Good fit for: Teams that want executive-friendly campaign dashboards across multiple tools.
15. Tableau
Tableau is a business intelligence and data visualization platform that helps teams turn campaign data into interactive dashboards and reports. It is most useful when campaign analytics involves combining data from multiple sources and presenting it clearly for stakeholders
Key features
Interactive dashboards support campaign reporting.
Multiple data connectors bring sources into one view.
Self-service analysis helps teams explore data faster.
Cloud and server deployment options support different setups.
Role-based access makes reporting easier to manage.
Pros
Cons
Strong for visual reporting and executive dashboards.
It is more of a BI tool than a dedicated campaign analytics platform.
Useful when campaign data needs to be blended with broader business data.
Total cost can grow as more users and licenses are added.
Flexible enough for teams with more advanced reporting needs.
It usually needs clean source data and setup work to deliver value.
Pricing: Seat-based and starts at an enterprise-level entry point, with total cost increasing by user role, deployment, and scale.
Good fit for: Teams that want flexible, stakeholder-friendly campaign dashboards built on top of multiple data sources.
16. Funnel
Funnel is a marketing data platform that centralizes campaign data from many sources and sends it to dashboards, BI tools, or warehouses. It is most useful when data sprawl is the main reporting problem.
Key features
Data aggregation pulls campaign data into one system.
Connectors support many ad and analytics platforms.
Measurement and modeling help standardize reporting.
Destination support works with BI tools and warehouses.
Dashboards can visualize unified campaign data.
Pros
Cons
Helpful for warehouse- or BI-led analytics environments.
Pricing is custom rather than transparently self-serve.
Good operational fit when the reporting stack is already complex.
It behaves more like a data infrastructure than a lightweight analytics tool.
Total cost tends to rise with data complexity and organizational scale.
Pricing: Funnel uses custom pricing based on use case, ad spend, and measurement needs rather than a simple flat public rate.
Good fit for: Teams that need to centralize campaign data before analyzing it elsewhere.
17. Supermetrics
Supermetrics is a marketing data platform best known for moving campaign data into spreadsheets, BI tools, and dashboards. It is more of a data delivery layer than a standalone analytics experience.
Key features
Connectors pull campaign data from many ad platforms.
Exports work well with Sheets, Looker Studio, Excel, and BI tools.
Data automation reduces manual reporting work.
Visualization workflows are easy to build on connected destinations.
AI-assisted workflows support analysis and activation.
Pros
Cons
Strong connector ecosystem for reporting-heavy teams.
It depends on external destinations for deeper analysis.
Good fit for analysts who already work in spreadsheets or BI tools.
It is not a full attribution product on its own.
Costs grow as connectors, destinations, and complexity increase.
Pricing: Varies by destination and connector set, so total cost increases as your data setup expands.
Good fit for: Marketers and analysts who already report in spreadsheets or BI tools.
18. AppsFlyer
AppsFlyer is a measurement platform built for mobile and cross-platform marketing. It is especially relevant when campaign analytics need to cover app installs, re-engagement, ROI, and channel performance across mobile ecosystems.
Key features
Mobile attribution measures installs and re-engagement.
ROI reporting helps compare paid acquisition efficiency.
Deep linking supports better campaign journeys.
Cost and revenue measurement improve campaign ROI analysis.
Best value shows up for mobile-first companies, not website-led teams.
Useful when ROI analysis needs to extend into app performance.
Many premium capabilities sit outside the basic entry plan.
Pricing becomes less straightforward as volume and add-ons increase.
Pricing: Free entry plan available with limits. Higher plans and premium features scale with volume and are not fully listed as simple flat pricing.
Good fit for: App marketers that need campaign analytics beyond web-only tools.
19. TapClicks
TapClicks is a reporting and analytics platform aimed at agencies and media teams managing campaign performance across many ad channels. It focuses more on reporting operations and visibility than on lightweight self-serve attribution.
Key features
Multi-channel reporting brings paid media data together.
Dashboards help standardize client and campaign views.
Agency workflows support recurring reporting at scale.
Customization makes channel-level reporting more flexible.
Cross-platform data integration reduces manual reporting work.
Pros
Cons
Good fit for agencies managing many campaigns.
It is more operational and reporting-heavy than simple analytics tools.
Helps unify campaign reporting across ad platforms.
Smaller teams may not need all the platform modules.
Pricing: Pricing is not publicly available, so buyers generally need a demo or a quote.
Good fit for: Agencies and media teams with reporting-heavy campaign operations.
20. Semrush
Semrush is not a traditional analytics platform, but it is still useful in campaign analysis when organic search, content performance, and competitive visibility are part of the picture. It adds channel context that many pure reporting tools miss.
Key features
Organic campaign tracking supports content and SEO analysis.
Competitor insights add market context to performance reporting.
Traffic and visibility tools support channel planning.
Reporting features help package campaign results.
Pros
Cons
Strong for search and competitive campaign context.
It is not built as a full cross-channel attribution platform.
Helpful when organic performance matters to campaign analysis.
Broader campaign reporting still needs other tools.
Pricing: Starts at $139.95/month. Higher tiers cost more as needs grow.
Good fit for: Teams that want campaign analytics with strong SEO and competitive context.
21. Hotjar
Hotjar is a behavior and UX analytics tool that complements campaign analytics by showing what users actually do after they click through. It is best used alongside a reporting tool, not as a full campaign measurement stack on its own.
Key features
Heatmaps reveal how campaign traffic interacts with pages.
Session recordings add context to conversion drop-offs.
Funnel-related behavior is easier to diagnose visually.
UX insights help explain why campaigns underperform.
Pros
Cons
An easy way to add qualitative context to landing-page performance.
Attribution and channel reporting remain limited.
Free starting option helps teams test it without much risk.
Advanced plans get more expensive, and larger deployments move toward custom pricing.
Pricing: Free plan available with limits. Paid plans start at $49/month, and larger setups move to custom pricing.
Good fit for: Teams that want UX context for campaign and landing-page performance.
22. Zoho Analytics
Zoho Analytics is a self-service BI tool that can pull campaign data into dashboards and reports without the enterprise complexity of heavier BI platforms. It is practical for teams that want more customization at a lower entry price.
Key features
Dashboards centralize campaign data from multiple sources.
Self-service reporting reduces dependency on analysts.
AI assistance helps users query campaign data faster.
Data blending supports broader cross-channel views.
It is a BI tool, not a campaign attribution platform by itself.
Useful for teams that want more control than fixed dashboards provide.
Setup can be more manual than lighter marketer-first tools.
Costs rise with users, rows, and higher plan tiers.
Pricing: Basic plan priced at $30/month. Pricing increases with users, rows, and tier.
Good fit for: Small to mid-market teams that want flexible campaign reporting on a budget.
23. Salesforce Marketing Cloud Intelligence
Salesforce Marketing Cloud Intelligence is built for enterprise cross-channel campaign reporting and marketing intelligence. It is most relevant for larger organizations that need advanced reporting within a broader Salesforce-led stack.
Key features
Cross-channel data unification supports enterprise reporting.
Dashboards help standardize campaign measurement at scale.
Salesforce ecosystem integration improves data flow.
Advanced reporting supports executive and operational use cases.
Large marketing teams can centralize performance views.
Pros
Cons
Strong fit for enterprises already committed to Salesforce.
Pricing is generally quote-led, not a simple public monthly rate.
Useful for centralizing complex campaign reporting at scale.
Better suited to larger teams with bigger budgets and more resources.
Works well when reporting needs are deeply tied to enterprise GTM systems.
Implementation and ongoing management can be heavier than SMB tools.
Pricing: Starts at $25/user/month, but full Marketing Cloud plans begin at $1,500/org/month, billed annually for more advanced campaign and marketing functionality.
Good fit for: Enterprise teams already invested in Salesforce that need large-scale campaign intelligence.
24. ThoughtSpot
ThoughtSpot is an analytics platform that emphasizes search-driven and AI-assisted analysis. For campaign analytics, it is useful when stakeholders want faster answers from data instead of relying only on fixed dashboards.
Key features
Natural-language queries help explore campaign data quickly.
AI-augmented dashboards surface patterns and changes.
Cross-team reporting improves shared visibility.
Search-driven analysis reduces dependence on static views.
Real-time analytics support faster decision-making.
Pros
Cons
Makes ad hoc analysis more accessible to non-analysts.
It is more analytics infrastructure than a campaign-specific tool.
Helpful for teams that want self-serve answers beyond dashboards.
Value depends heavily on how clean the underlying data is.
Costs can expand with scale and enterprise requirements.
Pricing: Public pricing starts at $50/user for Pro, with Enterprise pricing on request.
Good fit for: Teams that want more self-serve campaign analysis without relying only on dashboards.
25. Adobe Analytics
Adobe Analytics is an enterprise analytics platform known for advanced segmentation, customer journey analysis, and large-scale reporting. Strong option for when campaign analytics needs are complex and closely tied to broader Adobe workflows.
Powerful option for very complex enterprise reporting environments.
Pricing is custom rather than published as a simple public monthly figure.
Strong fit for organizations already standardized on Adobe.
Implementation is usually heavier than simpler campaign tools.
Good choice when teams need advanced analytical depth at scale.
It is generally better suited to larger budgets and specialized teams.
Pricing: Adobe Analytics uses custom pricing across solution packages, so buyers need a quote rather than a flat public rate.
Good fit for: Enterprise teams that need advanced segmentation and journey analysis at scale.
Features to look for in a campaign analytics tool
Not every tool gives you the same level of visibility. Some are better for reporting channel metrics, while others help you understand attribution, journeys, and revenue impact in more detail.
That is why feature depth matters. The best campaign analytics software helps you move past surface-level reporting and see what is actually shaping campaign performance.
A few features make the biggest difference:
Data-driven attribution: Uses actual conversion patterns to show how different touchpoints contribute to results.
Conversion tracking: Helps you measure the actions that matter, like signups, demos, purchases, or upgrades.
Customer journey visibility: Lets you see how people move across touchpoints before they convert.
Funnel analysis: Highlights where users drop off so you can improve campaign flow and landing page performance.
Real-time dashboards: Make it easier to spot performance shifts early and react before budget is wasted.
Event tracking: Reduces setup work and helps teams capture useful campaign data faster.
Multi-channel attribution: Helps you measure campaign impact across paid, organic, email, referral, and other channels.
Revenue attribution: Connects campaigns to pipeline, purchases, or revenue instead of stopping at clicks or leads.
The best marketing analytics tools do more than report on campaign activity. They help you understand what is working, what is underperforming, and what needs to change next.
And while evaluating campaign management software, analytics should not feel like a separate add-on. It should be built in closely enough to support better decisions while campaigns are still running.
Wrapping up
The difference between a campaign that scales and one that stalls is the ability to see exactly where your revenue is coming from.
When your campaign analytics give you that level of clarity, you stop managing budgets and start directing growth with total conviction.
Usermaven provides this control as a powerful marketing attribution tool. It maps the entire journey of every visitor by connecting each initial click to a confirmed signup. This replaces disconnected data with a complete timeline of every touchpoint. You can finally stop spending on traffic that goes nowhere and invest heavily in the specific campaigns that pay for themselves.
Ready to see the full story behind every conversion? Start a free trial or book a demo to see how Usermaven gives you a definitive, unified view of your campaign ROI.
FAQs about campaign analytics tools
1. What are the best campaign analytics tools for marketing teams?
The best campaign analytics tools for marketing teams are the ones that connect performance data with conversions, attribution, and customer journeys. Tools like Usermaven, Google Analytics, HubSpot, and Mixpanel stand out depending on whether your team needs simpler attribution, broader web analytics, CRM visibility, or deeper behavioral analysis.
2. What are the best offline-to-digital campaign analytics tools?
The best offline-to-digital campaign analytics tools are the ones that help connect calls, forms, CRM activity, and revenue back to campaigns. Ruler Analytics, HubSpot, and Dreamdata are strong options if you need to measure how offline touchpoints influence digital conversions.
3. Which campaign analytics platforms offer real-time data tracking?
Several campaign analytics platforms offer real-time or near real-time reporting, including Usermaven, Mixpanel, Matomo, and ThoughtSpot. These tools are useful when teams need to monitor campaign performance quickly and make faster optimization decisions.
4. What are the best campaign analytics tools for small businesses?
For small businesses, the best campaign analytics tools are usually the ones that balance clarity, useful reporting, and manageable pricing. Usermaven, Google Analytics, Plausible, and Zoho Analytics are solid options depending on whether you want attribution, free web analytics, simpler privacy-friendly reporting, or flexible dashboards.
5. Are there AI tools that combine content creation with campaign analytics?
Yes, but most tools do one side better than the other. Some platforms help with AI-powered insights, reporting, or optimization alongside campaign analytics, but you will often still need a separate tool for full content creation.
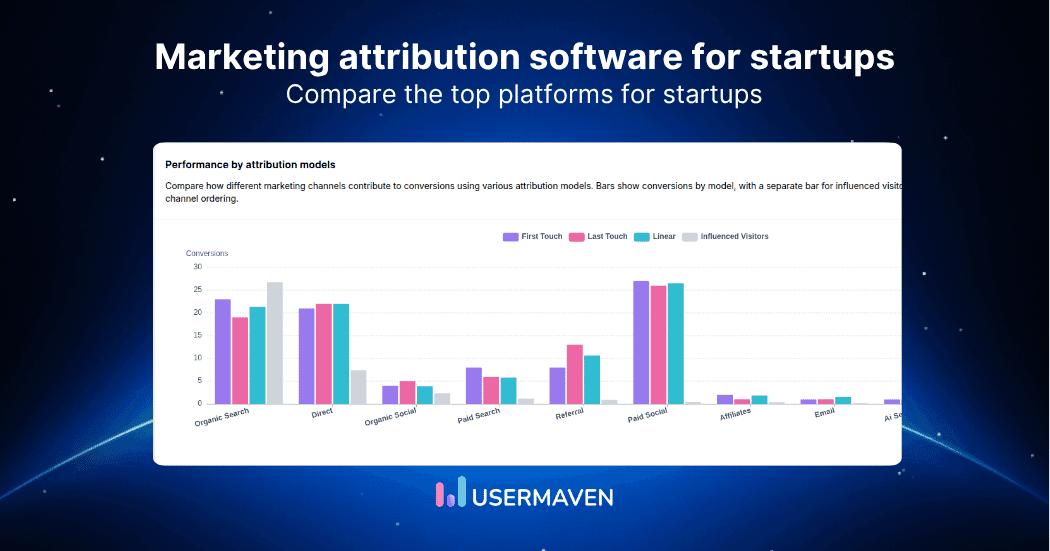
You are spending money on ads, content, and campaigns, but do you actually know which ones are driving revenue? For startups, where every dollar has to earn its keep, flying blind on marketing attribution is not just frustrating; it is expensive. Marketing attribution for startups has come a long way, but the sheer number of […]
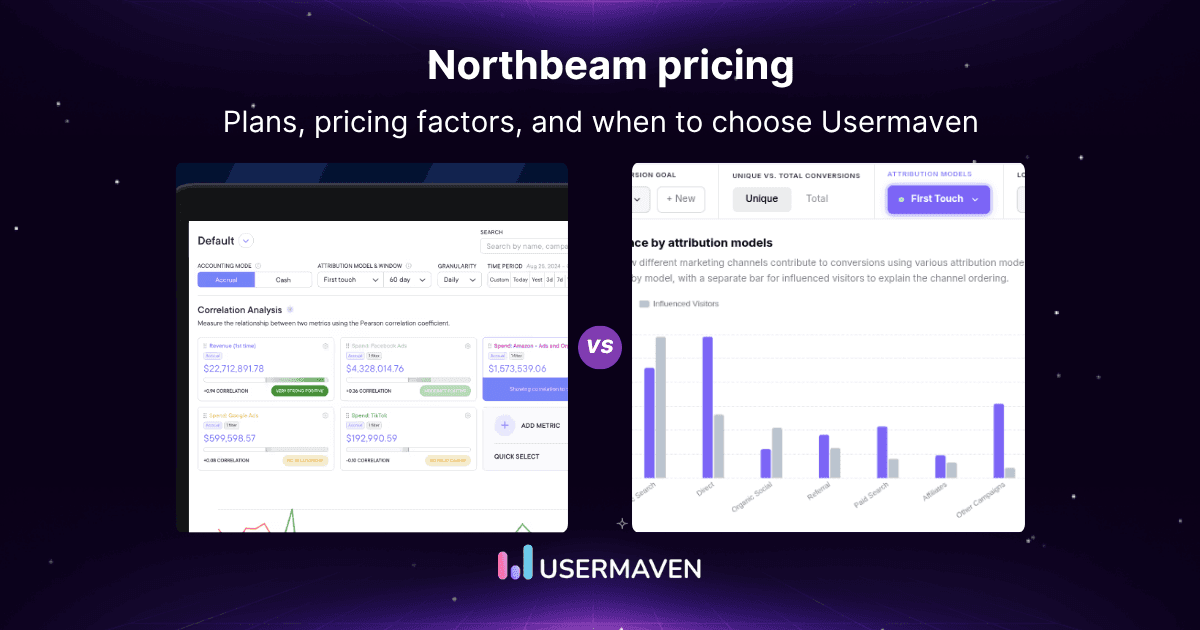
Finding clear Northbeam pricing information is tricky when the website shows just one number and everything else requires a sales call. Attribution expectations keep rising, but budgets rarely do. Northbeam publishes just one public price point. The Starter plan starts at $1,500 per month, while Professional and Enterprise plans require custom quotes. Each proposal depends on […]
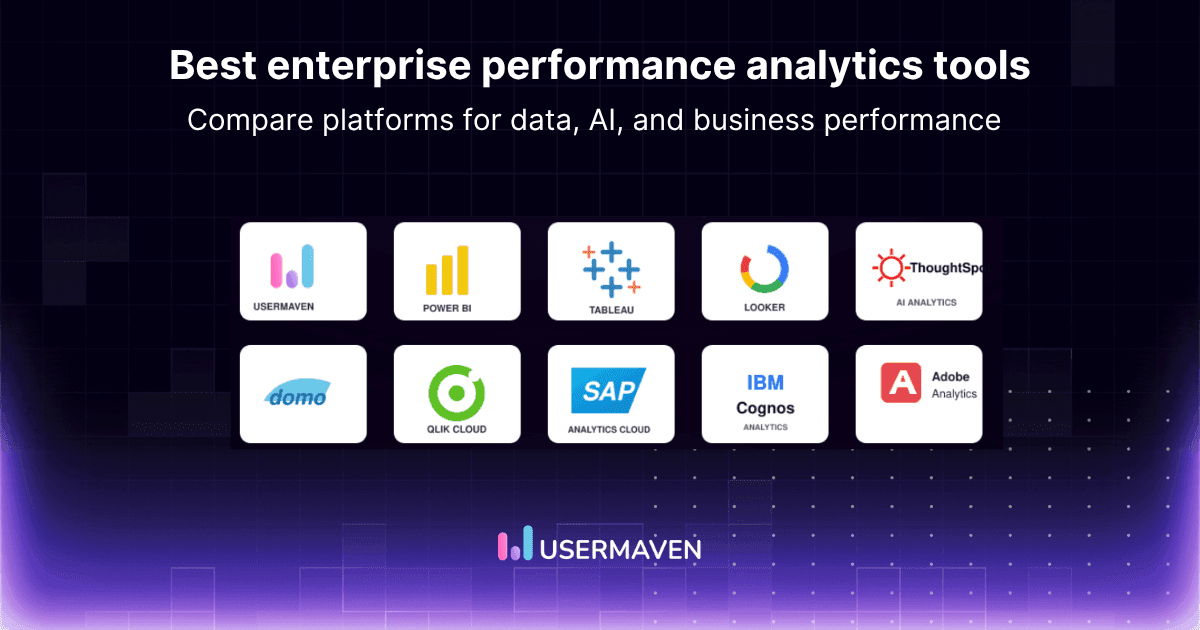
Enterprise data rarely sits in one system. Financial results may live in an ERP, customer activity in a CRM, product usage in separate software, and marketing data across several advertising platforms. Enterprise performance analytics tools connect these sources so leaders can monitor results, investigate changes, and make decisions from a more consistent view. A strong […]