Meta says ROAS is 5.1×. Google says its campaigns generated 140 conversions. LinkedIn reports influenced pipeline. Your CRM shows fewer paying customers than the platforms appear to claim. None of those reports necessarily has to be broken.
The systems are observing and calculating different things. Native ad dashboards have different ecosystem visibility, identity signals, attribution rules, modeled data, and access to downstream business outcomes.
The better approach is to understand what each reporting layer is qualified to answer. A consistent marketing attribution software layer can help compare observable cross-channel evidence, but it should complement native platforms, CRM data, and causal measurement rather than pretend one dashboard owns every truth.
Ad platform reporting limitations at a glance
Ad platform reporting limitations are the measurement boundaries that prevent native advertising dashboards from independently providing a complete, cross-channel view of customer journeys, business outcomes, and causal marketing impact.
A limitation is not the same as a broken report. Google, Meta, or LinkedIn can report correctly under their own methodology while still showing only part of the business picture.
| Question | Short answer |
|---|---|
| Are native ad reports inaccurate? | Not necessarily. They measure according to platform-specific data, identity, and attribution rules. |
| What are they best at? | Delivery, bidding, creative performance, and in-platform optimization. |
| What do they struggle with? | Cross-channel comparison, complete journeys, downstream customer value, and causality. |
| Why can two platforms claim one conversion? | Their eligibility rules and attribution windows can overlap. |
| Are modeled conversions fake? | No. They are modeled estimates used where direct observation is unavailable. |
| Can platform ROAS equal business ROAS? | Sometimes, but they are not automatically equivalent. |
| Can attribution prove causality? | No. Attribution assigns credit; causal measurement asks what would not have happened without the advertising. |
| Should native reports be discarded? | No. They remain essential for operating and optimizing each ad platform. |
| What complements them? | Independent analytics, business systems such as CRM or billing, and causal methods where needed. |
The useful question is not “Can I trust this dashboard?” It is “What decision is this dashboard qualified to support?”
Key takeaways
- Native reports have a defined job: They are strongest for delivery, bidding, creative analysis, and platform optimization.
- Visibility stops at ecosystem boundaries: No individual ad network naturally sees the complete independent buyer journey across every competing channel.
- Not every reported conversion is directly observed: Privacy, consent, and identity loss can lead platforms to use modeled measurement.
- Attribution is a rule, not the event itself: The same business conversion can receive different credit under different windows and models.
- Business outcomes often live elsewhere: Pipeline, refunds, renewals, customer value, and recorded revenue usually require CRM, commerce, billing, or product data.
- Reporting disagreement is not always an error: Two systems can produce valid but methodologically different numbers.
- Independent attribution also has limits: It can normalize observable cross-channel evidence but cannot recover every private platform signal.
- Attribution does not prove causality: Incrementality requires a separate causal measurement approach.
Five ad platform reporting limitations to know
Most native-reporting weaknesses fall into five boundaries. Separating them makes it easier to tell whether the problem is visibility, attribution logic, business context, or causal interpretation.
| Reporting boundary | What the platform cannot fully answer |
|---|---|
| Ecosystem | What happened across every competing marketing and sales channel? |
| Observability | What happened when an interaction or conversion could not be directly linked? |
| Attribution | How should every channel share credit under one common rule? |
| Business outcome | Did the campaign create valuable customers, pipeline, or durable revenue? |
| Causality | Would the outcome have happened without the advertising? |
1. Ecosystem boundary
Every major ad platform has excellent visibility into its own ecosystem. Google understands Google interactions, Meta understands Meta activity, and LinkedIn has its own engagement and identity context.
A buyer can still move through Meta impression → LinkedIn engagement → Google branded search → email → demo. Each advertising system sees a different slice of that path.
That is why cross-platform ad tracking needs a layer that can compare the observable activity across networks without assuming any one network sees the entire journey.
Boundary: Native reporting sees the buyer through the platform’s own window, not through a complete neutral view of every marketing interaction.
Unlock insights that drive growth
2. Observability boundary
Some customer activity cannot be linked directly because consent choices, browser controls, blocked identifiers, cross-device behavior, app-to-web transitions, or offline interactions reduce the observable trail.
That is why ad tracking without third-party cookies needs stronger first-party and business-outcome signals instead of assuming every advertising interaction will remain directly observable.
Google explains that conversion modeling is used when direct links between ad interactions and conversions cannot be observed. That can include gaps caused by cookies, consent, device identifiers, and cross-device journeys.
Modeled measurement is not automatically bad data. It is a different evidence type built from observed patterns and assumptions, which matters when marketers compare it with directly recorded CRM or commerce outcomes.
Boundary: A platform may estimate part of the path that it cannot observe directly, so the reported total can mix observed and modeled evidence.
3. Attribution boundary
Even when two systems observe the same underlying conversion, they can assign credit differently because the selected attribution window, view-through rules, identity logic, reporting dates, and attribution models do not match.
Those methodological differences explain many ad platform discrepancies, but the broader reporting limitation is that each platform defines credit from its own measurement perspective.
Boundary: The platform does not simply report that a conversion happened; it reports what happened according to its eligibility and credit rules.
4. Business-outcome boundary
Ad platforms are strongest near advertising activity: impression → click → tracked conversion. Businesses make many decisions farther downstream: qualified lead → opportunity → customer → revenue → retention → LTV.
A campaign can have a low CPA but poor CAC, a high CPL but strong Closed Won revenue, or impressive first-order ROAS while acquiring customers who rarely return.
That is why teams need marketing attribution metrics that connect platform activity with the commercial outcomes used to judge acquisition quality. Extending that analysis into revenue attribution helps show whether credited campaigns eventually create paying customers rather than only early conversions.
Boundary: Native advertising metrics become less sufficient as the decision moves farther downstream from the ad interaction.
5. Causality boundary
Attribution asks which recorded interaction should receive credit. Incrementality asks whether the conversion would have happened without the advertising.
A platform can correctly attribute a conversion under its rules without proving that the campaign caused additional demand. Holdouts, conversion-lift studies, geo experiments, and other causal methods are needed when the decision requires that answer.
Boundary: An attributed conversion is evidence of an eligible relationship, not proof of causal lift.
Where AI helps with ad reporting limitations
AI can reconcile metric definitions, surface unusual changes, compare platform performance, identify likely tracking gaps, summarize attribution-model differences, and investigate cross-channel journeys faster than manual dashboard work.
But AI cannot create an interaction that was never observed, access private platform signals that were never shared, turn attributed revenue into causal revenue, or repair missing CRM outcomes without better underlying data.
Useful rule: AI can investigate the available evidence faster; it does not remove the boundaries of the evidence itself.
What native ad platform reports are still best at
Native ad reporting remains indispensable. The mistake is not using platform dashboards; it is asking them to answer questions outside their measurement scope.
Delivery and pacing. Spend, impressions, clicks, reach, frequency, budget pacing, and delivery issues are native operational metrics.
Creative performance. CTR, engagement, format performance, and creative comparisons are most actionable inside the platform that serves the ads.
Bidding and audience optimization. Native algorithms use platform-specific signals that an external dashboard does not fully own.
Platform diagnostics. Rejected ads, learning status, budget constraints, delivery warnings, and conversion feedback are best handled where campaigns are operated.
Google also uses modeled conversion information within its measurement and optimization systems, illustrating why platform-native data can remain valuable even when part of the customer path is not directly observable.
Practical rule: Use native reports to operate the platform; use additional reporting layers to evaluate the business.
See what's working. Fix what's not. Grow faster.
Six conversion numbers marketers often confuse
Many reporting disputes start because teams compare numbers that sound similar but represent different measurement objects. Separating them makes the differences easier to interpret.
1. Observed conversion
A conversion event that was directly recorded and linked to measurable activity.
2. Modeled conversion
An estimated conversion link used where direct observation is unavailable and the platform has enough evidence to model the missing connection.
3. Platform-attributed conversion
A conversion that receives credit according to the ad platform’s own eligibility rules, identity logic, and attribution methodology.
4. Business conversion
The actual purchase, signup, paying customer, opportunity, or Closed Won event stored in the system used to operate the business.
5. Fractionally attributed conversion or revenue
A share of conversion or revenue credit distributed across measurable touchpoints under a cross-channel attribution model.
6. Incremental conversion
An outcome estimated to exist because advertising ran, usually through an experiment or another causal measurement method.
| Number | Directly observed? | Attribution-dependent? | Causal? |
|---|---|---|---|
| Observed conversion | Yes | Sometimes | No |
| Modeled conversion | No | Yes | No |
| Platform-attributed conversion | Observed and/or modeled | Yes | No |
| Business conversion | Yes in system of record | No | No |
| Fractional attribution | Based on measurable evidence | Yes | No |
| Incremental conversion | Estimated through causal method | Different methodology | Intended to estimate causality |
The key distinction: a modeled platform-attributed conversion and a CRM Closed Won deal are not two measurements of exactly the same thing.
Why Google, Meta, and LinkedIn can report differently
Different networks can report different conversion totals because they observe different signals and use different rules for views, clicks, attribution windows, identity, and reporting dates. Understanding Google Ads attribution and LinkedIn attribution makes those differences easier to interpret without assuming one platform is automatically wrong.
One buyer may see a Meta ad, engage with LinkedIn, click a Google ad, and later convert through email. More than one platform can be eligible to claim influence under its native rules.
That does not automatically mean the tracking is broken. It means a cross-platform comparison is combining systems with different methodologies.
The existing discrepancy workflow should handle the detailed reconciliation. This article focuses on the higher-level limitation: even perfectly configured native reports are not designed to produce one neutral cross-channel business view.
When a difference is normal vs. when tracking is broken
Structural methodology differences and implementation failures need different fixes. Treating every mismatch as a tracking bug wastes time; treating every mismatch as “normal” can hide genuine data loss.
| Difference | Usually structural or expected | Possible tracking failure |
|---|---|---|
| Platform conversions vs. CRM | Window, model, or outcome definition | Missing CRM sync or conversion mapping |
| Google vs. Meta credit | Overlapping attribution eligibility | Broken campaign parameters |
| Clicks vs. sessions | Page-load and session rules | Broken redirect or analytics tag |
| Browser vs. server events | Different collection paths | Bad event deduplication |
| Revenue difference | Refunds, tax, currency, timing | Wrong revenue/value mapping |
| Yesterday’s numbers changed | Reporting latency or model restatement | Delayed ingestion |
| Paid source appears as Direct | Channel-classification difference | Missing or stripped UTM |
| Conversions disappear entirely | Rarely expected | Event or tag failure |
A structured review of ad attribution problems helps separate missing data, duplicate events, identity breaks, and model differences before the team changes budget.
Consistent UTM parameters also reduce avoidable classification errors, especially when campaigns move through redirects, landing-page builders, or multiple teams.
Server-side tracking helps—but does not solve everything
Server-side tracking can improve event delivery, reduce some browser-side loss, confirm backend conversions, and give teams more control over the events sent to analytics and ad platforms.
A well-designed server-side tracking setup is valuable when collection quality is the problem. It does not create one universal attribution truth.
| Server-side tracking can improve | It does not solve by itself |
|---|---|
| Event delivery | Competing attribution windows |
| Browser-loss resilience | Different platform credit models |
| Backend-confirmed conversions | Walled-garden visibility |
| First-party control | Cross-channel attribution |
| Conversion reliability | Incrementality / causal measurement |
| Browser + server data quality | Consent and privacy obligations |
Which system should answer which reporting question?
There is no single dashboard that should own every marketing decision. A better reporting system assigns each question to the source that has the right data and methodology.
| Reporting question | Best primary system |
|---|---|
| Which creative should we pause? | Native ad platform |
| Is delivery pacing correctly? | Native ad platform |
| Which channel gets more budget across networks? | Independent cross-channel attribution |
| Which actual deals closed? | CRM |
| Which purchases occurred? | Commerce or billing system |
| Which campaigns created paying customers? | Attribution + business outcome data |
| Which sources acquire the highest-LTV customers? | Attribution + customer/revenue data |
| Did advertising cause additional conversions? | Experiment, lift study, or MMM where appropriate |
| Is the measurement setup complete enough to act on? | Data-health / measurement-quality layer |
The IAB’s 2026 Campaign Data Standards 1.0 were created to improve consistency and comparability across platforms, channels, and campaign systems—an industry-level signal that cross-channel measurement still needs shared definitions.
Better rule: there is no single source of truth for every marketing question. There should be one governed source for each decision type.
Native attribution vs. independent attribution
Native attribution and independent attribution are complementary. The strongest setup uses each where its visibility and rules are most useful.
| Capability | Native ad platform | Independent attribution |
|---|---|---|
| Platform delivery | Strong | Imported / secondary |
| Private in-platform signals | Strong | Limited |
| Cross-network comparison | Weak | Strong |
| Common attribution rules | No | Strong |
| Journey context | Platform-limited | Stronger across measurable channels |
| CRM / revenue integration | Varies | Strong when connected |
| Incrementality | Separate studies/tools | Attribution alone cannot provide it |
A multi-touch attribution layer is useful when the question becomes how Google, Meta, LinkedIn, organic, email, and other measurable touchpoints should share credit under one documented model.
Independent attribution still cannot independently observe every private platform impression, recover every missing identifier, or turn an attribution model into causal proof. Its advantage is governed cross-channel comparability, not omniscience.
How to build a reporting stack around these limitations
The goal is not to replace every dashboard with one new dashboard. It is to build a stack where each layer answers the question it is best equipped to answer.
- Define the decision first. Separate creative optimization, cross-channel budget allocation, executive revenue reporting, CAC analysis, and incrementality before choosing a report.
- Choose the business outcome. Use a consistent outcome such as purchase, signup, MQL, opportunity, Closed Won, or revenue instead of letting each platform define success differently.
- Keep native dashboards for platform operations. Continue using Google, Meta, LinkedIn, and Microsoft Ads for delivery, bidding, creative, and platform diagnostics.
- Standardize campaign tracking. Use governed source, medium, campaign, content, and click identifiers so external analytics can preserve campaign context.
- Build reliable first-party event collection. Capture the actions that matter on the website or product and confirm important business events from the backend where appropriate.
- Connect downstream business systems. Bring CRM, commerce, billing, payments, and offline outcomes into the analysis when the business question goes beyond the initial conversion.
- Apply one governed cross-channel attribution view. Document the attribution model, lookback, identity logic, conversion definition, and revenue source used for channel comparison.
- Add causal validation when the decision justifies it. Large brand or media investments may require holdouts, lift studies, geo tests, or MMM rather than relying on attribution alone.
Reliable first-party collection starts with the Events and conversion definitions that represent the actions the business actually wants to measure.
The stack works because each layer answers a different question instead of forcing one dashboard to answer them all.
What should cross-channel reporting software provide?
Software should reduce methodological inconsistency without hiding the differences between data sources. The goal is comparability, traceability, and connection to business outcomes.
| Capability | Why it matters |
|---|---|
| Multi-network spend data | Compare Google, Meta, LinkedIn, and Microsoft under one reporting layer. |
| First-party conversion tracking | Reduce dependence on platform-only conversion claims. |
| Shared conversion definitions | Compare equivalent outcomes across networks. |
| Multiple attribution models | Test whether a conclusion changes when credit rules change. |
| Journey visibility | Understand the measurable sequence before conversion. |
| CRM and revenue integration | Move beyond form fills into customers, pipeline, and revenue. |
| Flexible windows | Support delayed conversion and longer buying cycles. |
| Data-health diagnostics | Separate methodology differences from broken tracking. |
| Conversion sync | Return deeper business outcomes to ad platforms for optimization. |
| AI-assisted investigation | Speed up cross-channel analysis without inventing missing evidence. |
| Export / API / MCP access | Extend analysis into the tools teams already use. |
A dedicated paid ads attribution layer should connect spend with attributed conversions, conversion value, and revenue rather than simply reproduce each network’s native dashboard.
How Usermaven works around reporting boundaries
Usermaven is an AI marketing attribution platform designed to complement the operational role of Google Ads, Meta Ads, LinkedIn Ads, and Microsoft Ads rather than replace their native dashboards.
It adds a governed cross-channel view that connects paid media spend with measurable customer journeys, conversions, and downstream business outcomes so platform optimization and business reporting can use different but connected layers.
Compare paid networks under one measurement layer
Paid Ads Attribution brings Google, Meta, LinkedIn, and Microsoft Ads into one view with spend, impressions, clicks, influenced and attributed conversions, conversion value, and ROAS.
That makes it possible to compare paid networks under the same selected attribution framework instead of adding together platform-reported totals that were calculated under different rules.
Separate conversion-date from spend-date questions
Usermaven supports two Paid Ads Attribution modes because “What converted this month?” and “What did this month’s spend eventually create?” are different reporting questions.
By Conversion Date starts with conversions in the selected period and looks backward for eligible paid interactions. By Spend Date starts with clicks from the spend period and looks forward for conversions within the chosen look-ahead window.
This distinction is useful when delayed conversions make recent spend look weak before the full conversion cycle has completed.
Bring business outcomes into the reporting layer
Event Sources can bring supported CRM, payment, webinar, CSV, webhook, and other off-site events into Usermaven as native events that can participate in attribution and customer journeys.
For marketing teams, this makes it easier to extend analysis from ad click → lead → opportunity → payment or revenue instead of stopping at the first website conversion.
Separate broken tracking from methodology differences
The Measurement Trust Center checks campaign tracking, customer matching, connected platforms, conversion feedback, and data confidence so teams can tell whether a result is limited by methodology or damaged by an avoidable setup problem.
The broader Trust Center framework also organizes health across Collection, Identity, Integrations, Delivery, and Reliability, with report-readiness guidance and prioritized fixes.
Important distinction: a platform-methodology difference does not need the same fix as a missing campaign parameter or broken CRM connection.
Apply one cross-channel attribution methodology
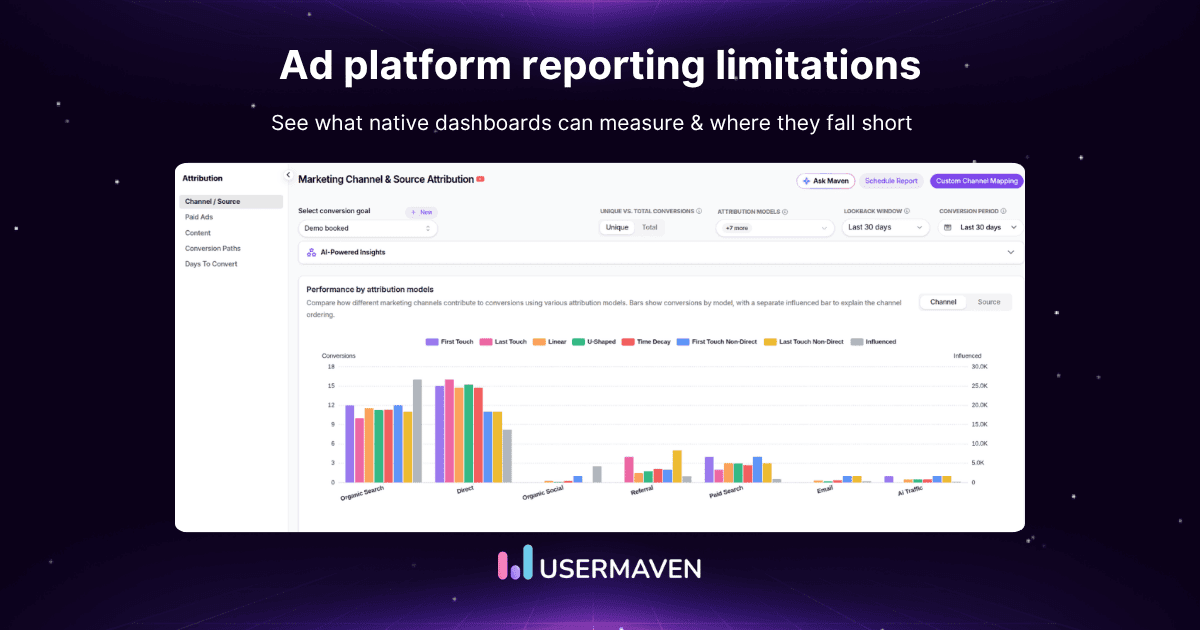
Usermaven’s built-in models let teams compare first touch, last touch, linear, U-shaped, time decay, and non-direct perspectives across the same observable journey.
Enterprise workspaces can also create custom attribution models with named first/middle/last splits and channel-specific adjustments. The September 2026 release added automatic versioning so model changes do not silently rewrite the historical logic used by existing reports.
Caveat: a consistent attribution model improves comparability. It does not make attribution causal truth.
Send deeper outcomes back to ad platforms
Independent reporting and native optimization can reinforce each other. Usermaven can send supported conversion and revenue events back to Google Ads and Meta when the required identifiers are available.
That lets the business use a governed cross-channel view for budget analysis while the ad platform receives stronger downstream signals for bidding and optimization.
Investigate reporting gaps with Maven AI
Maven AI can investigate questions such as why Meta ROAS increased while CRM revenue stayed flat, which paid campaigns generated paying customers, or where the gap between conversion volume and revenue is largest.
The September 2026 update also added faster streaming, concurrent conversations, and richer interactive funnel visualizations, making AI analysis more useful for ongoing measurement work.
Query connected analytics through MCP
The Usermaven MCP connection lets teams query authorized workspace analytics through compatible clients including ChatGPT, Claude, Claude Code, Cursor, and Codex.
MCP can make investigation easier inside existing AI workflows, but it remains bound by the data and permissions available in the workspace. It does not create missing platform evidence.
First-party evidence: ContentStudio
ContentStudio is a useful example because its paid-media problem was not a lack of clicks or cost data. Google Ads and Meta Ads already provided platform performance metrics.
The missing layer was whether campaigns actually produced signups, demo bookings, upgrades, paying customers, and revenue. ContentStudio also tested LinkedIn and X, which made cross-channel budget allocation even harder when each platform was viewed in isolation.
After connecting paid acquisition with downstream outcomes, the ContentStudio case study reports a 30% improvement in ROAS, 128% growth in signups, 92% more plan upgrades, and 242% more demo bookings.
The team also found that some conversions arrived 7–14 days after the original ad click. Campaigns that initially looked weak became profitable once the full conversion timeline was visible.
The lesson is not that native ad dashboards were “wrong.” They measured advertising activity. The additional reporting layer answered the downstream business-value question those dashboards could not answer alone.
Ad platform reporting limitations checklist
- Decision: What question is the report being used to answer?
- Scope: Does the system observe only its own ecosystem?
- Evidence: Are reported conversions observed, modeled, or both?
- Definition: Is every system counting the same business action?
- Window: Are attribution windows materially different?
- Views: Are view-through conversions included?
- Identity: Can customer activity be connected across sessions or devices?
- Revenue: Is downstream revenue coming from the actual business system?
- Latency: Could recent numbers still be restating or arriving late?
- Tracking: Are campaign parameters and events complete?
- Cross-channel: Is every network being compared under one documented methodology?
- Quality: Does reporting extend beyond leads to customer and revenue value?
- Causality: Is attribution being mistaken for incremental impact?
Final verdict
Native ad reports remain essential because they provide the platform-specific signals needed for delivery, bidding, creative analysis, and campaign optimization.
Their limitation is scope. No single advertising dashboard independently provides complete visibility into cross-channel journeys, downstream customer value, and causal impact.
The strongest reporting stack therefore combines native platform data → first-party measurement → cross-channel attribution → business outcomes → causal validation when the decision requires it.
Ready to see Usermaven in action? Explore the platform or book a demo for a closer look.
FAQs
1. What are the main limitations of ad platform reporting?
The main limitations are ecosystem visibility, incomplete observability, platform-specific attribution rules, limited downstream business context, and the inability of attribution alone to prove causality. These boundaries can exist even when the platform report itself is working correctly.
2. Can you trust Google Ads, Meta Ads, and LinkedIn reports?
Yes, when they are used for the questions their methodology is designed to answer. Native reports are strong for platform delivery, creative, bidding, and platform-attributed outcomes. They should not automatically be treated as a universal cross-channel or revenue source of truth.
3. Why do ad platforms report different conversion numbers?
Platforms can use different click and view windows, identities, conversion definitions, reporting dates, and attribution models. More than one platform can also be eligible to claim the same business conversion under its native rules.
4. What are modeled conversions?
Modeled conversions are estimated links or outcomes used when direct observation is unavailable. Platforms may use observed data and statistical models to estimate missing conversion relationships caused by privacy, consent, identity, or cross-device gaps.
5. Are platform-reported and CRM conversions the same?
No. Platform conversions are credited under advertising-platform rules, while a CRM records operational business events such as leads, opportunities, or Closed Won deals. The two systems can legitimately count or classify outcomes differently.
6. Does server-side tracking fix ad reporting limitations?
Updated

Written by
Ryan Mitchell
Marketing Analytics Strategist
Ryan Mitchell is a marketing analytics strategist specializing in campaign measurement, customer journeys, and marketing performance. He writes about analytics, reporting, and data-driven marketing strategies, helping SaaS and B2B teams measure what matters across every stage of the customer journey.
All articles by Ryan →