An ad campaign can look wasteful for very different reasons. The audience may be wrong, the creative may be tired, the landing page may leak conversions, or the campaign may simply need more time before revenue appears.
The dangerous mistake is treating every weak-looking campaign as the same problem. Cutting spend before identifying the leak can remove campaigns that are working, while leaving the real source of waste untouched.
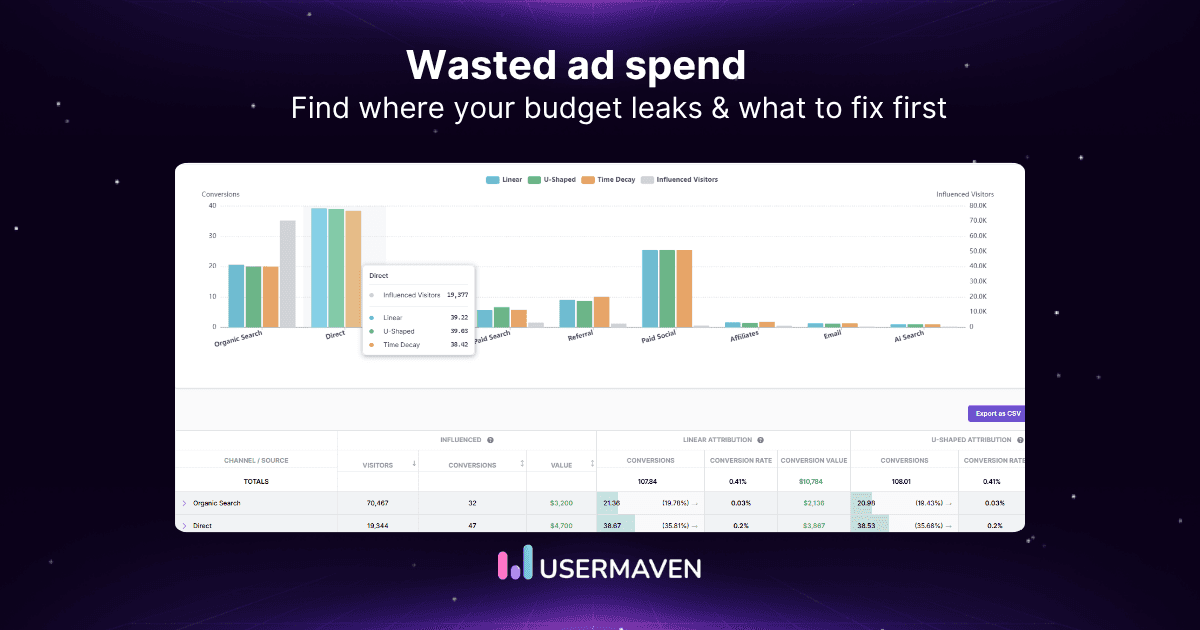
With marketing attribution software, teams can connect ad spend with post-click behavior, customer quality, conversion timing, and revenue. This guide shows how to tell whether spend is actually wasted, misallocated, or only appears weak because measurement is incomplete.
Key takeaways
- Wasted ad spend is a diagnosis problem. The same weak result can come from targeting, creative, funnel friction, measurement, or budget allocation.
- Cheap conversions can still be expensive. CPL or CPA only matters when those conversions become qualified customers and revenue.
- Platform reports are not a deduplicated business ledger. Google, Meta, LinkedIn, and Microsoft can each assign credit using different rules.
- Conversion lag can make profitable spend look weak. Judge campaigns over the buying cycle instead of only the first few days.
- Fix measurement before reallocating budget. Broken identity, missing CRM outcomes, or duplicated events can make good and bad campaigns look alike.
Wasted ad spend at a glance
Wasted ad spend is advertising investment that fails to create enough useful business value relative to its cost, whether because of poor targeting, weak creative, funnel friction, broken measurement, or inefficient budget allocation.
| Type | What is happening |
|---|---|
| Actual waste | Spend produces little or no useful outcome. |
| Misallocated spend | The campaign creates value, but the budget could produce stronger returns elsewhere. |
| Apparent waste | The campaign looks weak because conversions are delayed or attribution is incomplete. |
| Before cutting spend, determine which type of waste you are actually dealing with. |
Where wasted ad spend usually comes from
Most ad-spend problems can be located in one of five layers. Starting with the layer makes troubleshooting faster than changing bids, audiences, and creatives at the same time.
| Layer | Common problem | What to inspect |
|---|---|---|
| Audience | Wrong people see the ad | Demographics, geography, qualification |
| Creative | Clicks arrive without enough intent | CTR, frequency, downstream conversion |
| Post-click | The ad works but the funnel leaks | Landing page, forms, funnels |
| Measurement | Good or bad spend is classified incorrectly | Tracking, identity, attribution |
| Budget allocation | Spend follows cheap metrics instead of value | Pipeline, CAC, revenue, ROAS |
Unlock insights that drive growth
1. Targeting the wrong audience
Targeting becomes waste when the campaign pays for attention from people who are unlikely to become valuable customers. The problem can come from an audience that is too broad, an ICP mismatch, missing exclusions, wrong geography, automated expansion beyond intended buyers, or repeatedly advertising to customers who should be excluded.
The important test is not whether the traffic is cheap. It is whether the people arriving from the campaign resemble the customers the business is trying to acquire.
How to diagnose it
Compare who clicks with who becomes qualified and who ultimately becomes a customer. A large drop between those groups is often more informative than a low CPC.
- Job or company fit
- Geography and market fit
- Lead quality
- Opportunity rate
- Customer conversion
| Cheap clicks from the wrong buyer are still expensive traffic. |
2. Letting creative fatigue drain performance
Creative waste is not limited to low CTR. An ad can keep attracting clicks after the message has stopped attracting the right kind of buyer. Repeated exposure, stale offers, weak variation, or click-heavy creative can all consume spend without improving downstream value.
A campaign where CTR rises and CPC falls while qualified conversion declines is not necessarily improving. The creative may simply be getting better at generating curiosity rather than intent.
Diagnose creative waste
- Frequency rises while CTR falls
- One creative takes most delivery for too long
- Landing-page behavior gets weaker
- Qualified conversion falls despite cheaper traffic
- The same message is reused across audience stages
Fix it
Test materially different concepts rather than cosmetic edits. Useful variants include problem-led, proof-led, product-led, customer-result, founder or expert, and offer-focused creative. Change one major hypothesis at a time so the team can tell what caused the result.
3. Sending clicks into a leaking funnel
Sometimes the ad is doing its job and the website is wasting the traffic. A campaign can attract the right buyer, only for the landing page, form, signup flow, or sales handoff to create the real loss.
| Ad -> landing page -> form -> signup or demo -> qualification or activation -> customer |
| Symptom | Likely issue |
|---|---|
| Low CTR | Creative, message, or targeting |
| Strong CTR + high bounce | Ad-to-page mismatch or weak traffic quality |
| Good visits + few form starts | Offer or landing-page friction |
| Many form starts + few submits | Form friction |
| Many leads + few qualified leads | Audience or qualification problem |
| Qualified leads + little revenue | Sales fit or downstream funnel |
4. Optimizing for cheap conversions
Conversion volume can make weak acquisition look efficient. If the chosen goal stops at a form fill or signup, the campaign may optimize toward people who complete that action cheaply rather than people who become customers.
| Campaign | CPL | Leads | Customers | Revenue |
|---|---|---|---|---|
| A | $50 | 100 | 2 | $5K |
| B | $120 | 45 | 15 | $42K |
Campaign A looks stronger in a lead-generation dashboard because it produces more leads at a lower CPL. Campaign B costs more per lead but creates far more customers and revenue.
The useful progression is CPC -> CPL -> qualified lead -> opportunity -> customer -> revenue. The metric closest to the business outcome should have the most influence over the budget decision.
| The cheapest lead can still be the most expensive customer acquisition strategy. |
5. Broken tracking creates bad budget decisions
Tracking problems do not always waste budget immediately. They make the next budget decision less reliable, which can send more money toward weak campaigns and cut spend from strong ones.
- Broken or inconsistent UTMs
- Missing ad identifiers
- Duplicated conversion events
- CRM outcomes disconnected from acquisition
- Anonymous and known journeys split into separate profiles
- Off-site sales missing from analytics
- Incomplete or inconsistent revenue values
For a deeper diagnostic, the ad attribution problems guide covers common attribution failures without turning this article into a tracking implementation manual.
Google also notes that correctly configured conversion actions are critical because automated bidding relies on those signals. See the official Google Ads conversion measurement guidance for the platform-specific setup.
LinkedIn similarly recommends stronger conversion data, dynamic values, and multiple sources where appropriate. Its conversion optimization best practices explain how richer signals can improve campaign measurement and optimization.
| Bad measurement does not necessarily create wasted spend directly. It creates bad budget decisions, which then create waste. |
6. Trusting each platform revenue total in isolation
Native ad dashboards are valuable, but they are not a single deduplicated revenue ledger. Each platform measures performance using its own identity signals, attribution window, click and view rules, and model.
| Meta claims the conversion -> Google claims the conversion -> CRM contains one customer |
That does not automatically mean one platform is wrong. It means the reports answer different attribution questions. The mistake is adding platform-reported revenue together and treating the result as one business total.
If the numbers disagree, start with ad platform discrepancies, then review the broader limits of native ad reporting. For the full measurement architecture, use the dedicated cross-platform ad tracking guide.
| Platform attribution is useful for platform optimization. Cross-channel attribution is needed for consistent budget comparison. |
See what's working. Fix what's not. Grow faster.
7. Cutting campaigns before conversions mature
Spend happens immediately. Revenue often does not. For higher-consideration products, the buyer may click today and convert 7, 14, 30, or more days later. Judging the campaign only from early conversions can make profitable spend look wasteful.
By Conversion Date
This view starts with conversions in the reporting period and asks which earlier ad interactions influenced them. It is useful for understanding what converted now.
By Spend Date
This view starts with ad spend and clicks from the selected period, then follows those interactions forward through a look-ahead window. It answers what that period of budget eventually produced.
| Spend Date vs. Conversion Date answers two different questions. Both matter when conversions are delayed. |
Usermaven supports both views in Paid Ads Attribution. By Spend Date is especially useful when a team wants to evaluate a historical budget cohort after giving customers enough time to convert.
| Do not call spend waste before the conversion cycle has matured. |
8. Assuming credited revenue is always incremental
Branded search and retargeting can show strong attributed performance because they often appear when buyers already have intent. That does not make those campaigns wasteful, but it does mean attributed revenue should not automatically be interpreted as revenue caused by the campaign.
Attribution asks
Which observed touchpoint should receive credit for the conversion?
Incrementality asks
Would the customer have converted if the campaign had not run?
The distinction matters most when a team is deciding whether to keep, reduce, or expand spend. The incremental revenue attribution guide explains the causal question in more depth.
9. Ignoring lead and customer quality
A campaign can generate cheap leads and still waste budget if those leads do not become qualified opportunities, activated users, paying customers, or retained accounts. Efficiency changes as measurement moves down the funnel.
| Metric | What it tells you |
|---|---|
| CPC | Cost to acquire traffic |
| CPL | Cost to acquire a lead |
| Cost per qualified lead | Cost to acquire relevant demand |
| Cost per opportunity | Cost to create pipeline |
| CAC | Cost to acquire a customer |
| ROAS | Revenue relative to ad spend |
The ad performance metrics guide can help teams separate media metrics from downstream business metrics instead of treating every conversion as equal.
| A campaign is not efficient simply because the earliest measurable conversion is cheap. |
10. Spreading budget evenly across unequal channels
Budgets often stay evenly distributed because every platform reports conversions, the CPL looks acceptable, or nobody can prove what should change. Equal allocation feels neutral, but channels rarely produce equal customer economics.
Google, Meta, LinkedIn, and Microsoft should not receive equal budgets simply because all four create leads. Compare cost per qualified lead, cost per opportunity, customer conversion, attributed revenue, ROAS, and conversion lag.
A reduce CAC workflow looks for channels that acquire valuable customers more efficiently, while an improve ROAS workflow focuses on the return generated from the spend already being deployed.
| Budget allocation should follow customer economics, not platform symmetry. |
How to audit wasted ad spend
A useful audit moves from measurement to traffic quality to customer economics. Do not begin by turning campaigns off. Begin by proving which layer is leaking.
Phase 1: Verify measurement
- Conversion tracking
- UTMs and ad IDs
- Duplicate events
- CRM integration
- Revenue and off-site events
Phase 2: Audit traffic quality
- Audience and ICP fit
- Geography
- Search terms or placements
- Exclusions
- Lead quality
Phase 3: Audit creative and landing pages
- Creative fatigue
- Message match
- Bounce and drop-off
- Form completion
- Offer clarity
Phase 4: Audit customer quality
- Qualified-lead rate
- Opportunity rate
- Activation or paid conversion
- Retention
- Revenue
Phase 5: Audit attribution and timing
- Platform overlap
- Attribution model
- Attribution window
- Conversion lag
- Incrementality where the decision requires causal evidence
| Do not start by turning campaigns off. Start by proving where the leak actually is. |
Wasted ad spend diagnostic table
| Symptom | Possible cause | What to inspect |
|---|---|---|
| CPC rising | Competition, targeting, relevance | Campaign data |
| CTR falling | Creative fatigue | Creative and frequency |
| Good CTR, weak conversions | Page or traffic problem | Funnel |
| Cheap leads, weak pipeline | Poor targeting or qualification | CRM |
| High platform ROAS, weak revenue | Attribution mismatch | Independent attribution |
| New campaign looks unprofitable | Conversion lag | Spend-date reporting |
| Direct gets most conversions | Earlier acquisition may be hidden | Journeys |
| Several platforms claim one sale | Attribution overlap | Cross-channel report |
How Usermaven finds where ad spend is leaking
Usermaven helps teams diagnose whether paid media problems come from tracking, traffic quality, funnel behavior, delayed conversions, attribution, or downstream customer economics. It does not replace the ad platforms. It adds the independent measurement layer needed to decide which campaigns deserve more budget.
Verify data quality first
The Measurement Trust Center checks campaign tracking, customer matching, connected platforms, conversion feedback, and data confidence before teams act on performance reports.
Compare paid channels consistently
With Paid Ads Attribution, Google, Meta, LinkedIn, and Microsoft Ads can be compared using spend, clicks, conversions, conversion value, attributed revenue, and ROAS under one measurement framework.
Compare Spend Date vs. Conversion Date
Conversion Date helps explain what converted during a reporting period. Spend Date helps evaluate what a historical period of ad spend eventually produced after a look-ahead window. The distinction prevents delayed revenue from being mistaken for immediate waste.
Find funnel leaks after the click
A paid campaign can be doing its job while the website wastes the acquired traffic. Funnels can reveal the step where users drop, while Form Tracking shows how submissions become leads. User Journeys makes it possible to inspect the sequence behind individual conversions instead of relying only on aggregate rates.
Bring actual business outcomes into analysis
Usermaven Event Sources can bring supported CRM, payment, webinar, webhook, CSV, and other off-site conversions into the same event stream. That lets campaigns be evaluated against Closed Won deals, payments, subscriptions, or other outcomes that happen after the website session.
For sales-led teams, downstream CRM outcomes from systems such as HubSpot or Salesforce can help distinguish campaigns that create leads from campaigns that create opportunities and revenue.
Build metrics around actual economics
Paid Ads Attribution supports custom calculated metrics, which can be used for business-specific measures such as cost per qualified lead, cost per opportunity, revenue per conversion, or paid-media CAC. The February 2026 release added these custom metrics alongside improved Form Tracking.
Investigate waste with Maven AI
With Maven AI, teams can ask which paid campaigns increased spend but lost conversion value, which campaigns create cheap leads but weak customer conversion, where paid visitors drop out, or which campaigns have the longest conversion lag. The September 2026 update also added faster streaming, concurrent conversations, visible activity steps, and interactive funnel results.
Use MCP for external AI workflows
Teams that already work in ChatGPT, Claude, Cursor, Codex, or other compatible AI clients can also query Usermaven campaign and attribution data through MCP. Keep this as an analysis convenience rather than a substitute for reliable tracking underneath the data.
Evidence: ContentStudio stopped guessing where to spend
This case does not prove one ad network is universally better than another. It shows why each company needs its own downstream customer and revenue evidence before deciding that spend is wasteful.
In the ContentStudio case study, the SaaS team ran Google and Meta campaigns while also testing LinkedIn and X. Platform dashboards showed clicks and conversions but could not reliably confirm which campaigns produced paying users or revenue.
| Reported outcome | Result |
|---|---|
| Signups | +128% |
| Plan upgrades | +92% |
| Demo bookings | +242% |
| Traffic | +329% |
| Overall ROAS | +30% |
The team found that some paid conversions completed 7 to 14 days after the original click. That prevented campaigns from being cut simply because the first week looked weak. Funnel analysis also exposed friction after paid traffic had already been acquired, helping the team improve the demo-booking path.
Channel contribution and cost-per-paying-customer analysis showed stronger economics in ContentStudio’s own Google and Meta programs than in its LinkedIn and X tests. Budget was then concentrated where the company could confirm revenue contribution rather than being spread evenly across channels.
| Waste was determined from paying-customer economics, not from clicks, CPL, or instinct. |
What not to call wasted ad spend
Not every uncomfortable metric is proof of waste. Treat these as diagnostic signals rather than automatic reasons to stop a campaign:
- CPC increased
- CPL increased
- Conversions take longer
- A channel is stronger at first touch than last touch
- Branded search receives substantial credit
- A retargeting campaign looks expensive
- An ad platform reports a different conversion total than independent analytics
| Prove whether the campaign creates enough downstream value before labeling the spend waste. |
Wasted ad spend checklist
| Check | Question |
|---|---|
| Targeting | Are the right people seeing the ads? |
| Geography | Is spend going to intended markets? |
| Exclusions | Are irrelevant users or current customers excluded where appropriate? |
| Creative | Is fatigue or poor relevance visible? |
| Landing page | Does the page match the ad promise? |
| Forms | Where do users abandon? |
| Lead quality | Do leads become qualified? |
| Pipeline | Do campaigns create opportunities? |
| Revenue | Do those opportunities become customers? |
| Tracking | Are conversions firing correctly? |
| Identity | Are anonymous and known journeys connected? |
| CRM | Are downstream outcomes available? |
| Attribution | Are channels compared under consistent rules? |
| Conversion lag | Has enough time passed? |
| Incrementality | Could some credited conversions have happened anyway? |
| Budget allocation | Does spend follow customer economics? |
Final verdict
Wasted ad spend is not one problem. It can come from audience, creative, funnel, measurement, or budget allocation, and each layer requires a different fix.
The most expensive mistake is making budget cuts from incomplete evidence. Cheap leads can be low quality, expensive leads can become valuable customers, and apparently weak campaigns can still produce delayed revenue.
The strongest ad-spend decisions connect platform performance with post-click behavior, customer quality, attribution, and revenue before money is moved.
Book a Usermaven demo to see which campaigns create qualified customers and revenue, and where paid budget is leaking across the journey.
FAQs
1. What is wasted ad spend?
Wasted ad spend is advertising investment that does not create enough useful business value relative to its cost. The cause may be poor targeting, weak creative, funnel friction, broken measurement, or inefficient budget allocation.
2. What causes wasted ad spend?
The most common causes are targeting the wrong audience, creative fatigue, post-click funnel leaks, optimizing for cheap but low-value conversions, broken tracking, duplicated platform credit, conversion lag, poor lead quality, and budget allocated without downstream evidence.
3. How can I tell if an ad campaign is wasting money?
Do not judge from one metric. Compare traffic quality, conversion behavior, qualified outcomes, customer conversion, attributed revenue, ROAS, and conversion lag. A campaign is more likely to be wasteful when weak downstream value persists after measurement and timing issues are ruled out.
4. Is a high CPC a sign of wasted ad spend?
Not by itself. A high CPC can still be efficient if the traffic converts into valuable customers. A lower CPC can be worse when the campaign attracts cheap traffic that rarely qualifies or buys.
5. Can low CPL campaigns still waste money?
Yes. Low CPL only shows that leads are inexpensive. If those leads rarely qualify, become opportunities, activate, or purchase, the campaign can still have poor customer economics.
6. How does bad tracking cause wasted ad spend?
Bad tracking makes optimization and budget decisions unreliable. Missing campaign identifiers, duplicated conversions, disconnected CRM outcomes, or incomplete revenue can make weak campaigns look strong and strong campaigns look weak.

Written by
Adeel Khan
Growth Marketing Expert
Adeel Khan is a full-stack SaaS marketer with 10+ years of experience in content marketing, paid advertising, analytics, and conversion rate optimization. He shares practical insights and strategies drawn from hands-on experience, helping B2B SaaS marketers improve performance and make better marketing decisions.
All articles by Adeel →