Meta reports $500,000 in attributed revenue. The CRM confirms that those customers purchased. But how much of that revenue would still have happened if the ads had never run?
That is the difference between attribution and incrementality. Attribution explains which observed marketing interactions receive credit. Incrementality asks what additional business outcome marketing actually caused compared with a credible no-marketing baseline.
This guide explains incremental revenue attribution, counterfactuals, iROAS, lift tests, Meta’s incremental measurement options, and where always-on marketing attribution software fits. The goal is not to replace attribution with experimentation. It is to understand when each measurement method can support a better revenue decision.
Incremental revenue attribution at a glance
Incremental revenue attribution connects a marketing activity with the additional revenue estimated to have occurred because of that activity, above what would likely have happened without it.
The word “attribution” needs care here. Traditional attribution distributes credit across observed interactions. Incremental measurement requires a counterfactual: an estimate of what the same audience or market would have done without the marketing intervention.
| Question | Short answer |
|---|---|
| What is incremental revenue? | Revenue above the estimated no-marketing baseline |
| What is incremental attribution? | Measurement focused on causal lift rather than observed credit alone |
| Is attributed revenue incremental? | Not necessarily |
| What is a counterfactual? | The estimated outcome if the marketing activity had not happened |
| How is incrementality measured? | Holdouts, lift studies, geo tests, switchbacks, or causal models |
| What is iROAS? | Incremental revenue divided by ad spend |
| Can ordinary attribution prove causality? | No |
| Can AI attribution prove incrementality? | Not automatically |
| Is Meta Incremental Attribution the same as Conversion Lift? | No |
| Best operating approach | Use attribution continuously and incrementality periodically |
Key takeaways
- Attributed revenue is not automatically incremental revenue. A campaign can receive credit for a purchase that would have happened anyway.
- Incrementality depends on a counterfactual. The central question is what revenue would exist without the marketing activity.
- Treatment and control groups provide stronger causal evidence. Randomized lift tests are especially useful when the budget decision is large.
- iROAS can be far lower than platform-reported ROAS. The two metrics answer different questions.
- Retargeting and branded search are strong candidates for incrementality testing. Both can capture demand that already existed.
- AI-powered and custom attribution remain attribution unless they estimate causality through a defensible method.
- Attribution and incrementality are complementary. Attribution supports continuous optimization, while incrementality validates high-stakes assumptions periodically.
- Usermaven provides the always-on attribution and revenue measurement layer. Randomized incrementality testing remains a separate measurement method.
What is incremental revenue attribution?
Revenue attribution asks:
Which recorded marketing interactions should receive credit for this revenue?
Incrementality asks:
How much of this revenue would disappear if the marketing activity had not happened?
That distinction matters because observation alone cannot establish causality.
A customer might see a Meta retargeting ad shortly before purchasing. A last-touch attribution model can credit Meta with the sale. A multi-touch model can divide credit across Meta, organic search, email, and other interactions.
Neither model proves that Meta created additional revenue.
A simple way to express incrementality is:
Observed outcome – Counterfactual outcome = Incremental effect
The counterfactual is the estimated outcome under the no-treatment condition.
This is why revenue attribution and incremental revenue should not be treated as interchangeable concepts.
A channel can receive $500,000 in attributed revenue while producing much less causal lift if many of those customers were already likely to buy.
Unlock insights that drive growth
Where AI helps incremental revenue analysis
AI can make incremental measurement easier to investigate, but it does not remove the need for a valid causal design.
It can help identify campaigns with unusually high attributed credit, compare model sensitivity, surface channels where CRM revenue disagrees with ad-platform ROAS, summarize experiment results, and detect segments with different response patterns.
Claims about incremental revenue from AI-powered attribution need more scrutiny.
A machine-learning system can estimate conversion probabilities, assign credit, classify journeys, or predict customer value. Those are useful capabilities, but they do not automatically tell the business what would have happened without the intervention.
A causal interpretation requires either a defensible experimental design or a model that explicitly estimates a counterfactual and has been appropriately validated.
AI can analyze a counterfactual design. It cannot create a valid counterfactual merely by labeling an attribution model AI-powered.
Attribution vs incrementality
Attribution and incrementality are often presented as competing methods.
They are better understood as different layers of measurement.
Current 2026 guidance on attribution vs incrementality increasingly treats attribution as the continuous operating system for understanding customer journeys and incrementality as the validation layer for major budget decisions.
| Attribution | Incrementality | |
|---|---|---|
| Main question | Which interactions receive credit? | What happened because marketing ran? |
| Evidence | Observed customer journeys | Treatment compared with counterfactual |
| Typical methods | First touch, last touch, MTA, custom | Holdout, lift test, geo experiment |
| Granularity | Often high | Usually lower |
| Frequency | Continuous | Periodic |
| Causal? | No | Designed to estimate causality |
| Best use | Campaign and journey optimization | High-stakes budget validation |
A multi-touch attribution model can tell a marketer that Meta participated in 42% of high-value conversion journeys.
An incrementality test asks a different question:
How much of the resulting business would not exist without Meta?
Both numbers can be useful.
A practical operating rule is:
Attribution continuously. Incrementality periodically.
The counterfactual: What happens without marketing?
The most important concept in incrementality is also the one that cannot be observed directly.
Suppose a campaign runs and the business records $120,000 in revenue.
That alone does not tell us what the campaign caused.
If comparable customers would have generated $90,000 without the campaign, then:
Incremental revenue = $120,000 – $90,000 = $30,000
The difficult part is not the subtraction.
It is estimating the $90,000 counterfactual credibly.
A weak analysis might compare this month with last month and call the difference incremental revenue. That can be misleading because revenue may also change due to seasonality, pricing, inventory, promotions, product launches, competitor behavior, email activity, organic demand, or economic conditions.
The no-marketing baseline needs to represent what would reasonably have happened without the treatment.
That is why controlled experiments are so valuable.
Incremental revenue formulas
The formulas are simple. The experimental design behind them is the hard part.
Incremental revenue
For comparable treatment and control populations:
Incremental revenue = Treatment revenue – Counterfactual revenue
If the groups are different sizes, compare normalized values first:
Incremental revenue per user = Treatment revenue per user – Control revenue per user
Then scale the difference to the treatment population.
Revenue lift
Revenue lift % = (Treatment revenue per unit – Control revenue per unit) ÷ Control revenue per unit × 100
If treatment revenue per user is $2.40 and control revenue per user is $2.00:
Lift = ($2.40 – $2.00) ÷ $2.00 × 100 = 20%
Incremental ROAS
iROAS = Incremental revenue ÷ Advertising spend
If advertising generated $40,000 in incremental revenue from $20,000 in spend:
iROAS = 2.0x
Incremental profit
Revenue alone may still produce the wrong budget decision.
A more economic measure is:
Incremental profit = Incremental revenue – Incremental variable costs
Those costs can include media spend, discounts, commissions, fulfillment, product cost, and other costs that grow with the incremental sales.
A campaign can therefore create positive incremental revenue while still producing weak incremental profit.
Worked example: Why 5x ROAS may really be 1.6x
Consider a Meta retargeting campaign.
Meta reports:
Ad spend: $100,000
Attributed revenue: $500,000
That gives the campaign a reported:
ROAS = 5.0x
Now suppose a properly designed holdout analysis estimates that comparable customers would have generated $340,000 without the retargeting ads.
The incremental result becomes:
Incremental revenue = $500,000 – $340,000 = $160,000
Therefore:
iROAS = $160,000 ÷ $100,000 = 1.6x
| Metric | Result |
|---|---|
| Platform-attributed revenue | $500,000 |
| Estimated counterfactual revenue | $340,000 |
| Incremental revenue | $160,000 |
| Ad spend | $100,000 |
| Attributed ROAS | 5.0x |
| iROAS | 1.6x |
Meta’s 5.0x figure does not necessarily have to be “wrong.”
It may accurately describe revenue attributed under Meta’s reporting rules.
The mistake is treating attributed revenue as proof that every credited dollar was caused by the advertising. Usermaven’s guide to ad platform reporting limitations explores the same boundary between platform credit and business impact.
Four ways to measure incremental revenue
There is no single experiment design for every business.
The right method depends on audience size, sales cycle, channel mechanics, geography, and how much control the advertiser has over exposure.
1. Randomized audience holdout
Eligible users are split into two groups.
Treatment: eligible to receive the marketing intervention.
Control: withheld from that intervention.
The difference in outcomes estimates lift.
This is one of the strongest causal designs because randomization helps balance other factors between the groups.
It works best when the business has enough volume, can preserve the holdout, and can reliably measure the final outcome.
2. Platform conversion lift
Advertising platforms can offer their own controlled lift studies.
Meta Conversion Lift, for example, separates audiences into randomized test and control groups, serves ads to the treatment group, and compares resulting conversions. Meta’s own training material describes Conversion Lift as an experimental approach using randomized control groups.
Platform studies can be convenient because the platform already controls ad delivery.
The trade-off is that the experiment exists inside that platform’s data environment.
3. Geo experiment
Geographic experiments compare regions receiving the marketing intervention with comparable regions receiving reduced or no exposure.
This can be useful for:
- upper-funnel media;
- television or offline campaigns;
- large paid-media programs;
- cases where user-level holdouts are difficult.
The challenge is selecting sufficiently similar geographies and controlling for unrelated regional changes.
4. Switchback or controlled pause
A campaign or channel is alternated between treatment and control periods, or deliberately paused while outcomes are monitored.
This can be easier to execute operationally.
It is also more vulnerable to time-based confounding, especially when seasonality, promotions, competitor behavior, or demand changes across periods.
Advanced teams may use synthetic controls or other causal-inference methods when a clean randomized test is impossible.
Meta Incremental Attribution in 2026
Meta’s Incremental Attribution has made incrementality a more visible performance-marketing topic in 2026.
The concept is different from Meta’s standard attribution logic.
Traditional platform attribution asks whether a conversion followed an eligible ad interaction within the selected rules and window.
Meta’s incremental approach instead attempts to identify conversions that were more likely to have occurred because of advertising, rather than conversions that merely occurred after exposure. Independent analysis of the feature describes it as a machine-learning model for estimating ad-caused conversions, while noting that Meta has not disclosed enough detail to treat every modeled result as experimentally verified lift.
Meta Incremental Attribution vs Conversion Lift
These should not be treated as interchangeable.
| Meta measurement | Core method | Main use |
|---|---|---|
| Standard attribution | Eligibility and attribution rules | Campaign reporting |
| Incremental Attribution | Modeled incremental prediction | Incremental-focused reporting and optimization |
| Conversion Lift | Randomized treatment/control experiment | Experimental causal validation |
Meta Blueprint continues to describe Conversion Lift as an experiment that can determine campaign influence, inform spend decisions, and calibrate attribution models using channel-level lift results.
The important distinction is:
Modeled incrementality is not the same evidence as randomized lift.
A modeled estimate may still be highly useful, particularly for continuous optimization. A controlled experiment gives the marketer a stronger basis for validating the causal effect.
Influenced, attributed, and incremental revenue
These three revenue concepts are frequently mixed together.
They make progressively stronger claims.
| Revenue type | Meaning |
|---|---|
| Influenced revenue | Marketing appeared somewhere in the eligible journey |
| Attributed revenue | A model assigned revenue credit to marketing |
| Incremental revenue | Revenue estimated not to exist without the intervention |
Consider this journey:
Meta ad → Organic search → Email → Direct → Purchase
Meta can influence the journey because an ad interaction occurred.
A linear model can attribute a fraction of revenue to Meta.
A randomized holdout may then estimate that only part of the purchase volume was actually caused by Meta advertising.
Influence is broadest. Attribution assigns credit. Incrementality makes the strongest causal claim.
This distinction matters whenever marketers use phrases such as “marketing-generated revenue,” “influenced pipeline,” or “revenue driven by ads.”
They are not automatically equivalent.
Incremental revenue vs related metrics
Incremental revenue sits between conversion measurement and profit measurement.
Understanding the neighboring metrics prevents another category error.
Incremental conversions
Incremental conversions measure additional actions caused by marketing.
If treatment produces 1,100 purchases and a comparable control baseline implies 1,000 purchases, the campaign generated approximately 100 incremental purchases.
But all conversions do not necessarily have equal value.
Incremental revenue
Incremental revenue incorporates the monetary value of those additional outcomes.
Campaign A might create 100 incremental customers worth $20 each.
Campaign B might create only 25 incremental customers worth $200 each.
Campaign A wins on incremental conversions.
Campaign B wins on incremental revenue.
Incremental profit
Incremental profit goes one step further and accounts for costs.
This is often the better metric when deciding whether a channel should scale.
New-customer revenue
New-customer revenue is not automatically incremental revenue.
A new customer may have purchased organically without the campaign.
Likewise, an existing customer can generate incremental revenue if the intervention genuinely caused an additional purchase that otherwise would not have occurred.
When incrementality matters most
Not every marketing question deserves a causal experiment.
Some decisions can be made efficiently with ordinary attribution and analytics.
| Situation | Is attribution usually enough? | Incrementality recommended? |
|---|---|---|
| Compare creatives this week | Yes | Usually no |
| Optimize UTMs | Yes | No |
| Compare attribution models | Yes | No |
| Cut a major channel | Not alone | Yes |
| Increase Meta budget by 50% | Not alone | Yes |
| Validate branded paid search | Weak alone | Yes |
| Evaluate retargeting | Weak alone | Yes |
| Measure upper-funnel campaigns | Often incomplete | Yes |
| Very low-volume campaign | Often more practical | Test may lack power |
Retargeting is a classic case.
A buyer who has already visited the product page, added to cart, or viewed pricing has strong prior intent. Retargeting may genuinely increase conversion probability, but last-touch reporting can easily overstate how much demand it created.
Branded paid search has a similar problem.
Someone searching the company’s name is already expressing high intent. A paid brand ad can receive full attribution even when an organic result might have captured the customer anyway.
Upper-funnel campaigns have the opposite challenge.
They can be under-credited by click-based attribution because they often operate far from conversion. A well-designed incrementality test can help determine whether that apparently “untrackable” spend is creating additional demand.
When not to run an incrementality test yet
A causal experiment is not a substitute for basic measurement hygiene.
Before testing incrementality, verify that the business can trust the outcome being measured.
| Readiness question | Why it matters |
|---|---|
| Are conversion events firing correctly? | Broken outcomes make treatment/control comparison meaningless |
| Is revenue captured accurately? | Incremental revenue needs reliable monetary values |
| Are campaign definitions stable? | Constantly changing treatments create ambiguity |
| Are CRM or order records complete? | Missing downstream outcomes bias the result |
| Is sample volume sufficient? | Underpowered tests create noisy estimates |
| Can treatment and control remain separated? | Contamination weakens the counterfactual |
| Are major simultaneous changes controlled? | Promotions or launches can confound the result |
A useful sequence is:
Tracking → identity → outcome data → experiment design → counterfactual → causal estimate
This is where the Usermaven Measurement Trust Center becomes relevant later in the measurement workflow. Usermaven introduced it to expose data health across collection, identity, integrations, delivery, and reliability.
Do not run a causal experiment to solve a tracking problem.
Statistical significance and test quality
A lift estimate is not automatically a reliable lift estimate.
Suppose a test reports:
Estimated revenue lift: +8%
That looks encouraging.
Now suppose the confidence interval spans:
-4% to +20%
The business does not have strong evidence that the true effect is positive.
Test quality depends on factors such as sample size, baseline conversion rate, test duration, randomization, contamination, seasonality, statistical power, and confidence intervals.
This is one of incrementality’s main trade-offs.
Attribution can provide detailed campaign-level numbers continuously.
Causal experiments usually require more data, more time, and less granularity.
In exchange, they can answer a stronger question.
Custom attribution is not incrementality
A custom attribution model changes how observed revenue is distributed.
For example:
First touch: 30%
Middle interactions: 20%
Last touch: 50%
A business can also apply channel-specific rules or multipliers.
Those choices may better represent how the business wants to interpret its customer journey.
They still do not establish the counterfactual.
The question remains:
Would the outcome have happened without this channel?
Usermaven’s current Enterprise Custom Attribution Models allow businesses to define their own credit logic and compare that interpretation across attribution reporting, but custom credit remains attribution rather than randomized causal testing.
Usermaven’s custom attribution model guide explains how business-specific credit rules work and where those rules differ from causal measurement.
Data-driven attribution is not incrementality either
The same warning applies to algorithmic models.
Data driven attribution can use observed patterns to estimate how touchpoints contribute to conversions.
That is different from estimating what would happen if the touchpoint were removed.
Machine learning does not automatically transform observational data into causal evidence.
A data-driven model can still inherit:
- tracking gaps;
- selection bias;
- platform visibility limits;
- historical budget patterns;
- existing channel correlations.
The method may be more sophisticated than a fixed rule.
The causal question remains separate.
Attribution vs MMM vs incrementality
Mature measurement programs often combine several methods rather than searching for one perfect model.
| Method | Main question | Strongest use |
|---|---|---|
| Attribution | Which observed touchpoints receive credit? | Journey and campaign optimization |
| Incrementality | What additional outcome did marketing cause? | Causal validation |
| Marketing mix modeling | How did aggregate media investment relate to business outcomes over time? | Portfolio and budget planning |
Attribution offers granularity.
Incrementality strengthens causal confidence.
MMM gives a broader aggregate view, including channels that may be difficult to observe at the individual customer level.
The right stack depends on the decision being made.
Ecommerce vs B2B incrementality
The mechanics of incrementality change substantially with the sales cycle.
Ecommerce
Incrementality is often easier to test for ecommerce teams because purchase volume is higher and conversion cycles are shorter.
Typical questions include:
Did Meta retargeting create extra purchases?
Did this discount campaign generate additional demand or merely shift purchases forward?
Is 5x attributed ROAS actually 1.6x incremental ROAS?
High event volume can make randomized experiments more practical.
B2B
Incrementality is harder for B2B SaaS because buying cycles are longer, conversion volumes are smaller, and several stakeholders may influence one opportunity.
The causal question might be:
Did LinkedIn create additional qualified pipeline, or did it simply appear in journeys that already had strong buying intent?
The measurement outcome may need to be opportunity creation, pipeline value, Closed Won revenue, or another CRM stage rather than a website conversion.
How Usermaven fits into incremental measurement
Usermaven is not a randomized incrementality-testing platform.
Its role is the always-on attribution and revenue measurement layer around the causal experiments.
That distinction matters because good incrementality testing still depends on trustworthy campaign, journey, conversion, and revenue data.
Establish the observed revenue journey
Usermaven’s full-funnel revenue attribution connects acquisition, customer journeys, CRM outcomes, and revenue in one attribution view.
That allows teams to follow a path such as:
Campaign → visit → lead → opportunity → customer → revenue
and determine what happened before deciding whether a channel needs causal validation. Usermaven currently supports connecting marketing activity with CRM outcomes and revenue while preserving the wider customer journey.
Compare paid spend with downstream value
The paid ads attribution workflow connects spend from Meta, Google, LinkedIn, and Microsoft Ads with first-party conversions, conversion value, and attributed revenue.
This can help identify where an incrementality test is worth the effort.
For example:
Meta-reported ROAS: high
Cross-channel attributed revenue: much lower
CRM value: weaker again
That does not prove Meta lacks incrementality.
It tells the team that the channel deserves deeper validation.
Measure delayed outcomes from spend
Usermaven’s Paid Ads Attribution supports both By Conversion Date and By Spend Date analysis.
By Spend Date follows clicks generated during a selected spend period and looks forward for later conversions. By Conversion Date starts with conversions and looks backward for eligible paid touchpoints.
Usermaven also supports attribution windows up to 365 days, which is particularly useful for businesses with long sales cycles or delayed purchases.
This is still attribution, not causal lift.
Its value is preventing delayed conversions from being mistaken for absent conversions before a causal test is designed.
Bring off-site outcomes into measurement
Incrementality should be measured against the outcome the business actually values.
That may happen outside the website.
Usermaven Event Sources can bring payments, CRM events, webinar activity, manual sales, CSV imports, webhooks, and other external events into the same analytics environment. Imported events become available across attribution, funnels, journeys, trends, and conversion goals.
That means the measurement outcome can move closer to:
revenue
rather than stopping at:
form submission
Usermaven Events can then provide the behavioral context around those outcomes.
Check measurement health first
Incrementality testing requires a reliable outcome variable.
The Measurement Trust Center helps teams inspect measurement quality across collection, identity, integrations, delivery, and reliability.
That is useful before running a high-stakes test.
A holdout experiment cannot rescue corrupted revenue data.
Compare attribution before choosing tests
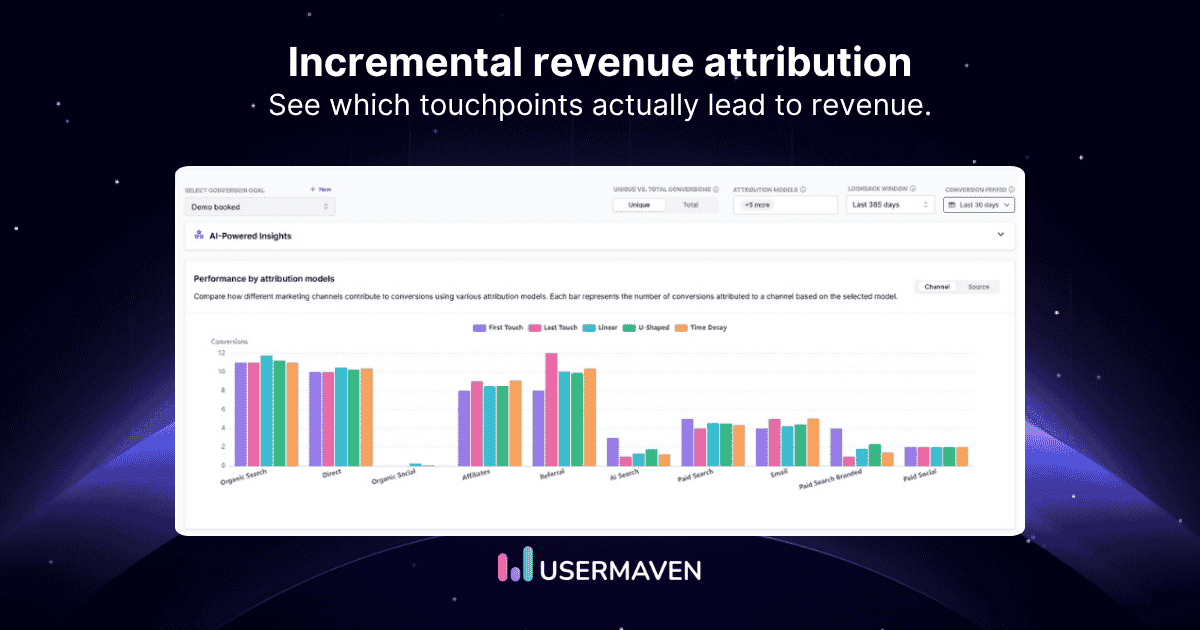
Attribution-model comparison can reveal where causal testing deserves priority.
Suppose a channel receives:
42% credit under last touch
but only:
8% under first touch
and:
16% under linear attribution
The disagreement does not tell us which model is correct.
It tells us the business conclusion is highly sensitive to the credit rule.
That is exactly the type of high-stakes ambiguity where an incrementality experiment can add value.
Analyze test candidates with Maven AI
Maven AI can investigate the observed data before a test is commissioned.
Useful questions include:
Which high-spend campaigns receive disproportionately high attributed revenue?
Which retargeting campaigns change most across attribution models?
Which channels have strong platform ROAS but weak downstream revenue?
Which campaigns should be prioritized for deeper validation?
Maven AI works with Usermaven’s analytics and attribution data. It does not manufacture causal evidence from observational data. Usermaven’s current AI and MCP tooling is designed to query attribution, funnels, journeys, traffic, and broader analytics context.
Evidence: ContentStudio improved revenue visibility
ContentStudio is useful evidence for this article, but the distinction needs to be explicit:
This is an attribution case study, not an incrementality experiment.
ContentStudio ran campaigns across Google Ads and Meta Ads while also testing LinkedIn and X. Platform dashboards showed spend, clicks, and conversions, but the team lacked a reliable connection between acquisition and downstream signups, upgrades, demos, and revenue.
After implementing Usermaven, ContentStudio connected paid campaigns with product and revenue outcomes.
| Outcome | Reported result |
|---|---|
| Signups | +128% |
| Plan upgrades | +92% |
| Demo bookings | +242% |
| Overall ROAS | +30% |
The team also discovered that many paid conversions occurred 7 to 14 days after the original click, helping it avoid cutting campaigns before the full conversion window had elapsed.
The ContentStudio case study demonstrates why reliable revenue attribution matters before incrementality.
It tells the business which campaigns are associated with real downstream value.
It does not establish how much of that value would have occurred without the campaigns.
That second question still requires causal validation.
Incremental revenue attribution checklist
| Check | Question to answer |
|---|---|
| Outcome | Are you measuring conversions, revenue, or profit? |
| Counterfactual | What represents the credible no-marketing condition? |
| Treatment | What exactly changes for the exposed group? |
| Control | Can exposure be withheld cleanly? |
| Randomization | Are groups comparable? |
| Sample | Is volume sufficient to detect meaningful lift? |
| Duration | Does the test cover the full buying cycle? |
| Contamination | Can control users accidentally receive treatment? |
| Tracking | Are conversion and revenue events trustworthy? |
| Attribution | What does always-on attribution already show? |
| Statistics | Is the lift estimate precise enough to act on? |
| Profit | Does the incremental value exceed incremental cost? |
| Scope | Is the conclusion platform-specific or broader? |
| Decision | Will the result actually change budget or strategy? |
Final verdict
Incremental revenue attribution is about the additional revenue marketing caused, not simply the revenue that appeared after an eligible ad interaction or received credit under an attribution model.
Use attribution continuously to understand journeys, compare campaigns, and operate marketing day to day. Use incrementality periodically when the decision requires causal confidence, particularly for retargeting, branded search, upper-funnel investment, and major budget changes.
The strongest measurement stack keeps three questions separate: Was the activity tracked? Which interactions receive credit? What outcome would disappear without the marketing? Tracking, attribution, and causal validation answer those questions respectively.
Ready to see Usermaven in action? Explore the platform or book a demo for a closer look.
FAQs
1. What is incremental revenue attribution?
Incremental revenue attribution measures the additional revenue associated with a marketing intervention above a credible estimate of what would have happened without it. Unlike traditional attribution, which distributes revenue credit across observed interactions, incremental measurement attempts to estimate causal lift.
2. What is incremental revenue?
Incremental revenue is revenue that exists above the expected baseline or counterfactual. In marketing, it represents revenue estimated to have been generated because of a campaign, channel, offer, or other intervention.
3. How do you calculate incremental revenue?
The simplest formula is:
Incremental revenue = Treatment revenue – Counterfactual revenue
For treatment and control groups of different sizes, compare normalized revenue per customer, user, region, or another common unit before calculating the total effect.
4. What is incremental ROAS?
Incremental ROAS, or iROAS, measures the additional revenue caused by advertising relative to ad spend:
iROAS = Incremental revenue ÷ Ad spend
It can differ substantially from platform-reported ROAS because platform ROAS is based on attributed revenue rather than a causal counterfactual.
5. What is the difference between attribution and incrementality?
Attribution decides how observed conversion or revenue credit should be distributed across marketing interactions. Incrementality asks whether marketing caused additional outcomes that would not have happened without the intervention.
6. Is attributed revenue the same as incremental revenue?
Updated

Written by
Junaid Ahmed
Content Writer & Digital Marketer
Junaid Ahmed is a content and copywriter with 3+ years of experience creating research-driven content across SaaS, B2B, ecommerce, and digital marketing. He specializes in turning complex topics into clear, practical content that helps marketers better understand their challenges, evaluate solutions, and make informed decisions. His work spans educational content, industry insights, and actionable marketing guides.
All articles by Junaid →