Incremental revenue is the additional revenue a business expects or generates from a decision compared with a defined baseline.
The basic formula is revenue with the decision minus baseline revenue. For example, $60,000 in sales against a $50,000 baseline gives a $10,000 difference.
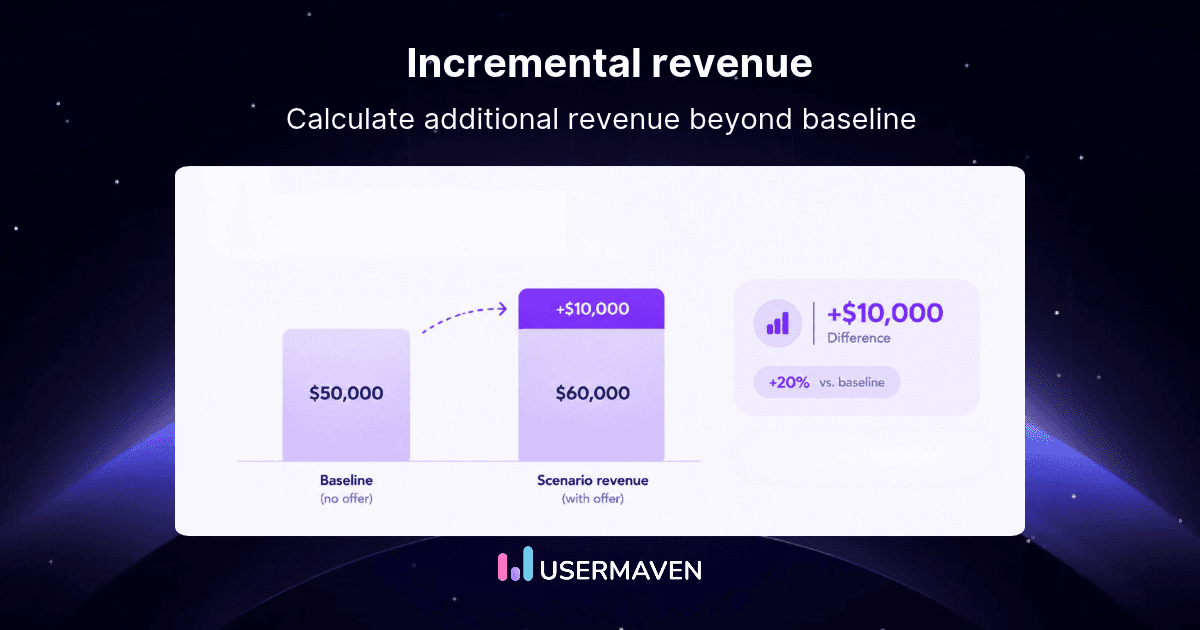
That figure has a critical qualification: a before-and-after increase does not prove the decision caused the growth. Seasonal demand, existing customers, or another campaign may explain part of it. The baseline must fit the question being asked.
This guide explains the formula, shows ecommerce and SaaS calculations, separates revenue from profit, and provides a practical process for measuring additional revenue without confusing recorded growth, attributed sales, and causal lift.
Key takeaways
Simple formula: Subtract the relevant baseline revenue from revenue under the new decision or scenario.
Baseline first: Last month’s sales and the no-action counterfactual are not automatically the same thing.
Comparable groups: When test groups differ in size, compare revenue per eligible customer before scaling the result.
Revenue is not profit: Additional advertising, delivery, or service costs can consume the added revenue.
Consistent definitions: Align refunds, currencies, tax treatment, customer populations, and observation windows.
Causal claims need evidence: Attribution reports and before-and-after changes cannot independently prove marketing lift.
What is incremental revenue?
Incremental revenue is the revenue difference between two defined alternatives.
A retailer might compare sales with and without a new promotion; a SaaS business might compare expansion revenue with and without an upgrade initiative; a finance team might compare two distribution strategies.
In business planning, the difference can be a forecast. After execution, it can be an observed variance from a reference amount.
In causal measurement, it can be an estimate of what the intervention actually added relative to what would otherwise have happened.
The arithmetic can look identical in all three cases. What changes is the evidence supporting the baseline and therefore the conclusion.
| Quick question | Practical answer |
|---|---|
| What is the formula? | Revenue with the decision − baseline revenue. |
| Can incremental revenue be negative? | Yes, when the new scenario earns less than the baseline. |
| Is it the same as revenue growth? | No. Growth compares periods; the baseline can represent a different alternative. |
| Is it the same as incremental profit? | No. Profit also deducts relevant additional costs. |
| Does a campaign’s attributed revenue prove lift? | No. Credit assignment is not a causal estimate. |
| When is a causal claim justified? | When a credible experiment or defensible causal analysis supports the comparison. |
The key distinction: Incremental revenue describes a difference between scenarios. To say an intervention caused that difference, the baseline must credibly describe the no-intervention outcome.
See what's working. Fix what's not. Grow faster.
What can generate additional revenue?
Higher unit sales, subscription upgrades, a new product, stronger retention, distribution expansion, and marketing can all change revenue.
But the relevant calculation should include lost sales elsewhere in the business, not simply add the most visible new revenue stream.
How to calculate incremental revenue
The general formula is:
Incremental revenue = Revenue under the new scenario − Baseline revenue
Define both scenarios before collecting numbers. Specify the same currency, comparable customers, revenue basis, and measurement period. Otherwise, the result may look precise while describing different things.
A simple incremental revenue calculation
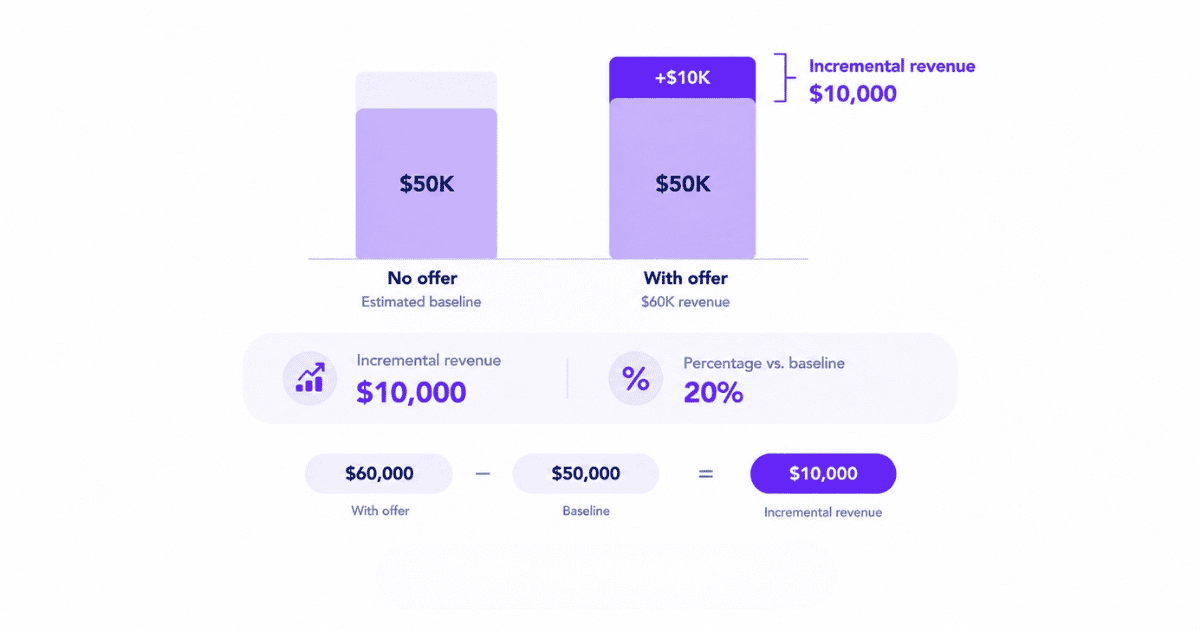
Suppose a company evaluates a new promotional offer over one month. Its estimated baseline revenue without the offer is $50,000, while the observed revenue with the offer is $60,000.
| Measurement | Illustrative amount |
|---|---|
| Estimated baseline revenue | $50,000 |
| Recorded revenue with the offer | $60,000 |
| Difference from baseline | $10,000 |
| Difference as a share of baseline | 20% |
Calculation: $60,000 − $50,000 = $10,000.
Percentage difference: ($10,000 ÷ $50,000) × 100 = 20%.
If $50,000 is merely last month’s actual revenue, we can safely report a $10,000 month-over-month increase.
If it is a well-supported estimate of what the same business would have made without the promotion, the difference can support an estimate of lift, subject to the method’s assumptions.
Calculate revenue when volume and price change
For a business selling one product, the more complete expression is:
Incremental revenue = (New units × New price) − (Baseline units × Baseline price)
If the unit price is unchanged, this simplifies to additional units × price per unit. Do not use that shortcut when discounts, prices, product mix, returns, or quantities changed materially.
For example, increasing sales from 400 to 500 units at a constant $80 per unit adds $8,000 in revenue relative to that volume baseline.
If the price fell to $70, the actual new revenue is $35,000 against $32,000, so the difference is $3,000, not $8,000.
Can incremental revenue be negative?
Yes. If a proposal has a $50,000 revenue baseline but yields $47,000, the difference is −$3,000. This tells the business that the selected scenario underperformed the comparison.
It does not identify the cause unless the comparison supports causal inference.
How to choose a reliable revenue baseline
Baseline selection is more important than the subtraction. A baseline should represent the alternative relevant to the decision, not simply the easiest number available in a dashboard.
| Baseline method | Comparison | Best use | Main caution |
|---|---|---|---|
| Previous period | This month’s revenue vs. last month’s | Descriptive growth reporting | Seasonality and unrelated changes. |
| Historical forecast | Actual revenue vs. predicted revenue | Forecast variance and planning | Model assumptions and forecast error. |
| Randomized holdout | Eligible treatment vs. control groups | Causal lift for a testable intervention | Assignment, contamination, and uncertainty. |
| Geographic comparison | Exposed markets vs. suitable controls | Regional initiatives | Spillover and geographic differences. |
| Modeled counterfactual | Actual revenue vs. modeled no-action outcome | When a test is infeasible | Unmeasured confounding and model validity. |
A baseline can change the conclusion
Consider a business that made $50,000 in September and $60,000 in October after launching a campaign. The observed revenue increase is $10,000.
Suppose a forecasting model predicts that October revenue would have reached $56,000 without the campaign because of seasonal demand. Revenue above this modeled baseline is $4,000, not $10,000.
Observed increase: $60,000 − $50,000 = $10,000.
Difference from modeled baseline: $60,000 − $56,000 = $4,000.
Neither calculation alone establishes the causal effect. The second depends on the forecast representing a credible no-campaign scenario. A randomized experiment may offer stronger evidence when feasible and well executed.
Marketers planning such comparisons can use the experimentation principles in incrementality in marketing, while Google’s Conversion Lift setup guidance illustrates why eligibility, treatment design, and conversion timing matter.
Check the factors that change baseline revenue
Record any concurrent pricing change, product launch, discount, supply constraint, seasonality, competitor move, or channel change that could have affected the comparison.
If an intervention shifts purchases from an existing product to a new one, evaluate total relevant business revenue rather than the new product in isolation.
Practical rule: Label whether the result is an observed period change, a forecast difference, or a causal estimate. Those labels should never be interchangeable in a board report.
Drive business growth
with AI-powered analytics
Incremental revenue examples by business type
Different businesses record revenue differently. A purchase total, subscription run rate, and forecast sale are not directly comparable, so the examples below define their revenue measures and assumptions.
Ecommerce: Compare unequal customer groups
An ecommerce team randomly assigns eligible shoppers to a promotional treatment and a holdout. Treatment has 5,000 eligible customers and generates $150,000. Control has 4,000 eligible customers and generates $108,000 in the same window.
| Measurement | Treatment | Control |
|---|---|---|
| Eligible shoppers | 5,000 | 4,000 |
| Recorded revenue | $150,000 | $108,000 |
| Revenue per eligible shopper | $30.00 | $27.00 |
First, divide each group’s revenue by its eligible population. Treatment revenue per shopper is $30, while control revenue per shopper is $27.
Next, scale the control rate to the treatment population: 5,000 × $27 = $135,000 estimated treatment revenue without the promotion.
Finally, calculate the difference: $150,000 − $135,000 = $15,000 estimated incremental revenue among treated shoppers, or 11.1% relative lift in revenue per eligible shopper.
The estimate assumes sound randomization, consistent net-revenue definitions, and comparable observation windows. The result also has statistical uncertainty; it is not a guarantee of $15,000 more revenue whenever the promotion runs.
Reliable collection matters. The ecommerce analytics and attribution setup explains how purchase events and order journeys can enter Usermaven, while ecommerce attribution distinguishes recorded order revenue from credit allocated to marketing touchpoints.
B2B SaaS: Measure expansion MRR without overstating ARR
Suppose an account-expansion program is tested among eligible SaaS customers. Treatment contains 500 accounts and records $6,000 in new expansion MRR at the observation point. Control contains 400 accounts and records $3,600.
| Measurement | Treatment | Control |
|---|---|---|
| Eligible accounts | 500 | 400 |
| Expansion MRR observed | $6,000 | $3,600 |
| Expansion MRR per eligible account | $12.00 | $9.00 |
Estimated incremental expansion MRR = ($12 − $9) × 500 = $1,500.
If that extra MRR persisted unchanged for twelve months, it would imply an $18,000 annualized run-rate difference.
It would not yet be proof that $18,000 was collected or recognized over the next year. Churn, concessions, downgrades, billing schedules, and refunds can change realized revenue.
For sales-led firms, a qualified opportunity and a paid subscription must also remain separate outcomes.
Connected customer and CRM measurement, such as the B2B SaaS solution, can help teams follow those stages without turning pipeline into earned revenue.
Product launch: Compare business alternatives
A product team forecasts $200,000 revenue without an expansion and $235,000 with it. The projected difference is $35,000.
If the new product also displaces $8,000 of existing sales not already reflected in the forecast, the revised net increase becomes $27,000.
This is a scenario analysis, not proof of realized or causal revenue. After launch, the team should revisit actual prices, adoption, displaced sales, and costs.
Affiliate marketing: Credit is not additional demand
An affiliate can receive commission for an order that the customer would have placed anyway, especially when a coupon publisher appears close to checkout.
The key question is whether the affiliate caused additional purchases rather than merely earning last-click credit.
That distinction between assigned credit and causal impact is central to incrementality vs. attribution. A properly designed comparison, not affiliate conversions alone, is needed to estimate added demand.
Incremental revenue vs. other business metrics
Incremental revenue often appears beside total revenue, growth rates, attributed revenue, and profit. Defining each measure avoids incorrect comparisons.
| Metric | What it answers | Important limit |
|---|---|---|
| Total revenue | How much revenue did the business record? | Includes existing business and new activity. |
| Revenue growth | How much did revenue change across periods? | Does not establish a cause. |
| Incremental revenue | What revenue difference exists vs. a defined alternative? | Interpretation depends on baseline credibility. |
| Attributed revenue | Which recorded interactions receive revenue credit? | Model-assigned credit is not causal lift. |
| Incremental profit | How much additional profit remains after relevant costs? | Requires an appropriate cost comparison. |
| Incremental ROAS | What estimated additional revenue arose per applicable ad dollar? | Requires causal revenue evidence and matching spend. |
| Marginal revenue | What revenue changes from an additional unit or small output change? | Not a general campaign incrementality measure. |
Incremental revenue vs. revenue growth
A 20% year-over-year revenue increase describes change over time. It does not answer how much was caused by a new campaign, distribution partner, or product launch. A causal claim requires a credible alternative outcome.
Incremental revenue vs. attributed revenue
A marketing dashboard may assign $50,000 to a channel under a selected attribution model. That does not establish $50,000 in additional business created by the channel.
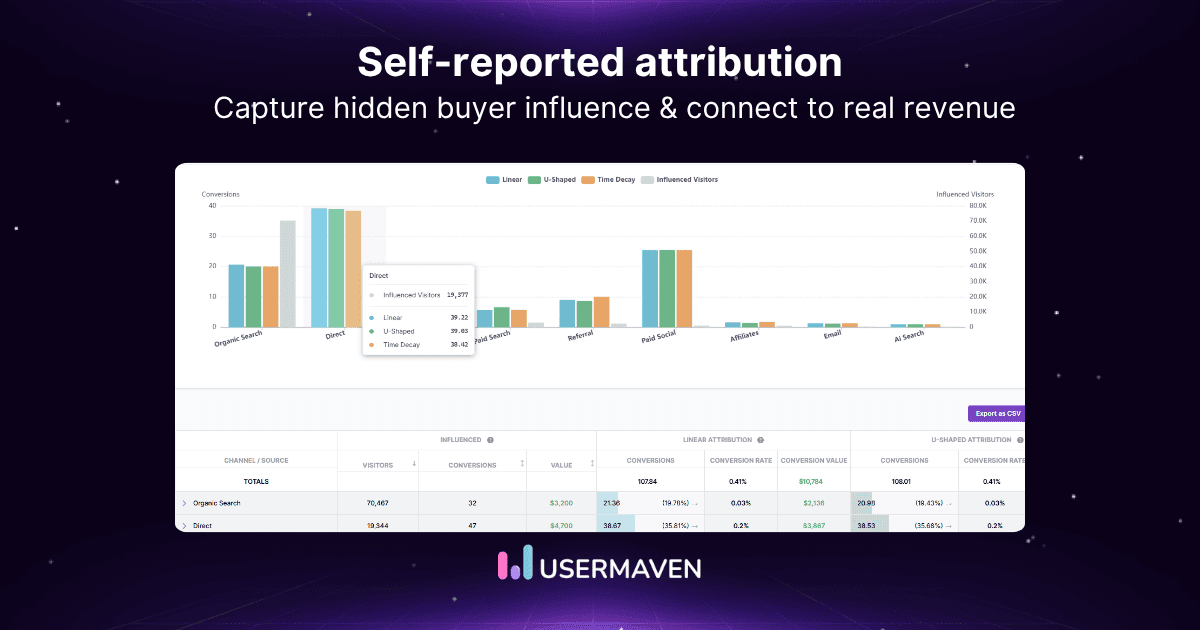
Revenue attribution explains how credit reaches channels; incremental revenue attribution addresses the more demanding causal revenue question.
Incremental revenue vs. incremental profit
Revenue describes the additional sales value. Profit subtracts the relevant incremental costs of generating it. A promotion may raise sales but be uneconomic because of media, fulfillment, sales commissions, or discounts.
How to calculate incremental profit
Incremental profit = Incremental revenue − Relevant incremental costs.
Continue the ecommerce example with $15,000 estimated incremental revenue. Assume the promotion adds $7,000 in advertising costs and $4,000 in fulfillment and other variable costs, with no other relevant changes.
| Measure | Illustrative amount |
|---|---|
| Estimated incremental revenue | $15,000 |
| Extra advertising spending | $7,000 |
| Extra fulfillment and variable cost | $4,000 |
| Estimated incremental profit | $4,000 |
The calculation is $15,000 − $7,000 − $4,000 = $4,000.
A campaign with positive incremental revenue may still lose money after incremental costs. The correct decision depends on contribution margin, cash flow, risk, capacity, and the alternatives available to the business.
In managerial accounting, the comparison is between the differential revenue and differential costs of alternatives, rather than allocating every historical fixed cost to a new initiative. The relevant-cost concept is also discussed in this managerial accounting excerpt.
Treat this as a simplified example. Real analyses may also require returns, payment fees, service costs, taxes, and opportunity costs, depending on the decision.
How to measure incremental revenue accurately
A useful measurement process should produce more than a dollar figure. It should let another analyst reproduce the definition, data selection, baseline, and interpretation.
1. Define the decision and eligible population
Write the question before opening a dashboard: Did the promotion increase net purchase revenue among eligible customers? Would an expansion initiative raise monthly recurring revenue? What would opening another distribution channel add?
Record the customer, account, product, or geographic population. A comparison becomes unreliable when the baseline covers different customers or a different business unit.
2. Choose one revenue definition
Decide whether to use gross sales, net order revenue, collected cash, new MRR, expansion MRR, or recognized revenue. Specify currency, tax treatment, refunds, discounts, and the recognition or observation period.
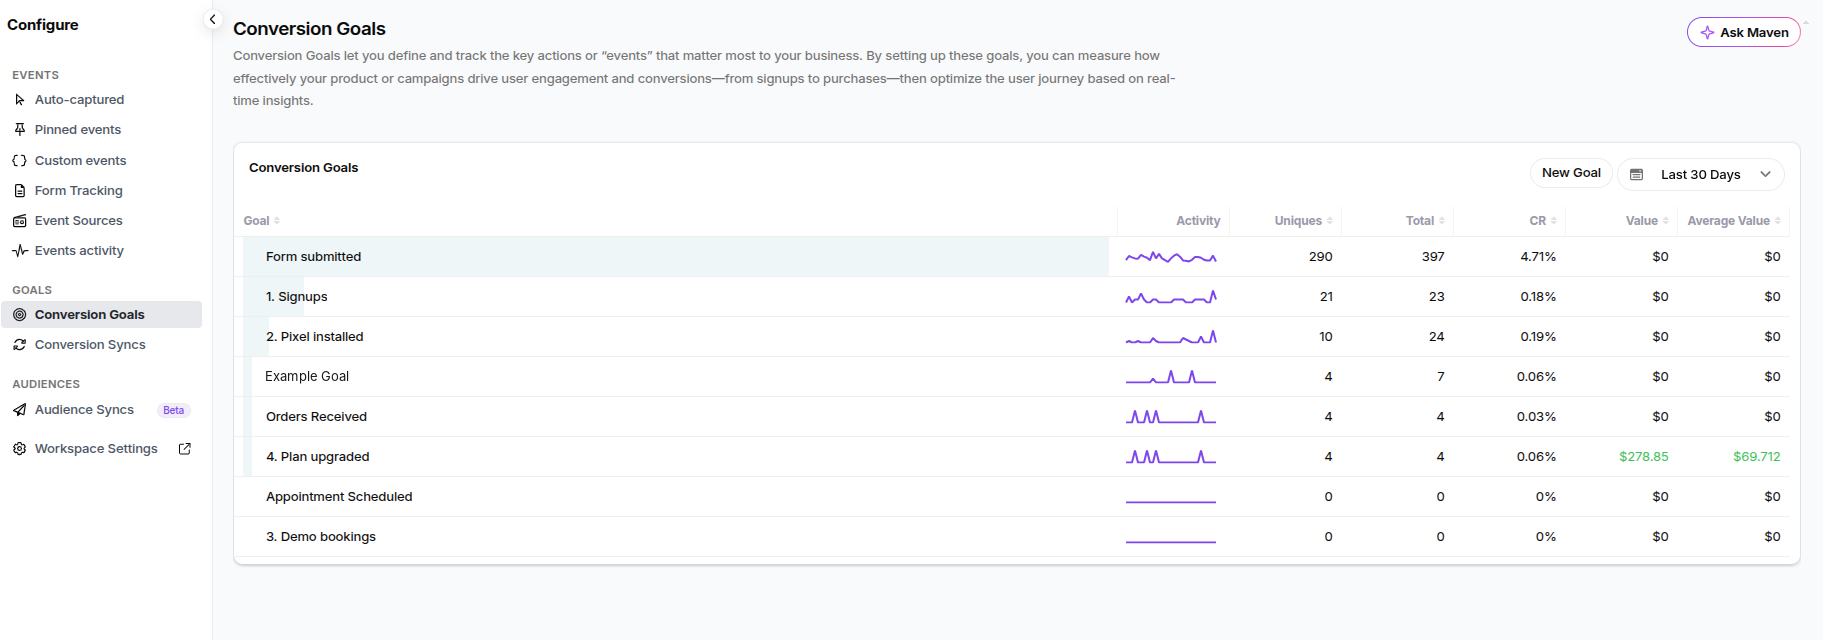
For marketing and product analysis, Usermaven conversion goals can track meaningful events and supported monetary values. The goal is a consistent recorded outcome, not automatic proof of incremental revenue.
3. Establish and document the baseline
Choose a historical reference, forecast, randomized control, or defensible causal model appropriate to the question. State the principal assumptions and what could break them.
When causal evidence is weak, label the output as a revenue difference or modeled estimate rather than proven lift.
4. Collect reliable transactions and outcomes
Decide where the authoritative payment or subscription event originates. A checkout click is not necessarily a completed payment. For custom revenue actions, the event tracking setup helps teams record the required action and properties.
Usermaven Event Sources can bring off-site payments, subscription events, renewals, refunds, and offline conversions into analytics through supported webhooks, integrations, or CSV imports. Those sources also document duplicate handling and delivery logs.
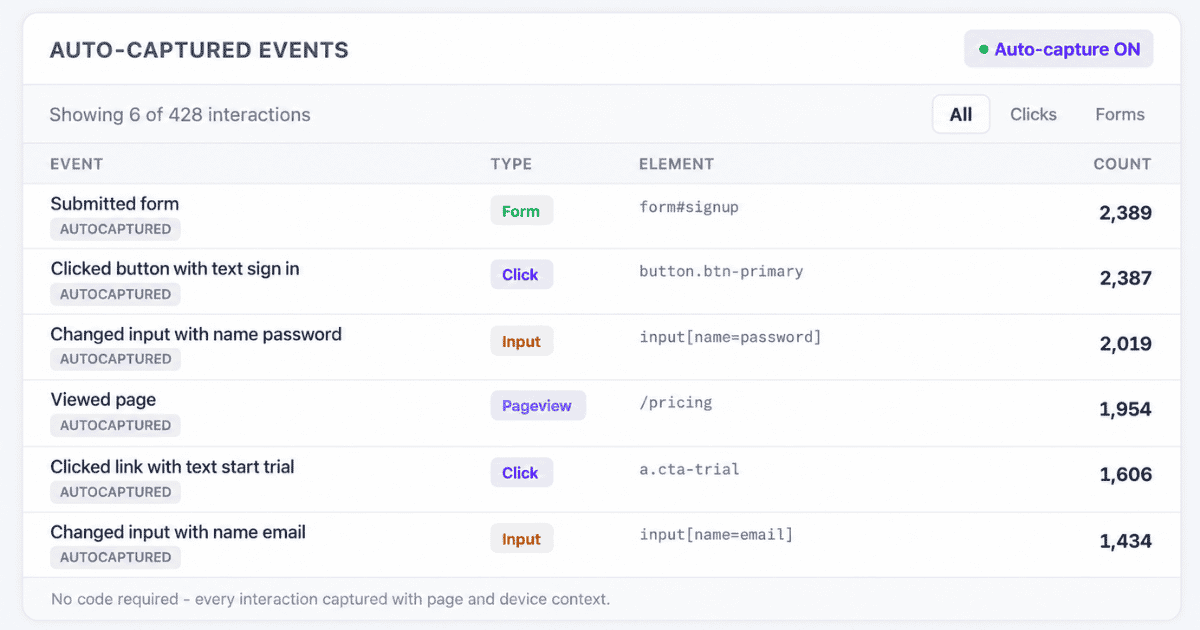
When using those records, select one authoritative event per sale or refund and reconcile totals with billing or accounting. The Events product page explains the broader event collection layer.
5. Normalize before subtracting
Match periods and currencies, use equivalent definitions, and normalize for different group sizes where required. In customer experiments, revenue per eligible customer is often more comparable than raw group totals.
Do not subtract treatment revenue from control revenue when the populations differ in size without appropriate adjustment. Do not mix contract value, annualized run rate, and collected sales in one formula.
6. Audit collection quality and uncertainty
Before sharing a result, check for missing transactions, duplicate orders, unresolved identities, late refunds, incomplete integrations, and mismatched attribution windows. The Measurement Trust Center checks campaign tracking, customer matching, platforms, and data confidence.
These checks can improve the quality of observed inputs. They cannot determine whether a holdout was correctly randomized or whether a forecast is a valid causal counterfactual.
7. Report the result with its evidence level
Show the observed or forecast revenue, baseline, dollar difference, percentage difference, relevant costs, and the limits of the analysis. Label each conclusion as descriptive, forecast-based, or causal.
| Worksheet field | What the analyst should record |
|---|---|
| Decision | Specific action being evaluated. |
| Revenue definition | Net purchases, recognized revenue, MRR, etc. |
| Population and dates | Eligibility and matching observation period. |
| Baseline | Method, amount, and assumptions. |
| New-scenario revenue | Observed or forecast amount. |
| Revenue difference | New scenario minus baseline. |
| Relevant costs | Only the costs that change with the decision. |
| Data validation | Refunds, duplicates, identity, currency, late events. |
| Evidence level | Descriptive, forecast-based, or causal. |
| Next decision | Scale, revise, monitor, retest, or stop. |
Practical standard: A reader should be able to reproduce the number and understand precisely what it does and does not prove.
Common incremental revenue calculation mistakes
Most serious mistakes arise from an inconsistent baseline or mismatched business data, not from subtraction.
| Mistake | Why it misleads | Better approach |
|---|---|---|
| Treating revenue growth as caused by one campaign | Seasonality and other drivers are ignored. | Use a credible counterfactual. |
| Comparing unequal test groups directly | Group size distorts raw totals. | Normalize per eligible unit. |
| Mixing gross and net revenue | Refunds and discounts change the metric. | Define one consistent revenue basis. |
| Counting the same payment twice | Checkout and billing events may duplicate a sale. | Deduplicate using stable order identifiers. |
| Calling attributed revenue incremental | Credit allocation does not prove causality. | Separate model credit from causal lift. |
| Ignoring cannibalized sales | A new product may replace an existing one. | Evaluate the whole relevant business. |
| Equating MRR with collected annual revenue | Run rate and cash receipts differ. | Label MRR, ARR, bookings, and cash correctly. |
| Ignoring extra costs | Additional revenue may not be profitable. | Calculate incremental contribution/profit. |
| Projecting one test result indefinitely | Effects change with audience and spend. | Bound and periodically retest conclusions. |
Separate transaction totals from marketing credit
A single order can have several marketing touchpoints and be assigned credit in multiple models. The underlying sale should appear once in business revenue totals even when attribution views allocate credit differently.
That distinction matters whenever businesses compare campaigns through marketing measurement: descriptive transactions, attribution allocations, and experimental estimates describe different layers of evidence.
Account for displaced revenue
Suppose a new product earns $20,000 but displaces $8,000 in existing-product sales. If those are the only revenue changes, the net business difference is $12,000, not $20,000. The baseline should cover both products and the same reporting period.
How incremental revenue informs business decisions
Calculating a revenue difference is a starting point. Leaders also need to ask whether that difference is reliable, profitable, sustainable, and relevant to the decision under review.
Decide whether to expand the initiative
Compare estimated incremental profit with implementation costs, risks, and available alternatives. A campaign yielding a credible $4,000 incremental profit may justify a bounded increase, while a positive but highly uncertain revenue estimate may justify more measurement instead.
A single successful test does not prove the same effect will hold at a larger budget or in another audience. Saturation, competition, and customer mix can alter the marginal result.
Use attribution for operating detail, not causal shortcuts
Ongoing performance marketing attribution helps teams investigate campaign spend, credited conversions, and customer journeys. Usermaven’s paid ads attribution documentation also distinguishes reporting by conversion date vs. spend date, which changes how performance is grouped over time.
These reports help identify decisions worth testing and explain ongoing activity between experiments. Their ROAS values describe attributed performance, not independently verified incremental ROAS.
For ecommerce teams, the ecommerce brands solution connects recorded marketing interactions with purchases, repeat revenue, and customer value. Those outcomes support the commercial picture but still require a suitable baseline before claiming an initiative’s causal revenue impact.
Turn the calculation into a decision record
For each initiative, state the alternatives, the estimated revenue difference, the incremental costs, the evidence quality, and the next action. This makes it possible to revisit a decision when new purchases, renewals, or experimental results arrive.
Final verdict
Incremental revenue is the revenue difference between a decision and its relevant baseline.
The formula is straightforward; the quality of the answer depends on defining comparable scenarios, collecting consistent revenue data, and distinguishing forecasts or observed growth from causal lift.
Use revenue and profit together to evaluate the economics, and state uncertainty before scaling an initiative.
When the goal is to connect recorded campaigns, customer actions, and revenue more reliably, book a demo to explore Usermaven’s measurement workflows.
FAQs
1. What is incremental revenue in simple terms?
Incremental revenue is the additional revenue under one business scenario compared with a defined alternative. A causal interpretation requires a credible estimate of what revenue would have been without the action.
2. How do you calculate incremental revenue?
Subtract baseline revenue from revenue under the new scenario. If revenue is $60,000 and the appropriate baseline is $50,000, the difference is $10,000, or 20% of baseline revenue.
3. Can incremental revenue be negative?
Yes. If a decision generates less revenue than the baseline alternative, incremental revenue is negative. A negative difference alone does not identify its cause unless the comparison supports a causal conclusion.
4. Is incremental revenue the same as incremental profit?
No. Incremental revenue measures additional revenue. Incremental profit subtracts the relevant additional costs, such as advertising, fulfillment, and commissions, associated with the business decision.
5. How is incremental revenue different from revenue growth?
Revenue growth compares revenue across periods. Incremental revenue compares a chosen scenario against its relevant baseline; claiming an intervention caused the difference needs credible counterfactual evidence.
6. How do you measure incremental revenue from marketing?
Define the business outcome and eligible population, then compare campaign performance with a credible no-campaign baseline. A valid randomized holdout or defensible causal method may estimate lift; ordinary attribution does not prove it.

Written by
Junaid Ahmed
Content Writer & Digital Marketer
Junaid Ahmed is a content and copywriter with 3+ years of experience creating research-driven content across SaaS, B2B, ecommerce, and digital marketing. He specializes in turning complex topics into clear, practical content that helps marketers better understand their challenges, evaluate solutions, and make informed decisions. His work spans educational content, industry insights, and actionable marketing guides.
All articles by Junaid →