Incrementality in marketing measures the additional conversions, customers, or revenue caused by a campaign compared with what would have happened without it.
A credible comparison, often a randomized treatment and control, estimates the outcomes that would have happened anyway. This is the difference between conversion credit and causal impact.
A retargeting campaign might claim 500 purchases, but many customers may already have intended to buy. Scaling that campaign without testing could increase spending without creating proportional new demand.
This guide explains how to choose an incrementality test, calculate lift, validate the experiment, and use the findings to make budget decisions. The focus is on evidence, not attractive-looking attribution totals.
What is incrementality in marketing?
Incrementality is a causal measurement question: what changed because marketing ran? Attribution instead asks which recorded interactions receive credit for an outcome.
The missing piece is the counterfactual. We observe what a customer did after marketing, but cannot simultaneously observe what that same customer would have done without it.
A randomized holdout estimates that missing baseline by comparing comparable groups. Broader marketing measurement also uses geographic experiments and other methods when they establish defensible comparisons.
| Question | Practical answer |
|---|---|
| What is incremental lift? | The treatment outcome minus a credible no-treatment baseline. |
| What can be measured? | Purchases, signups, qualified leads, activation, revenue, or profit. |
| How is it tested? | Audience holdouts, platform lift studies, geo tests, or carefully justified causal models. |
| Why does it matter? | Reported conversions can include purchases that would have happened anyway. |
| What makes evidence credible? | Comparable groups, reliable outcomes, sufficient data, and uncertainty analysis. |
For example, if 1,000 purchasers are associated with an ad campaign but a credible comparison suggests 750 would have purchased without it, the estimated increment is 250. The baseline must be measured, not guessed.
This is one of the ad attribution problems that matters most in retargeting: a campaign can receive credit for demand it did not create.
See what's working. Fix what's not. Grow faster.
How to calculate incremental marketing lift
Start with the rate of the chosen outcome in each group. Comparing rates prevents unequal group sizes from misleading the result.
A treatment vs. control example
Imagine an ecommerce company randomly assigns 20,000 eligible customers: 10,000 can receive retargeting ads, while 10,000 are held out. Both groups can still purchase.
Unlike ordinary ecommerce attribution, this experiment compares what happened under advertising eligibility with a control baseline that estimates purchases without that campaign.
| Metric | Treatment | Control |
|---|---|---|
| Eligible customers | 10,000 | 10,000 |
| Customers who purchased | 800 | 650 |
| Purchase rate | 8.0% | 6.5% |
Illustrative example; assumes valid assignment, consistent outcome tracking, and comparable observation windows.
Calculate absolute lift and relative lift
Absolute conversion lift = 8.0% – 6.5% = 1.5 percentage points
Relative lift = (8.0% – 6.5%) / 6.5% x 100 = 23.1%
The treatment group converted 1.5 percentage points higher, or about 23.1% above the control conversion rate. These are related but different measures.
Estimate incremental purchases
Estimated incremental purchases = (8.0% – 6.5%) x 10,000 = 150
Because the groups are equally sized, subtracting 650 purchases from 800 gives the same answer. With unequal groups, use conversion rates and scale to the intended population.
The 150 represents estimated additional purchases among the 10,000 treatment customers, not the entire 20,000-person experiment population.
Translate lift into revenue and iROAS
Assume each incremental purchase generates $200 in revenue and the treatment cost $12,000 more in advertising than the control.
Incremental revenue = 150 x $200 = $30,000
Incremental ROAS (iROAS) = $30,000 / $12,000 = 2.5x
That is a revenue return, not a profit margin. If contribution margin before media is 50%, the $30,000 adds $15,000 of contribution before subtracting the $12,000 media cost.
Illustrative contribution after incremental media = $15,000 – $12,000 = $3,000
A 2.5x iROAS may therefore be economically attractive or unattractive depending on costs, margins, and future customer value. The experiment design matters as much as the arithmetic.
Regular performance marketing attribution evaluates revenue credited to campaigns; this 2.5x iROAS instead uses the estimated difference between the randomized groups.
Which incrementality test should you choose?
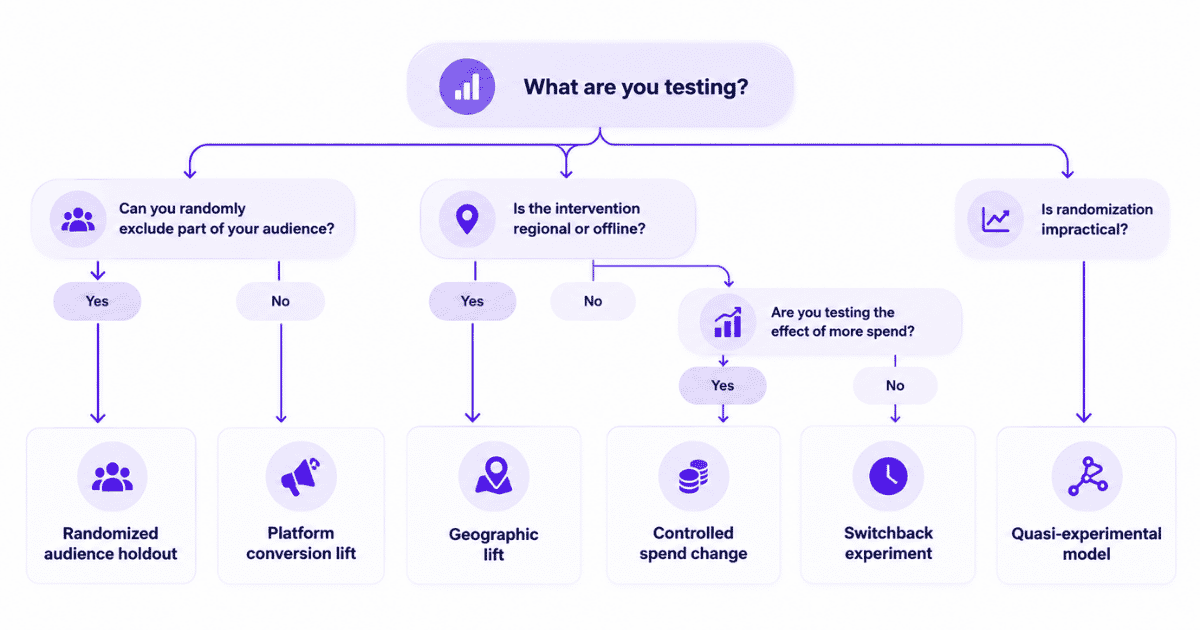
Choose the test that fits the intervention and decision. A platform-supported holdout, a regional test, and a modeling approach do not offer the same control over alternative explanations.
| Approach | Best fit | Key limitation |
|---|---|---|
| Randomized audience holdout | Retargeting, lifecycle email, eligible customer campaigns | Requires stable assignments, exclusions, and enough outcomes. |
| Platform conversion lift | Eligible campaigns on supported ad platforms | Platform eligibility, holdout settings, and measured scope. |
| Geographic lift | Regional media, offline campaigns, broad demand effects | Markets must be comparable; spillovers can bias results. |
| Controlled spend change | Does extra spend create extra outcomes? | Requires a valid comparison, not a before/after guess. |
| Switchback experiment | Interventions that can be alternated over time | Time trends and carryover effects can confound results. |
| Quasi-experimental model | Randomization is impractical | Conclusions depend on untestable assumptions and diagnostics. |
Use audience holdouts when assignment is possible
Randomly assign eligible customers before exposure. Evaluate people according to their assigned group, including those who were eligible but never actually saw an ad.
Comparing only people who saw an ad with people who did not creates selection bias: ad exposure itself is not random just because eligibility was randomized.
Use geo experiments for broad media effects
Geographic tests can estimate regional campaigns when user-level exclusions are not feasible. They need enough regions, reliable pre-period outcomes, comparable trends, and limited cross-market contamination.
Check platform lift eligibility early
Google Ads offers user-based Conversion Lift for eligible accounts and campaigns. Feasibility depends on the configuration, observed conversions, study duration, and holdout share.
A built-in study can simplify assignment and analysis, but its results still apply to the population, conversions, and media included in that study.
Drive business growth
with AI-powered analytics
How to run a marketing incrementality test
A useful incrementality test begins with a decision and ends with a documented result. Use this seven-step procedure before changing budgets.
1. Define the budget question and hypothesis
Write a single decision-oriented question: “Does Meta retargeting generate additional purchases among eligible visitors?” Specify whether the result will guide scaling, reducing, or redesigning that campaign.
State the expected outcome before the test starts. Decide what effect would be commercially meaningful, not just statistically detectable.
2. Specify treatment, control, and assignment unit
Define exactly what treatment receives and what control does not. Choose whether assignment occurs at user, household, account, store, or geographic level.
Keep assignment stable and check whether other campaigns can deliver an equivalent treatment to the control group. Record exclusion rules before launch.
3. Pick one primary outcome
Select the most meaningful outcome that can mature during the study: purchases, activated accounts, qualified leads, or another clearly defined event.
For a sales-led SaaS business, demo requests may mature quickly, while opportunities and closed revenue take longer. Incremental demos are not proof of incremental customers.
The Events feature can record meaningful actions such as a demo submission, while an external experiment determines whether the observed difference represents causal lift.
Teams using Usermaven can define events through its event tracking setup and map a business action to conversion goals. Confirm the event fires once per intended outcome.
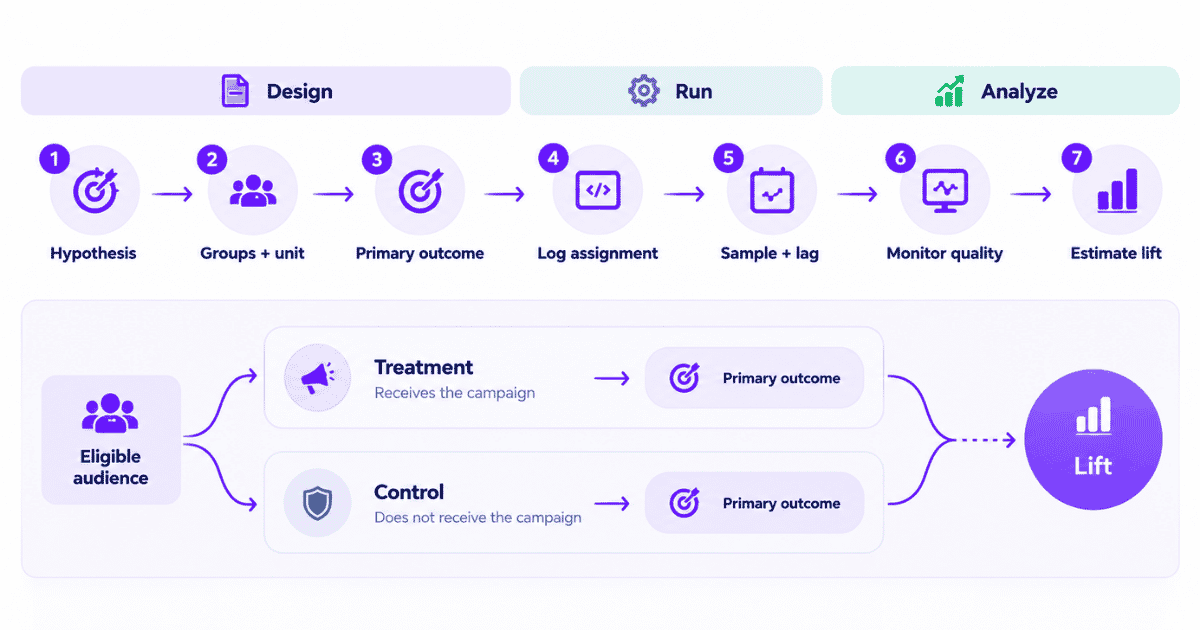
4. Record assignments separately from outcomes
Send a clear assignment record when the external test system assigns a participant. Include the experiment identifier, assigned group, and a stable participant key where permitted.
Usermaven documents an ab_test_assigned event with test_name and variant properties in its A/B test tracking guide. Conversion events can also carry the relevant variant.
This supports Trends and Funnel analysis. It does not turn Usermaven into a randomized holdout service or validate causal effects automatically.
Once groups and outcomes are recorded, funnel analysis can reveal where participants drop off. Differences remain descriptive until the experimental design and statistical analysis justify a causal claim.
5. Plan sample size, duration, and conversion lag
Estimate the baseline conversion rate, the smallest lift worth detecting, statistical power, test allocation, and delay between exposure and outcome.
Decide the observation and stopping rules before launch. A one-week test may be far too short for a product with a three-month sales cycle.
When using an ad-platform lift product, run its feasibility assessment. Otherwise, consult an experiment specialist or an appropriate power calculator for the chosen design.
6. Run the test and monitor execution quality
Watch assignment ratios, event collection, holdout exclusions, major campaign changes, and cross-channel spillovers. Do not repeatedly stop when a favorable p-value appears unless sequential testing was planned.
If the treatment changes substantially during the test, record it. A result is much harder to interpret when the intervention itself shifts.
7. Analyze the intended groups and document the result
Estimate the treatment-control difference, an uncertainty interval, and the corresponding incremental outcomes. Use methods appropriate for the assignment unit, especially for clustered or geographic designs.
Compare the effect with the business threshold agreed before launch. Summarize constraints, deviations, and whether the result is strong enough to act on.
Experiment planning worksheet
Complete this worksheet before launch. It prevents ambiguous results caused by decisions made after looking at the data.
| Field | What to decide before testing |
|---|---|
| Budget decision | Scale, reduce, pause, or redesign which activity? |
| Primary hypothesis | What additional outcome is expected? |
| Treatment and control | Precisely what changes, and for whom? |
| Assignment unit | Customer, account, geography, or time block. |
| Primary metric | Event definition and eligible population. |
| Sample and duration | Power assumptions, allocation, conversion lag. |
| Integrity checks | Randomization, exclusions, duplicate events, spillover. |
| Decision rule | Economic threshold and treatment of uncertain results. |
How to know whether the result is reliable
A lift estimate is useful only if the design supports a causal interpretation and the effect is precise enough for the decision. Positive numbers are not automatically persuasive evidence.
Read the estimate and uncertainty together
A study might report 8% relative lift, but if the confidence interval spans negative and positive effects, the data do not establish that the campaign created positive lift.
Google Ads also provides study-specific certainty of lift guidance, including intervals and interpretation. Its reporting conventions should not be confused with a universal statistical threshold.
An inconclusive test does not prove zero effect. It may lack power, have an effect below the detectable threshold, or reflect a genuinely small result.
Audit the experiment before making the claim
| Warning sign | What can go wrong | Validation step |
|---|---|---|
| Assignment ratio shifts | Assignment or tracking may be broken | Compare observed and planned group counts. |
| Groups differ beforehand | Baseline imbalance or flawed matching | Audit pre-period composition and outcomes. |
| Control receives ads | Treatment difference shrinks | Inspect exclusions and other campaigns. |
| Outcomes are missing | Observed lift is biased | Check event and CRM completeness. |
| Conversions arrive late | Study misses downstream outcomes | Use the defined conversion window. |
| Frequent unplanned peeking | False-positive risk rises | Follow the original analysis plan. |
| Markets influence one another | Geo test independence breaks | Review geographic spillover and clusters. |
Usermaven’s Measurement Trust Center can flag certain campaign-tracking, customer-matching, integration, and conversion-feedback issues before experimental results are interpreted.
These checks help assess measurement quality. They cannot establish that groups were randomized correctly or that the measured difference was caused by the campaign.
When incrementality testing is not worthwhile
An incrementality test may not justify its cost when the decision is minor, expected conversions are too few, or no credible control group can be created.
Low conversion volume: The study may need more data or time than the decision allows.
No credible comparison: Spillover, universal campaign exposure, or market differences could prevent an informative counterfactual.
Broken measurement: Missing conversion events or inconsistent definitions make both groups difficult to compare.
Limited decision value: A minor campaign change may not warrant a costly lift study.
In those situations, first improve outcome collection or use descriptive reporting for what it can legitimately show. Attribution can describe observed journeys; it does not become a causal experiment.
How to turn lift into budget decisions
A positive estimate is not a standing instruction to increase spending. It describes an intervention tested on a particular population, at a particular spending level, during a particular period.
| Finding | Interpretation | Next decision |
|---|---|---|
| Positive, precise, profitable | Tested marketing created useful value | Consider gradual scaling and retesting. |
| Positive but uncertain | Effect not firmly established | Collect more evidence or redesign the test. |
| Near zero with tight interval | Little meaningful lift under tested conditions | Reconsider spend or audience. |
| Negative with convincing evidence | Possible harm to measured outcome | Investigate and consider pausing. |
| Invalid experiment | Effect cannot be interpreted causally | Repair design before reallocating budget. |
Use incremental contribution rather than revenue alone when costs differ by product, customer, or channel. Scaling can also reduce marginal efficiency if new audiences respond differently.
Use paid ads attribution for ongoing campaign and journey reporting between tests, while using experimental results to judge whether attributed value includes genuinely additional business.
For B2B SaaS teams, connected acquisition, activation, and CRM outcomes can help interpret lead quality and downstream value. But attributed pipeline remains distinct from experimentally established incremental pipeline.
Review the outcome at the same unit and horizon used in the experiment. Do not turn a 30-day lift in demo requests into a claim about annual incremental revenue.
Incrementality vs. attribution and MMM
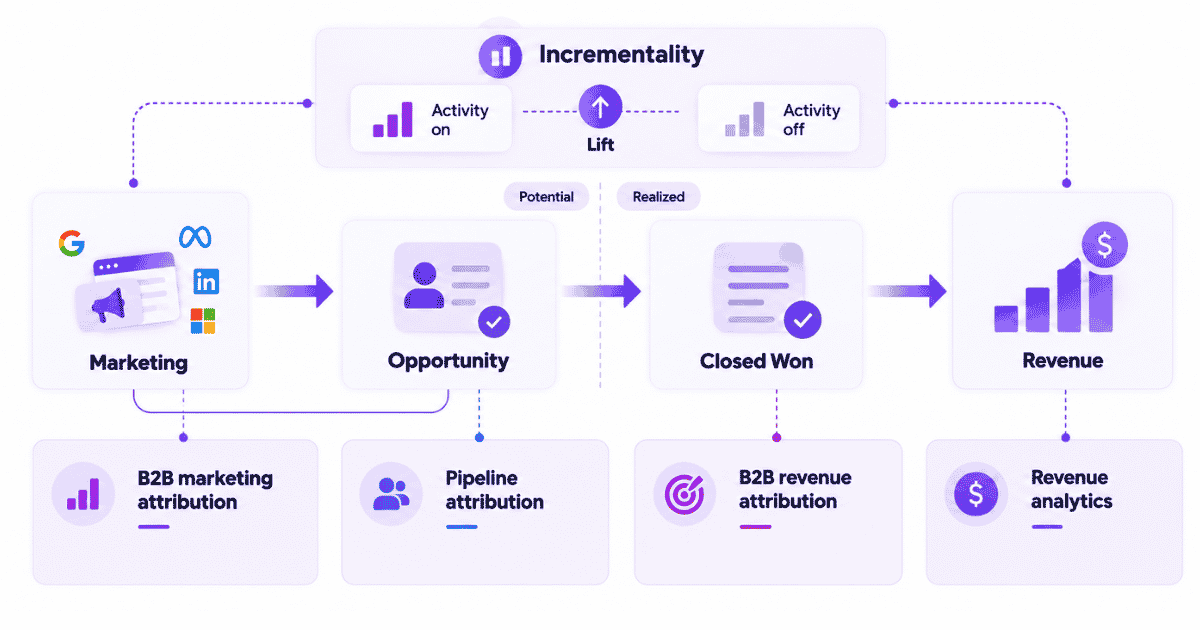
Marketing attribution allocates credit across recorded interactions. Incrementality testing estimates the additional outcome caused by a defined intervention. Marketing mix modeling estimates aggregate relationships and, under defensible assumptions, can support causal planning.
A useful marketing mix modeling readiness guide explains why historical data, spend variation, and assumptions matter when experiments are not the right primary tool.
| Method | Main question | Best use |
|---|---|---|
| Attribution | Which recorded interactions receive credit? | Ongoing journey and campaign reporting. |
| Incrementality | What changed because marketing ran? | Validating an important spending decision. |
| MMM | How do aggregate inputs relate to outcomes? | Broad budget allocation across time and channels. |
These approaches complement one another. The distinction between attributed revenue, counterfactual revenue, and iROAS is central to incremental revenue attribution.
Final verdict
Incrementality in marketing is most useful when it answers a real budget decision. Define the intervention, create a credible comparison, measure the right outcome, and report uncertainty before claiming lift.
Strong conversion and attribution data help teams prepare and interpret tests, but they do not replace the experiment. To see how recorded campaigns, conversions, and revenue can be connected, book a demo with Usermaven.
FAQs
1. What is incrementality testing in marketing?
Incrementality testing estimates additional outcomes caused by marketing using a credible counterfactual. Randomized holdouts or well-designed geographic experiments compare what happened with what would likely have happened without the intervention.
2. Is incrementality the same as A/B testing?
Both may use randomized comparisons, but marketing incrementality measures the causal impact of an intervention, often an advertising campaign. A routine page A/B test may instead compare versions of a design or user experience.
3. How long should an incrementality test run?
Duration depends on conversion volume, the expected effect, statistical power, allocation, seasonality, and conversion lag. Plan duration before launch instead of stopping as soon as an attractive lift estimate appears.
4. Can incrementality be negative?
Yes. A treatment group can perform worse than a valid control. A negative point estimate still needs uncertainty analysis before concluding that the campaign reduced conversions or revenue.
5. What is a good incremental lift percentage?
There is no universal target. Judge lift against its uncertainty, incremental costs, contribution margin, and the budget decision. A small reliable lift can be more valuable than a large but uncertain estimate.

Written by
Junaid Ahmed
Content Writer & Digital Marketer
Junaid Ahmed is a content and copywriter with 3+ years of experience creating research-driven content across SaaS, B2B, ecommerce, and digital marketing. He specializes in turning complex topics into clear, practical content that helps marketers better understand their challenges, evaluate solutions, and make informed decisions. His work spans educational content, industry insights, and actionable marketing guides.
All articles by Junaid →