Both are powerful tools for building customer-centric marketing strategies. But they’re often confused or used interchangeably. In this blog, we’ll unpack their differences and how to use them together for smarter marketing decisions.
What is customer segmentation, and why does it matter
Customer segmentation is the process of dividing your audience into smaller, more manageable groups based on shared characteristics.
Instead of treating all your customers as one monolithic group, segmentation helps you tailor your messages, offers, and experiences to fit their needs.
Common types of segmentation
Here are the main segmentation types marketers use to group their audiences and shape their strategies.
Demographic segmentation focuses on who the customer is. It includes factors such as age, gender, income, and education.
Geographic segmentation looks at where customers are located. This can include details like their country, city, or region.
Psychographic segmentation explores why customers buy. It considers their interests, values, attitudes, and lifestyle.
Behavioral segmentation examines how customers act, based on their purchase frequency, product usage, and engagement patterns.
Among these, psychographic and behavioral segmentation dig deeper to reveal the motivations and actions behind customer behavior.
Psychographic segmentation (understanding the “why”)
Psychographic segmentation divides customers based on psychological and emotional factors such as:
Values and beliefs
Attitudes and opinions
Interests and hobbies
Personality traits
Lifestyle choices
This type of segmentation helps you understand what truly influences customer decisions.
For example:
Two people might both be 30-year-old professionals living in New York.
But one buys luxury skincare for self-care, while the other chooses eco-friendly brands to align with sustainability values.
That difference lies in psychographics, not demographics.
Example: Psychographic segments in ecommerce
Segment
Motivation
Example Behavior
The sustainability seeker
Cares about eco-friendly living
Buys from brands using recycled packaging
The trend chaser
Loves staying ahead of fashion trends
Regularly buys limited-edition drops
The budget-conscious
Prioritizes savings and value
Uses coupon codes, buys during sales
Psychographic segmentation helps brands shape their messaging tone, brand positioning, and even product design.
Behavioral segmentation (understanding the “what”)
While psychographic segmentation focuses on why customers act, behavioral segmentation looks at what they actually do.
It categorizes users based on measurable interactions such as:
Purchase frequency
Browsing or engagement behavior
Usage patterns
Customer loyalty
Response to marketing campaigns
Behavioral segmentation is data-driven and grounded in observable actions.
Example: Behavioral segments in SaaS
Segment
Behavior Pattern
Example
Frequent Users
Log in daily, use multiple features
Power users in analytics tools
Churn Risks
Declining engagement, fewer logins
Free-trial users nearing expiration
Feature Adopters
Try new features early
Early adopters valuable for beta testing
Inactive Accounts
Haven’t logged in for weeks
Targets for reactivation campaigns
When you understand what drives your customers, it’s just as important to see how they behave. That’s where behavior tracking comes in. By analyzing user actions, you can uncover valuable clues about their intent and readiness to convert.
With Usermaven’s funnels, you can visualize every step of that journey, from the first click to the final conversion. This helps you identify where users drop off and what keeps them moving forward.
Psychographic vs. behavioral segmentation: Key differences
Segmenting by user goals or motivations (e.g., productivity-focused vs. collaboration-focused)
Segmenting by user engagement (e.g., active vs. inactive users)
Impact on Marketing Strategy
Shapes brand voice, creative messaging, and positioning
Shapes timing, channel selection, and targeting optimization
How Usermaven helps connect psychographic and behavioral data
Segmentation only works when it’s actionable, and that’s where Usermaven excels.
1. Behavioral tracking
Usermaven automatically tracks how users interact with your website or product from page visits and clicks to feature usage and conversions. This data helps you see which behaviors drive retention and which ones signal churn.
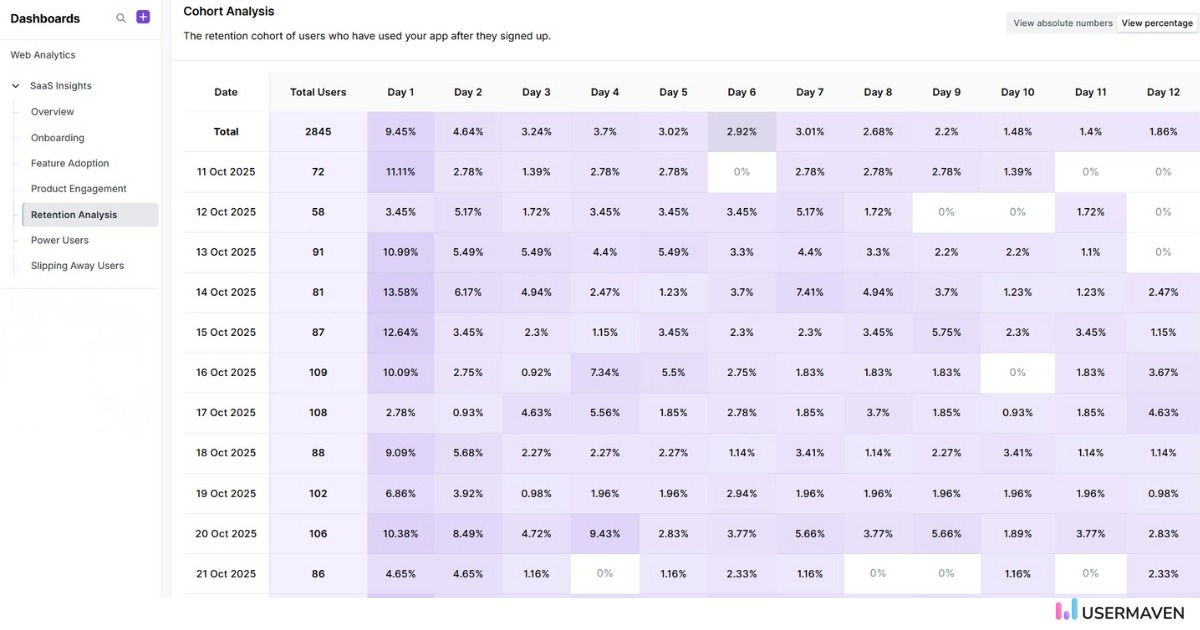
With these insights, you can run cohort analysis to see how different user groups behave over time and use that data to boost engagement rate and growth.
2. Attribution modeling
Psychographic targeting often involves several touchpoints throughout the customer journey, from awareness to decision-making. To understand how these touchpoints contribute to conversions, you need visibility into both emotional and behavioral triggers.
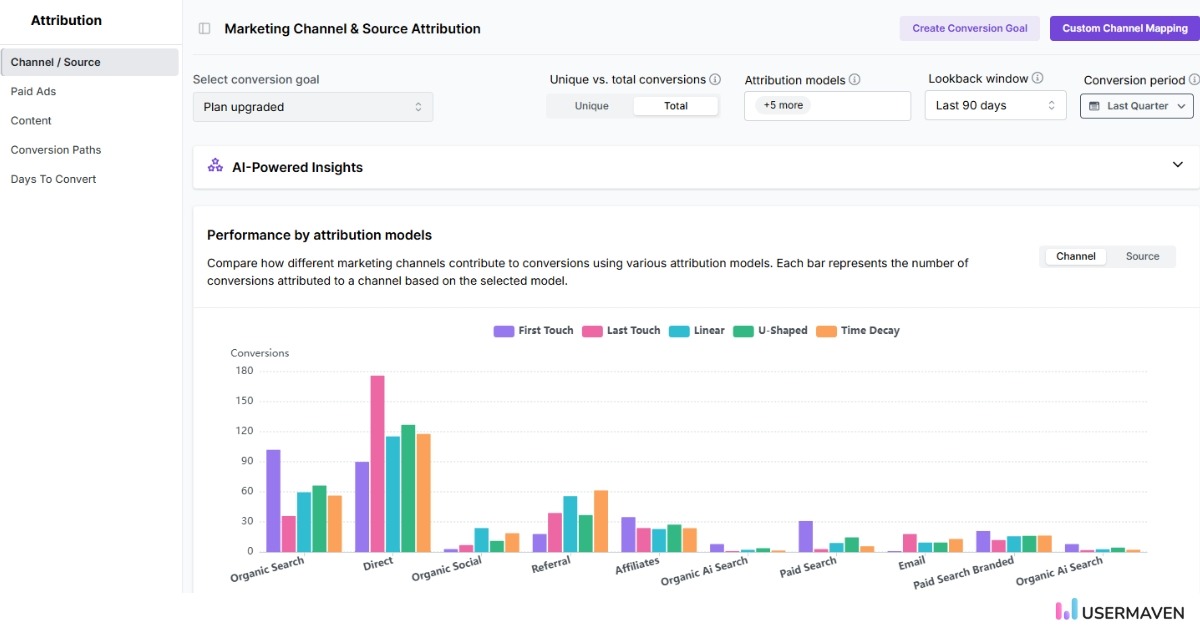
Usermaven’s multi-touch attribution provides that clarity by showing which campaigns connect emotionally and which drive the most action. This helps you invest in the channels and messages that truly influence conversions.
3. Funnels and insights
Visualize user journeys across psychographic and behavioral dimensions:
Which psychographic personas complete the checkout process fastest?
Which behavioral groups respond best to emotional messaging?
Usermaven helps answer these questions, combining data science and human psychology.
Do you think you’re a good marketer?
Let’s put your skills to the test. Take the Usermaven marketing analytics quiz to test how well you understand metrics, attribution, and data-driven decision-making.
How to collect psychographic and behavioral data
Here’s how to gather each type of data effectively.
Collecting psychographic data
Customer surveys and interviews
Feedback forms asking about goals, challenges, or values
Social listening (analyzing language and tone in comments or reviews)
Tracking engagement with content themes (e.g., “eco-lifestyle” vs. “tech trends”)
When combined, these methods give you a 360° view of your users; who they are, what they care about, and what they do.
Use case: SaaS segmentation in action
Let’s look at how psychographic and behavioral segmentation work together in a real-world SaaS scenario.
Company: A productivity SaaS platform helping teams set goals, automate tasks, and manage projects.
Challenge: The marketing team noticed that user engagement was uneven across different features. Some users were highly active with goal tracking, while others relied heavily on automation tools. The company wanted to understand why these patterns existed and how to tailor campaigns for each group.
Segmentation insights:
Psychographic segmentation revealed two distinct audience types:
The Achievement Seekers: Motivated by progress, recognition, and hitting milestones.
The Practical Optimizers: Motivated by saving time, simplifying workflows, and reducing stress.
Behavioral segmentation supported these findings through usage data:
The Achievement Seekers consistently used the goal-tracking and performance dashboard features.
The Practical Optimizers interacted more with automation workflows and scheduling integrations.
How Usermaven helped:
Using Usermaven’s attribution and funnel analysis, the team could visualize how each segment moved through the customer journey. This is exactly what teams look for in the best marketing attribution software: clear insight into what drives movement and conversion.
The data revealed that:
Campaigns centered around “Track your wins daily” drove 34% higher conversions among Achievement Seekers.
Campaigns promoting “Automate your routine” delivered a 41% lift in conversions with Practical Optimizers.
Result: By combining psychographic motivations with behavioral data, the brand refined its messaging, optimized its ad spend, and improved both conversion rates and user retention.
Final thoughts!
Strong segmentation helps you truly understand your audience and create marketing that connects. When you combine psychographic and behavioral insights, you learn what motivates your customers and how they behave. This understanding lets you create messages that feel personal and build real relationships.
With Usermaven, you can turn these insights into action. It’s a powerful website analytics tool with advanced attribution and funnel features that help you track user journeys, find behavior patterns, and measure what’s working. More importantly, it empowers you to connect emotional drivers with behavioral data, turning raw numbers into strategies that inspire results.
As you plan your next marketing strategy, don’t stop at asking who your audience is. Ask instead: “Why do my customers act this way, and how can I measure it?”
That’s how you create smarter marketing and stronger growth.
FAQs
1. What is the main benefit of combining psychographic and behavioral segmentation?
Combining both helps you understand not only what your customers do but also why they do it. This leads to more accurate targeting, personalized messaging, and higher conversion rates.
2. How is psychographic segmentation data collected ethically?
Psychographic data should always be collected with transparency and consent through voluntary surveys, feedback forms, or social media insights. Respecting privacy builds trust and ensures compliance with data protection laws.
3. Can small ecommerce businesses use psychographic and behavioral segmentation effectively?
Yes. Even with limited data, small brands can analyze purchase patterns, survey customers about preferences, and use analytics tools like Usermaven to uncover meaningful insights for targeted campaigns.
4. What’s the biggest mistake marketers make with segmentation?
Many marketers rely only on demographic or behavioral data and ignore psychographic insights. This leads to campaigns that miss emotional connection and fail to resonate with customers’ true motivations.
5. Can psychographic and behavioral segmentation improve customer retention?
Absolutely. Understanding what motivates customers and how they interact with your product helps tailor experiences, nurture loyalty, and reduce churn.
Triple Whale is a popular ecommerce analytics and attribution platform for Shopify and DTC brands. It helps teams track store performance, ad spend, attribution, and customer insights in one place. But its pricing isn’t a single flat monthly cost. Triple Whale pricing changes based on annual GMV, plan type, and the level of measurement a […]
A growing marketing team requests pricing from three attribution vendors. One quotes a number through an interactive calculator that jumps as they adjust a slider. Two others say to contact sales with no figure attached at all. Three conversations later, the team still does not know whether attribution software costs $80 or $8,000 per month […]
Marketers like to think of the buyer’s journey as linear: someone finds your website through Google, signs up for your newsletter, and buys your product. Except, in real life, it looks more like this: a new subscriber opens your welcome email while commuting to work, gets distracted, and forgets about your offer. A few days […]