You can usually tell when a product “clicks” in the first few minutes. Not from what people say, but from what they do next.
They build their first dashboard. They invite a teammate. They come back the next morning to check one number.
That’s the moment when product stickiness stops being a concept and starts showing up as a habit forming in real time.
Let’s dive into what drives that behavior.
What is product stickiness?
Product stickiness is how often people return to your product as part of their routine. It’s the difference between a one-time try and a tool they reach for without thinking.
To put a number on that routine, teams often use a simple product stickiness formula: DAU/MAU.
Product stickiness (%) = (Daily Active Users ÷ Monthly Active Users) × 100
Think of it as the product becoming the default place to do a specific job.
Here’s what product stickiness looks like in practice:
A finance lead opens the same saved report every Monday and shares it with the team.
A sales manager checks one dashboard after standup and updates a few deals.
A support lead reviews a weekly trend, tags it, and drops it into a team update.
When you see patterns like these, you’re looking at product stickiness. It’s when people return consistently to do the same clear, repeatable action.
When product stickiness is worth tracking
Measuring product stickiness is useful when “coming back” is part of the value. If your product is meant to be used only occasionally, a low stickiness number might be perfectly normal.
A few situations where it’s a strong fit:
The product has a natural rhythm. Think daily check-ins, weekly reviews, or ongoing workflows. If the value builds through repeated use, stickiness is one of the clearest signals you’re on the right track.
You sell ongoing value. Subscriptions usually benefit most here, because regular use often lines up with renewal. Freemium products can use stickiness to see whether free users are forming habits that typically lead to upgrades.
You’re early or scaling. Early on, stickiness helps you validate that there’s a core action worth coming back for. In growth, it helps you spot which behaviors (and segments) are creating momentum.
And sometimes it’s just not the most helpful lens:
The value is tied to a moment, not a routine. If customers use your product for a specific event or a single task, returns will be naturally spaced out, even when the product is doing its job.
The “right” cadence is rare by design. Quarterly or annual products can look “unsticky” on DAU/MAU, even when usage is perfectly healthy for the category.
Keep it simple. Measure product stickiness when repeat behavior equals success. When it does not, choose a metric that matches how customers actually use the product.
Why does product stickiness matter
Product stickiness is a reality check. It connects everyday usage patterns to outcomes you can act on.
Here’s where that day-to-day usage turns into real impact:
Increase lifetime value (LTV) When people keep coming back, they discover more value over time. If weekly users start using a second core feature, that’s a signal to guide them toward higher-value plans or add-ons.
Lower customer acquisition cost (CAC) Sticky products rely less on constant re-acquisition. If referrals and organic signups rise from active accounts, it’s a sign your existing users are doing part of the growth work for you.
Identify power users early People who repeat the same action multiple times in their first few weeks often become long-term users. When you see that pattern, study what they do differently and make that path easier for others.
Spot users who are slipping away A break in a typical usage rhythm is an early warning. If a weekly user misses two cycles, that’s a cue to check what blocked their return.
Eliminate hidden friction Drop-offs between repeat sessions point to friction you can fix. If users return but skip a step they used to complete, review what changed in that flow.
Validate your product assumptions For SaaS teams, Usermaven works as SaaS attribution software that connects acquisition source, product usage, feature adoption, and retention signals, so you can see which channels bring users who actually build a repeat habit.
Turn visitors into loyal customers
*No credit card required
Product stickiness vs. retention: What’s the difference?
Retention and product stickiness can look similar on a chart, but they answer different questions.
Retention is the likelihood that users will return over time. Product stickiness is about how much meaningful activity happens when they show up, and how often that core action repeats.
Let’s see how they show up side by side.
Aspect
Retention
Product stickiness
What it measures
The percentage of users/accounts that return after a time period (day 7, week 4, month 3)
The depth and frequency of usage during each visit (how often they show up and what they do)
Time horizon
Long-term return behavior
Short-term activity patterns
Core question
“Do people still use this later?”
“Do people have a reason to keep coming back?”
What “good” looks like
A steady share of users returning each period
Users doing the same core actions consistently over time
Example
40% of trial accounts are active in week 4
Active accounts check a key dashboard 3x/week and share it weekly
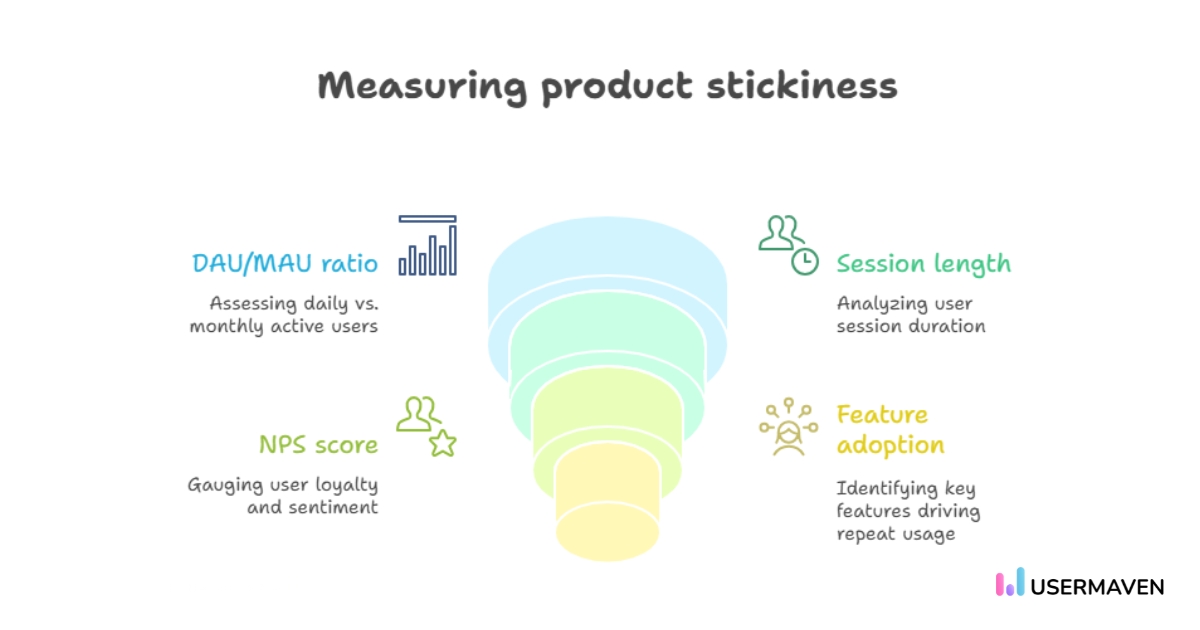
How to measure product stickiness
Measuring product stickiness is about finding a few signals you can trust.
Not vanity metrics but numbers that tell you whether people are returning, and getting enough value to keep the pattern going.
DAU/MAU (Daily Active Users / Monthly Active Users)
DAU/MAU is the classic stickiness ratio. It tells you what share of your monthly users are showing up on a typical day.
A quick way to interpret it:
If DAU/MAU trends upward, your product is becoming part of a routine.
If MAU grows but DAU stays flat, you’re adding users who aren’t returning frequently.
Here’s an example: If you have 10,000 MAU and 2,000 DAU, your DAU/MAU is 0.2 (20%). That’s a useful baseline you can compare week to week.
Session length
Session length is the amount of time users spend actively engaged with your product during a single session. It helps you understand whether visits are quick check-ins or deeper working sessions.
What to look for:
Longer sessions can mean people are getting real work done.
Shorter sessions can also be healthy if the product delivers value fast.
Context is key. If your product is built for quick monitoring, a 60–90 second session might be perfect. If it’s built for building and configuring, a 10–15 minute session may be expected.
NPS (Net Promoter Score)
NPS is a short survey that asks one core question: “How likely are you to recommend this product to a friend or colleague?” People answer on a 0–10 scale, and that score gives you a simple read on loyalty and sentiment.
NPS doesn’t measure product stickiness directly, but it explains the why behind your usage patterns. It tells you whether repeat usage comes with real confidence, or whether people are returning while still feeling “meh” about the experience.
Here’s how to use it alongside stickiness:
If product stickiness is trending up and NPS is rising too, your repeat loop is landing well. People are returning and feeling good about it.
If product stickiness is up but NPS drops, usage is happening, but the experience likely has rough edges. Look closely at the core workflow people repeat.
Feature adoption
If DAU/MAU tells you people are showing up, feature adoption tells you what they’re coming back to do. This is where product stickiness becomes specific. Feature adoption metrics highlight the actions that lead to repeat behavior, not just visits.
Focus on the few features that represent real value, not every click.
Track how quickly new users reach those features after signup.
Compare adoption paths between accounts that stay active and accounts that start drifting.
A quick note
If you want to track a single metric for product stickiness, make it DAU/MAU. It’s the clearest indicator of whether monthly users are forming a habit.
Session length, feature adoption, and NPS still matter, but think of them as supporting signals. They often explain why DAU/MAU is moving and what to adjust to lift it.
Also worth tracking alongside DAU/MAU:
Lness: How often users return in a period. Example: L20/30 = % of users who visited at least 20 times in a month.
Open rate: For newer products, the percentage of people who actually start using the product after installing it.
What is a good stickiness ratio?
A “good” product stickiness ratio depends on the kind of product you’re building and how often it’s meant to be used. The same DAU/MAU number can be a great sign in one category and unrealistic in another.
In B2C, stickiness ratios are often higher. Social apps like Instagram or TikTok are built for frequent check-ins, so it’s common to see DAU/MAU in the 20% to 50% range (and sometimes higher for actual daily habit products).
In B2B, the bar is different because the job is different. Most tools are used on a work rhythm, not the kind of constant check-in loop you see in consumer apps. As a rough reference:
10–15% DAU/MAU can mean “used when it’s needed”
20%+ usually signals the product is part of a regular workflow
30%+ is strong product stickiness for most B2B tools
Two quick context checks that make this instantly more useful:
If your product is meant for weekly use (reports, reviews, planning), a lower DAU/MAU might still be healthy. In that case, WAU/MAU can be a better read on product stickiness.
If DAU/MAU drops while MAU rises, it often means new users are joining but haven’t yet formed a repeat habit. That’s a cue to tighten the path to the second and third “value” moment.
Benchmarks are helpful for orientation. Your trend line is what you manage. If product stickiness is moving up steadily, you’re building a rhythm users want to keep.
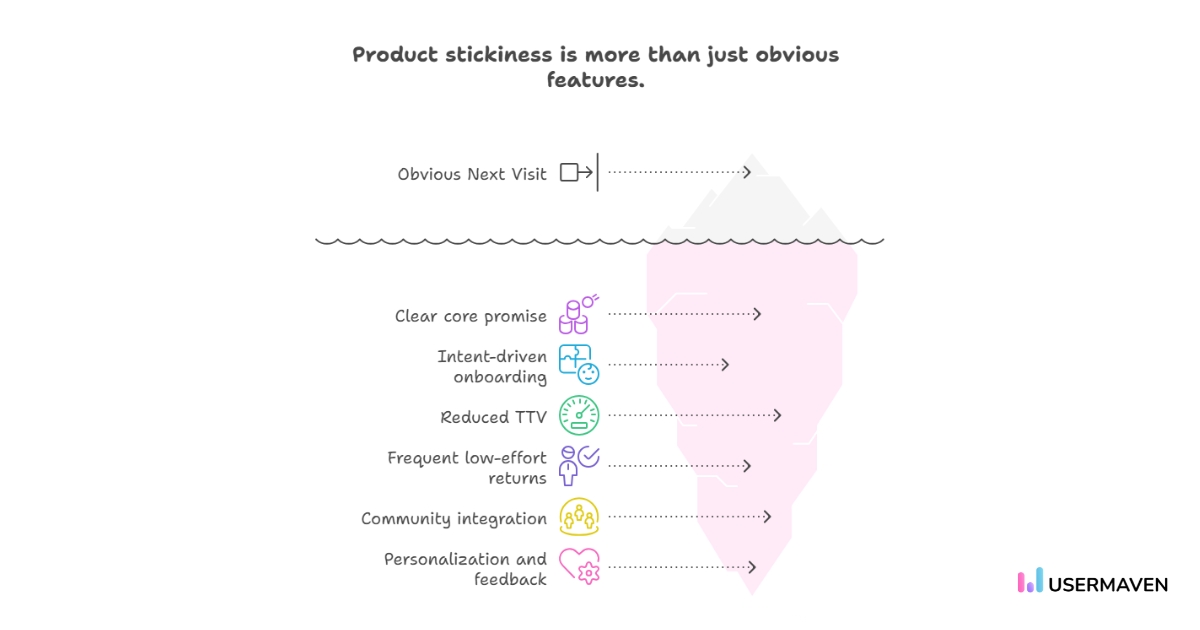
How to increase product stickiness
Boosting product stickiness usually comes down to one thing: making the “next visit” feel obvious. People return when they know what they’ll get, how fast they’ll get it, and what to do next.
Make the core promise instantly obvious
People don’t return to “a platform.” They return to complete a job they care about.
Make the job clear in the product itself:
A project tool should make the “next step” visible the moment you log in.
An analytics tool should surface “what changed since last time” without extra clicks.
If you see users exploring lots of pages but not repeating a core action, tighten the promise. Your value may be too broad to become a habit.
Shape onboarding around the user’s intent
The fastest way to build product stickiness is to get people to their first win rather than give them a tour of everything.
A simple approach: ask one or two questions up front (role, goal), then shape the first session around that.
A marketer sees campaign views first.
A founder sees high-level health metrics first.
A sales lead sees pipeline or conversion views first.
The goal is a first session that feels like “this was made for me.”
Reduce time to value (TTV) by removing steps
Shorter TTV usually comes from fewer clicks, fewer choices, and fewer empty screens.
A few concrete ways to do that:
Start with a useful default instead of a blank state.
Preload sample data or templates so users can see an outcome immediately.
Save the next logical step for them (so session two starts halfway done).
Build for frequent, low-effort returns
If product stickiness is the goal, design for quick check-ins that still feel valuable.
This usually comes down to a few basics:
Saved views and shortcuts to “my usual”.
A clear “since your last visit” update.
A one-click action that moves work forward (share, export, assign, schedule).
Make the community part of the product
You don’t need a massive public community to improve product stickiness. You just need places where users can learn from each other and bring others into the workflow.
Good examples:
Give users a space to swap tips and fixes (a forum, group, or a community hub with real Q&A).
Make collaboration and sharing effortless so one person’s output becomes another person’s reason to log in.
Reward advocacy with useful perks like early access or extra capacity.
Close the loop with personalization and feedback
Personalization works best when it saves time. The product should remember how someone works and make the next session feel familiar.
Focus on the essentials:
Default to their world (last-used view, saved filters, recent items).
Ask for feedback right after a key action, when the experience is fresh.
Close the loop by shipping small improvements and making it obvious you acted on input.
Then do the part most products skip: show users that feedback turns into fundamental changes. That sense of ownership is a quiet driver of product stickiness.
How Usermaven supports product stickiness
Product stickiness gets easier to work with when you can move from “people seem active” to a clear picture of repeat behavior. Usermaven fits that job well because it’s built for product teams who want to track product usage without turning analysis into a week-long project.
It’s especially helpful when you’re trying to answer questions like:
What do returning users actually do?
Which behaviors repeat?
Where does a routine start to fade?
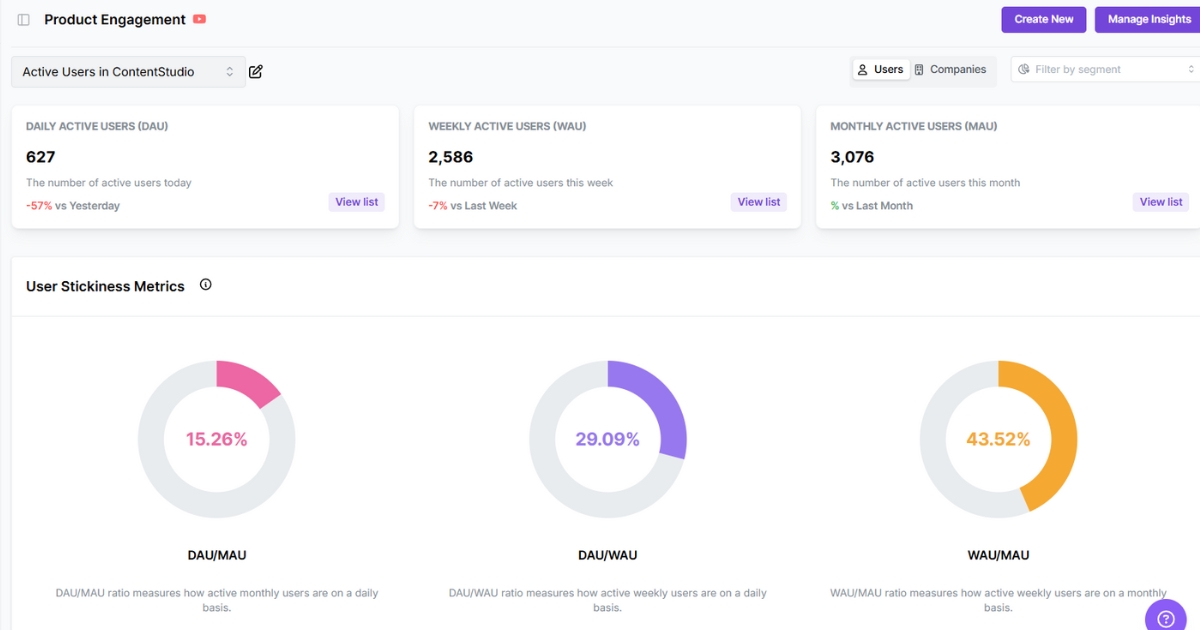
Usermaven helps you track product stickiness in a way that’s easy to act on. First, it makes the usage rhythm obvious. You can view DAU, WAU, and MAU together, then check the trends to see whether the return pattern is steady or just a short-lived bump.
For B2B teams, the Users vs. Companies toggle is a big deal. Sometimes individuals rotate, but accounts stay active. Seeing both keeps your stickiness read honest.
Then you get the stickiness ratios in the same place, ready to compare:
DAU/MAU to understand daily habit strength
DAU/WAU to see how often weekly users show up
WAU/MAU to spot whether monthly users are becoming weekly regulars
The best part is you can slice all of this by segment. That’s where product stickiness gets useful. Compare new users vs. activated users, free vs. paid, or any persona that matters.
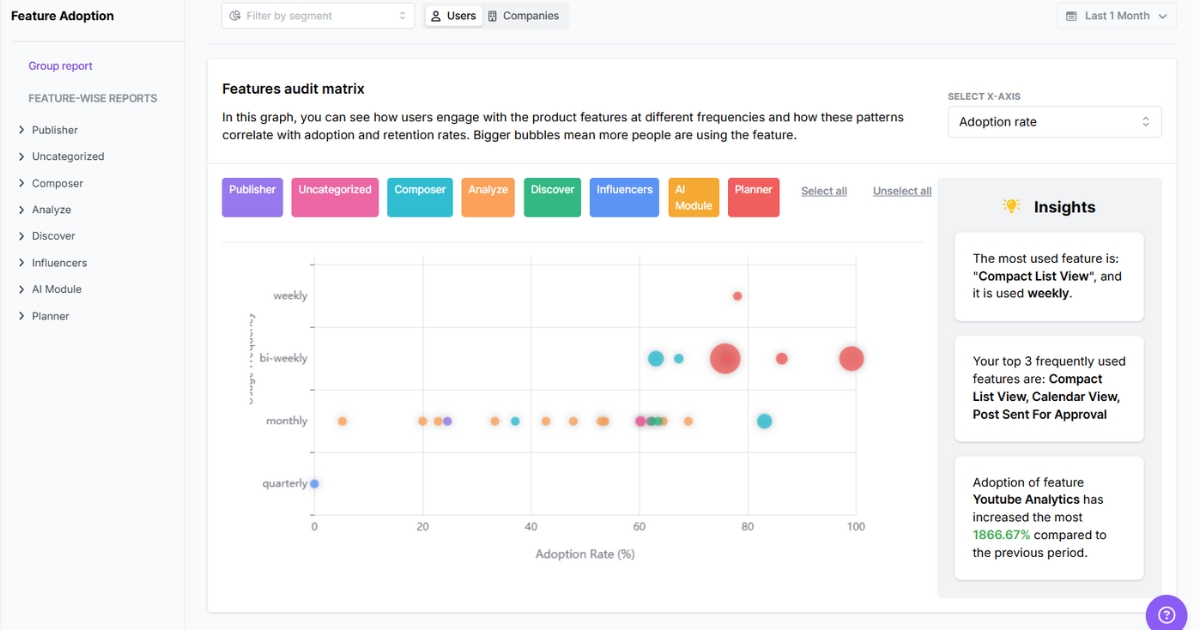
Then you can connect that return cadence to feature adoption. Instead of guessing what drives stickiness, you can see which features people:
try once, then drop
adopt quickly, but rarely return to
keep using at a weekly or bi-weekly rhythm
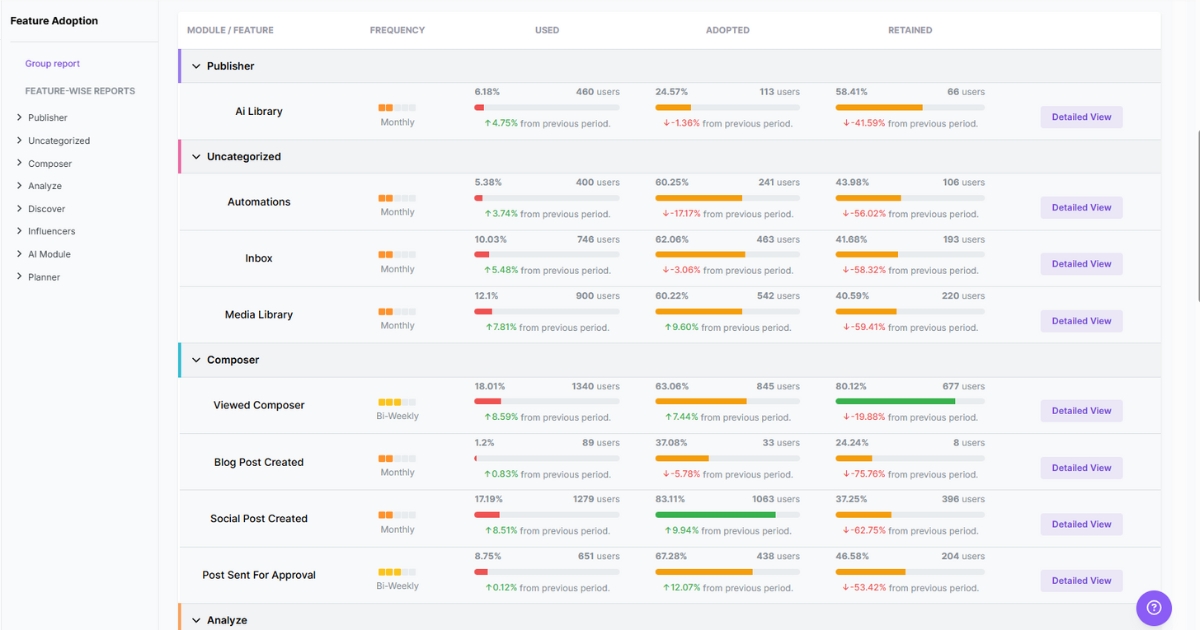
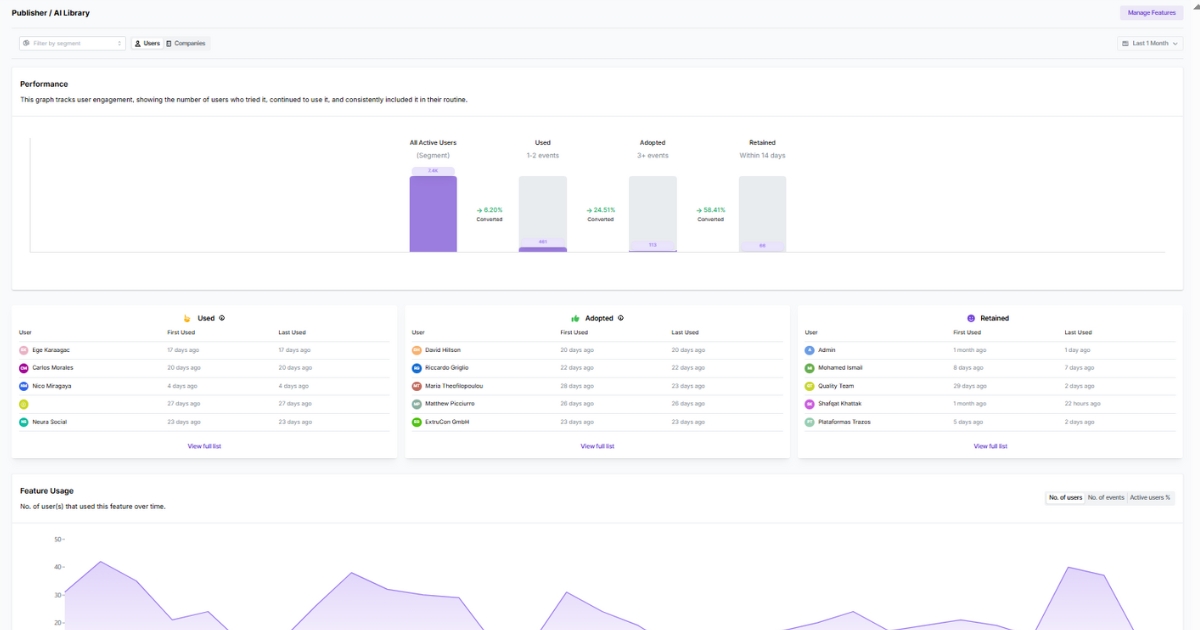
Usermaven surfaces this with a feature view that combines usage frequency with adoption, so you can spot the features that are actually becoming part of someone’s routine. If you want the numbers, the table view shows used, adopted, and retained, plus how each has changed over the last period.
Click into a feature to follow the progression step by step. That clarity makes decisions simpler: what to improve, what to surface more often, and what to stop treating like a priority.
It also adds an essential layer of context: more activity is not automatically more value. Sometimes, more time in the product means people are getting more done. Other times, it can mean people circling around, repeating steps, or clicking through extra screens just to reach the same outcome. When you pair engagement metrics with feature adoption and retention, you can separate real momentum from “busy time” driven by unnecessary navigation.
Final thoughts
Product stickiness is the difference between a product people try and a product people return to. It’s repeatable value, delivered often enough that usage becomes the default.
The moment you see it, decisions get easier. You stop debating “more features” and start tightening the loop people already repeat, so the next session begins with momentum instead of setup.
However, to make those calls confidently, you need a clear view of what users actually do across sessions, from first visit to repeat use. With product analytics in Usermaven, teams can connect usage patterns, feature adoption, engagement signals, and retention trends, so they can understand what keeps users coming back and where momentum starts to drop.
Connect with Usermaven today to see what keeps users coming back and where the momentum drops. Start a free trial or book a demo!
FAQs about product stickiness
1. How is product stickiness different from user stickiness?
Product stickiness refers to the qualities that make a product habit-forming or deeply integrated into a user’s daily life. User stickiness is about user behaviors like routinely choosing the product even when other options exist or frequently engaging with its features.
2. What core elements actually drive product stickiness?
Product stickiness is driven by habit formation, recurring value delivery, low switching costs, and emotional or workflow dependencies that make the product hard to replace.
3. What does a real-world example of product stickiness look like in practice?
A team messaging app becomes sticky when it turns into the default place people coordinate work. Teammates check it multiple times a day because key updates, decisions, and files reliably live there, so returning feels necessary and instantly applicable.
4. Can product stickiness be designed intentionally, or does it emerge naturally?
Product stickiness can be intentionally designed by aligning core value delivery with repeatable user actions, but it ultimately emerges from consistent real-world usage rather than one-time design decisions.
5. How does stickiness work differently in B2B vs. B2C?
B2B stickiness often comes from workflow fit, team adoption, integrations, and ROI proof; B2C more from personal utility, identity, entertainment, or habit loops.
6. Why is product stickiness especially critical for subscription-based products?
Product stickiness is critical for subscription-based products because frequent perceived value justifies ongoing payment, reducing churn and increasing lifetime value without relying solely on pricing or contracts.
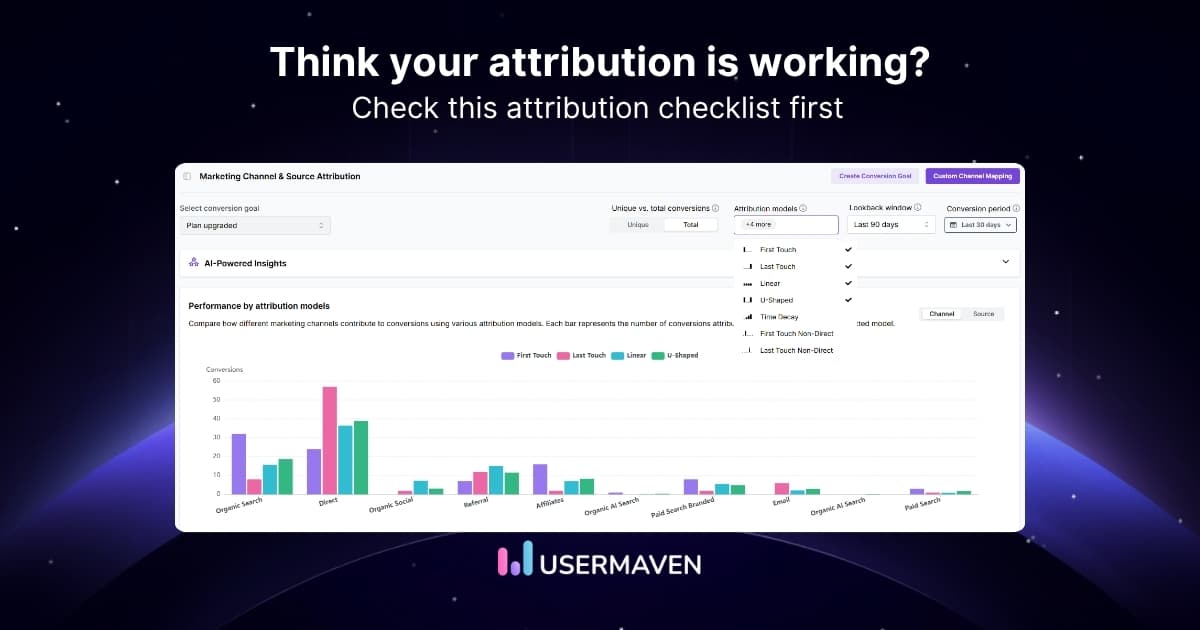
A customer may discover a business through Google, return from LinkedIn, click an email, and finally convert during a direct visit. Source attribution determines which of those specific origins receives credit for the outcome. The source is the identifiable origin of a visit, such as Google, LinkedIn, a newsletter, a partner website, or direct traffic. […]
A single conversion can involve several Google Ads interactions before it happens. A non-brand search click, a YouTube view, a remarketing ad, and a branded search click might all occur before someone buys, and the account still needs a rule for deciding which of those interactions gets credit. Attribution is not the same thing as […]
You’ve been there. It’s Monday morning. Campaign dashboards are open, ad platforms show glowing results, but when you try to piece it all together, the story doesn’t quite add up. Which channel did it? Was it your retargeting ad? The influencer campaign? Or that new email series you launched last week? That’s the moment every […]