Marketing campaigns can generate impressive signup numbers without bringing in customers who find lasting value. That is why marketers need to look beyond the initial conversion and understand what people do once they start using a product. Marketing attribution software helps connect acquisition sources with later customer outcomes, while product analytics supplies the behavioral context.
Product analytics in marketing means using events, features, funnels, and retention patterns to inform decisions about audience targeting, messaging, onboarding, lifecycle communication, and acquisition spend. The goal is not to turn every marketer into a product manager. It is to evaluate the quality of the customers marketing attracts.
Key takeaways
- Acquisition quality: Evaluate channels by activation, paid conversion, and retention, not just visitors or signups.
- Better messaging: Feature adoption and customer feedback can reveal which benefits deserve greater emphasis in campaigns.
- Useful segments: Connect lifecycle stages and product behaviors with acquisition sources to create meaningful audiences.
- Reliable measurement: Define events, identities, cohorts, and attribution windows before comparing channel performance.
- Actionable analysis: Investigate observed patterns, test changes, and measure outcomes rather than assuming correlation proves causation.
What is product analytics in marketing?
Product analytics in marketing is the use of customer behavior inside a digital product to improve marketing decisions. It connects what happened before signup, such as an ad click or organic visit, with what happened afterward, such as onboarding completion, feature adoption, subscription upgrade, or continued usage.
For a SaaS business, this might mean comparing whether customers from organic search and paid social reach a clearly defined activation milestone. For an ecommerce app, it could mean studying whether people acquired from different campaigns become repeat purchasers.
This article focuses on the marketing application of product data. The wider product analytics discipline also covers event design, user paths, experimentation, and product management decisions.
How product analytics complements marketing analytics
Marketing analytics evaluates acquisition and campaign outcomes. Product analytics evaluates what users do inside the experience. Connected together, they help teams follow a customer beyond an initial visit or registration.
| Question | Marketing analytics view | Product analytics contribution |
|---|---|---|
| Which channel attracts interest? | Campaign visits and signups | Whether those signups become active users |
| Which campaign converts? | Lead or signup conversion | Activation and first meaningful actions |
| Which audience is valuable? | Cost and attributed conversions | Engagement, retention, and product usage |
| Which message works? | Click-through and landing-page conversion | Whether users adopt the promised capability |
A dedicated product vs marketing analytics comparison explains the disciplines in greater depth. For marketers, the practical takeaway is that a channel’s signup count is only the beginning of its performance story.
Attribution also answers a different question from product analytics. An attribution model distributes conversion credit among eligible marketing touchpoints; it does not independently establish why a user adopted a feature or whether a campaign caused long-term retention.
Why product behavior matters after acquisition
Imagine two hypothetical SaaS campaigns over the same reporting period. Both generate registrations, but the resulting product behavior differs.
| Metric | Campaign A | Campaign B |
|---|---|---|
| Signups | 400 | 200 |
| Activated users | 60 | 100 |
| Signup-to-activation rate | 15% | 50% |
Campaign A has twice as many signups. Campaign B has more activated users and a substantially stronger activation rate. A marketer optimizing only for lead volume might miss this difference.
What the numbers do not prove: Campaign B is not necessarily more profitable. The team still needs campaign cost, trial-to-paid conversion, retention, and revenue information. Different acquisition sources may also bring different account types and need a fair comparison window.
The useful question changes from Which channel acquired the most people? to Which channel brought customers who reached meaningful value and stayed?
7 ways marketers can use product analytics
Product behavior can inform decisions across acquisition, messaging, onboarding, and retention. These seven use cases show how marketers can turn that evidence into action.
1. Evaluate acquisition quality beyond signups
Track the acquisition source associated with each new user or account, then compare activation, paid conversion, and retention across comparable cohorts. A high-volume channel may perform poorly after signup, while a smaller channel may attract customers who use the product more consistently.
Marketing action: Compare cost per activated account and cost per paying customer before reallocating budget. A cohort-based view avoids judging a new campaign against an older campaign that has had more time to convert.
Usermaven’s product analytics software connects product events and retention analysis with acquisition context, making this a natural application for cross-functional growth teams.
2. Improve product messaging and positioning
Usage data can show which features existing customers actually adopt, which workflows they revisit, and where certain customer segments struggle. Marketing teams can use this evidence to form hypotheses about benefits that might deserve more attention in ads, landing pages, and email campaigns.
Strong product positioning also needs qualitative evidence. A frequently used feature may be essential, but usage alone does not reveal why a customer chose the product or which message persuaded them.
Marketing action: Combine behavior with interviews, support feedback, and campaign tests. Refresh a message only after checking that the proposed benefit matches customer needs and the actual product experience.
3. Build behavior-based audience segments
Not all customers who sign up need the same communication. Someone who created an account but never completed setup has a different need from an established user who adopted several advanced capabilities.
By combining event history, recency, frequency, and relevant customer attributes, marketers can distinguish onboarding, engaged, dormant, and potentially expansion-ready groups. SaaS customer segmentation helps teams define these groups around shared behaviors and needs.
Marketing action: Use product engagement to inform audience definitions and coordinate messaging with the teams or systems responsible for delivery. Behavioral segmentation does not mean an analytics platform automatically sends lifecycle campaigns.
4. Improve onboarding and activation communication
A marketing promise can be undermined if new users fail to reach their first meaningful outcome. Product funnels reveal where users leave onboarding, how long progress takes, and which customer groups are affected.
As IBM notes, customer journey mapping considers interactions across the customer experience. In a SaaS setting, marketers can contribute by aligning acquisition messages, welcome content, and activation guidance with the actions that actually matter.
Marketing action: Study a funnel analysis of registration, setup, first key action, and initial value. Then test clearer onboarding communications or revised expectations. A drop-off is evidence of a problem to investigate, not proof of its cause.
5. Make lifecycle and re-engagement more relevant
Marketing’s role may continue well after the first purchase. Feature milestones, declining usage, and return behavior can inform educational content, release announcements, and re-engagement priorities.
For example, customers who completed basic setup but never explored a relevant capability might benefit from a focused tutorial. Customers who have stopped returning may need a different approach, and some should receive no marketing communication at all.
Marketing action: Compare engaged and inactive cohorts, confirm appropriate communication permissions, and measure whether campaigns are followed by meaningful product actions rather than opens alone. Product usage analytics helps teams evaluate whether those communications lead to meaningful actions.
6. Identify potential expansion opportunities
Account-level activity can help B2B SaaS teams investigate whether customers are adopting additional features, expanding to more users, or reaching usage patterns associated with greater value. These are useful signals for conversations between product, sales, and customer success teams.
They are not guaranteed upgrade predictions. Usage is one input alongside plan limits, contract timing, customer goals, and direct conversations. The customer journey analytics perspective helps keep these signals in the context of a broader relationship.
Marketing action: Develop relevant education or upgrade campaigns for eligible segments and measure the resulting product behavior and commercial outcomes. Avoid assuming that greater feature use always causes expansion.
7. Make marketing budget decisions with downstream outcomes
The final use case brings acquisition and product information together. Rather than ranking channels only by cost per signup, teams can compare acquisition costs against activation, paid conversion, and attributed revenue over consistent windows.
This can change how a marketing department prioritizes campaigns, but budget changes still require enough data, sensible attribution assumptions, and a review of profitability.
Marketing action: Use channel-level cohort comparisons, examine customer quality, and test a controlled budget adjustment where feasible. Keep an eye on whether new spending increases total outcomes rather than simply shifting attribution credit.
Which product analytics metrics matter to marketers?
The best metrics describe meaningful movement after acquisition. Different business models need different definitions of success, so teams should agree on their denominators and reporting periods before building dashboards.
| Metric | Practical definition | Marketing use |
|---|---|---|
| Activation rate | Activated users in a signup cohort / eligible signups | Compare quality by source |
| Time to value | Time between signup and a defined first-value event | Evaluate onboarding expectations |
| Feature adoption | Eligible users adopting a feature / eligible users | Inform benefit-led content |
| Cohort retention | Cohort members who meet the return definition over time | Evaluate longer-term acquisition quality |
| Trial-to-paid conversion | Trial accounts becoming paying accounts / eligible trial accounts | Measure post-signup commercial results |
| Cost per activated customer | Relevant acquisition cost / activated new customers | Compare spend with quality |
Choose your unit carefully: In B2B SaaS, one company may contain multiple users. A company activation rate is not interchangeable with an individual-user activation rate. Also, an observed retention difference between channels does not establish that the channel caused retention.
Use product metrics for wider KPI formulas, and define a single activation event that reflects genuine customer value rather than a superficial click.
How to use product analytics in marketing step by step
1. Define the outcome: Decide whether the immediate question is activation, qualified pipeline, paid conversion, or retention. Avoid switching success definitions after reviewing the results.
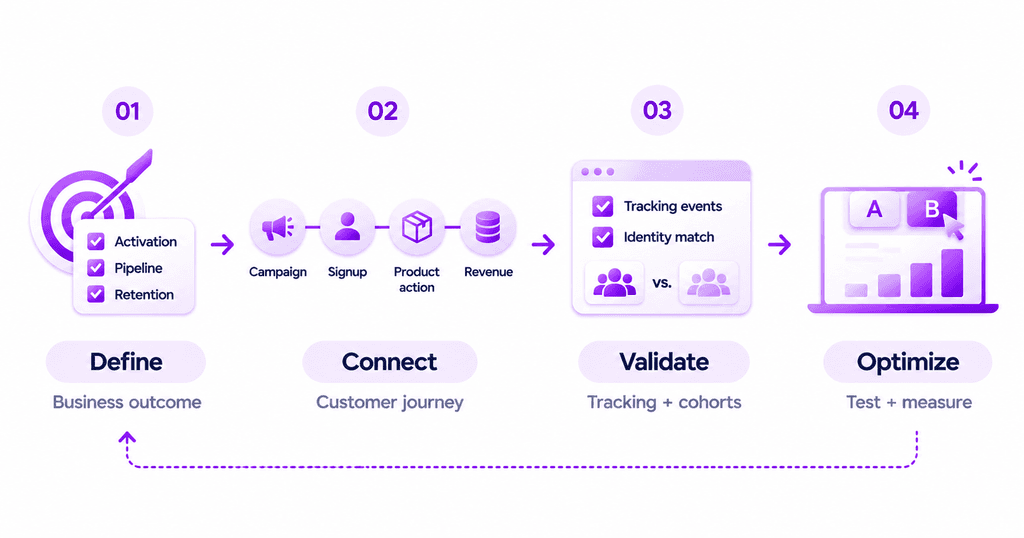
2. Map the journey: Identify the acquisition touchpoint, signup event, key product actions, and commercial milestones that matter for the use case.
3. Connect the data: Ensure campaign sources, product events, user or account identities, and relevant CRM or billing outcomes can be associated accurately where supported.
4. Validate tracking: Check event names, duplicate events, identity changes, consent requirements, conversion windows, and missing sources before interpreting a report.
5. Compare consistent cohorts: Keep eligibility, reporting periods, attribution definitions, and customer types comparable across channels.
6. Act on a hypothesis: Refine a message, onboarding resource, audience, or budget allocation. Use a controlled test when possible.
7. Measure what changed: Review downstream outcomes, document uncertainty, and monitor whether the improvement persists.
Cross-functional data literacy is valuable here. Some professionals study advanced research and management methods through options such as fully online DBA programs, but formal doctoral study is not a requirement for practical product analytics. Clear definitions and sound measurement habits matter much more to daily decisions.
Common mistakes when applying product data to marketing
- Treating signups as customers: Initial registration does not guarantee activation, payment, or lasting value.
- Confusing association with cause: People who use a feature may retain longer, but that does not prove the feature made them stay.
- Mixing time windows: A newer campaign has had less opportunity to produce paid conversions than an older one.
- Ignoring identity gaps: Users may move between devices, accounts, and sessions. Broken associations distort acquisition-to-product comparisons.
- Overstating AI predictions: Predictive analytics uses historical information to estimate future outcomes, but its performance must be tested on suitable data. A rule-based inactive-user segment is not a validated churn prediction.
- Overlooking privacy: Limit collection to necessary information and honor applicable consent, access, and retention requirements.
Better data will not eliminate uncertainty. It will make the assumptions behind marketing decisions more visible and easier to challenge.
How Usermaven connects product analytics with marketing attribution
Usermaven’s primary positioning is marketing attribution, with integrated capabilities for product analytics, funnels, user journeys, segments, retention, and campaign measurement. This combination helps teams evaluate not just which channels generated signups but how those acquired users behaved afterward.
Its funnel analytics software can compare progression through activation and conversion steps. Its behavioral segmentation software helps teams define meaningful groups, while the marketing teams solution connects campaign and revenue measurement.
Maven AI can assist with investigating reports and recurring analysis. The October 28, 2026 release added the ability to save AI-generated charts and reports to dashboards and share Agent reports. These features help teams review evidence, but they do not establish that a marketing campaign caused a customer’s behavior.
When Usermaven fits best: SaaS and growth teams that want marketing attribution linked with activation, product engagement, retention, and revenue, rather than managing those questions in disconnected reports.
If you want to investigate which campaigns bring customers who actually use your product and generate value, book a demo to review the relevant Usermaven workflows.
FAQs about product analytics in marketing
1. What is the difference between product analytics and marketing analytics?
Marketing analytics evaluates channels, campaigns, acquisition costs, and attributed conversions. Product analytics examines behavior after people enter the product, including activation, feature adoption, and retention. Together, they help evaluate acquisition quality beyond initial signups.
2. How can product analytics improve marketing campaigns?
It can reveal whether customers from a campaign reach meaningful milestones, adopt promised features, and continue using the product. Marketers can use those observations to form hypotheses about targeting, content, onboarding, and budget allocation, then test changes.
3. Which product metrics should marketing teams track?
Start with activation rate, time to value, trial-to-paid conversion, cohort retention, and cost per activated or paying customer. Add feature adoption or account-level engagement when those measures match the business model.
4. Can product analytics show which campaign caused retention?
Not on its own. Product analytics shows behavioral associations and cohort differences. Attribution models assign credit under defined rules, while causal conclusions generally require stronger experimental designs or additional evidence.
5. Does product analytics replace a CRM or marketing automation platform?
No. Product analytics measures observed behavior. CRM and automation systems manage customer records, communications, and workflows. The tools can complement one another when data integration and permissions are configured appropriately.

Written by
Lauren Brooks
Lifecycle Marketing Strategist
Lauren Brooks is a lifecycle marketing strategist with 4+ years of experience helping SaaS businesses create meaningful customer experiences. She specializes in user engagement, retention, and conversion optimization, helping brands build stronger customer relationships beyond acquisition.
All articles by Lauren →