A buyer can discover a company through LinkedIn, return through organic search, attend a webinar, click a paid ad, and close weeks later.
Giving the full deal value to one interaction hides how the journey actually developed.
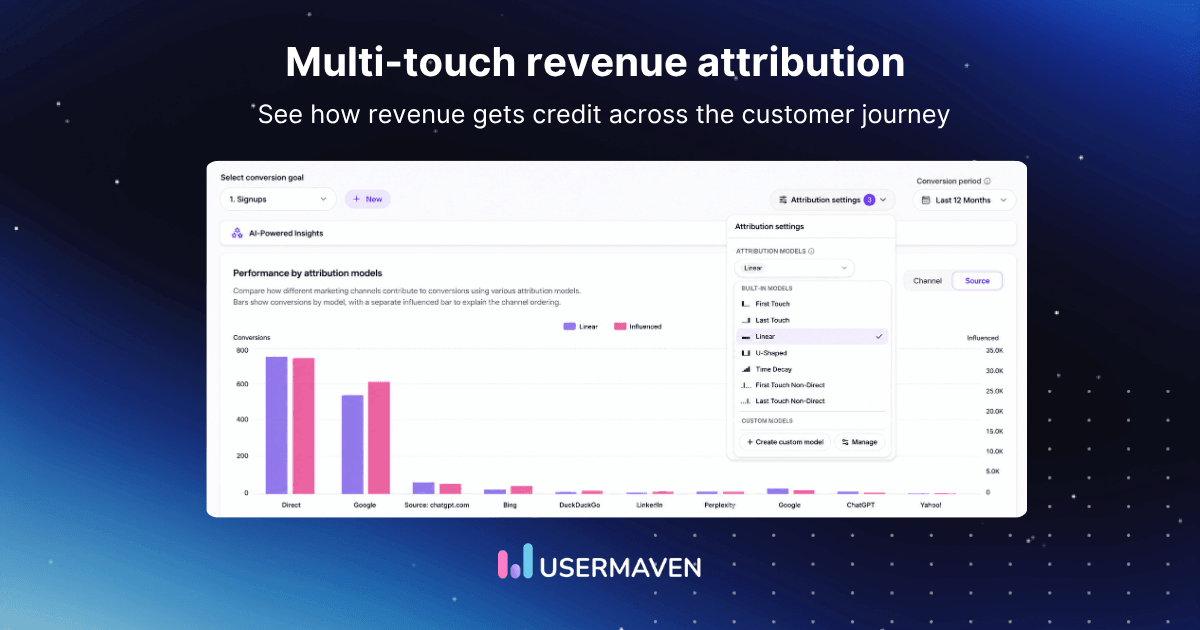
Multi-touch revenue attribution solves a narrower problem than ordinary channel reporting. It distributes revenue credit across the eligible marketing interactions that preceded a commercial outcome.
A marketing attribution software workflow can then compare those credits with spend, pipeline, customer quality, and revenue.
This guide explains the revenue math, how different models change the dollar allocation, which revenue outcome to use, and where multi-touch reporting can mislead.
The goal is not to find one universally correct model. It is to make the assumptions behind every revenue number visible.
Key takeaways
Revenue gets allocated: Multi-touch revenue attribution converts a revenue outcome into credit distributed across several eligible interactions.
Choose the outcome first: Decide whether the report is allocating purchase revenue, Closed Won value, subscription revenue, ARR, or another defined commercial outcome.
Models change the dollars: The same $20,000 deal can give very different channel revenue under Linear, U-Shaped, Time Decay, or a custom model.
Influence is different: Influenced revenue can overlap across channels, while attributed revenue should reconcile to the revenue pool being allocated.
Pipeline is not revenue: Opportunity value is potential revenue. Keep it separate from Closed Won or collected revenue.
Attribution is not causality: Attributed revenue represents credit under a model, not the revenue that would disappear if a channel were removed.
Multi-touch revenue attribution at a glance
Before getting into the math, this table shows the decisions that shape every multi-touch revenue attribution report.
| Element | What it means | Why it matters |
|---|---|---|
| Revenue outcome | Purchase, subscription, Closed Won, or collected revenue | Defines the value pool being allocated |
| Eligible journey | Marketing touches linked to the same buyer, account, or conversion | Determines which interactions can receive credit |
| Attribution window | The lookback period before the revenue event | Controls which touchpoints remain eligible |
| Attribution model | Linear, U-Shaped, Time Decay, or custom weighting | Determines how credit is split |
| Attributed revenue | Revenue value multiplied by model credit | Shows the model-assigned value of each touchpoint |
| Influenced revenue | Revenue associated with journeys a channel touched | Shows participation but is not additive |
| Pipeline value | Potential value attached to opportunities | Should stay separate from realized revenue |
| Decision layer | Revenue compared with spend, CAC, ROAS, and customer quality | Turns attribution into a budget decision |
See what's working. Fix what's not. Grow faster.
What is multi-touch revenue attribution?
Multi-touch revenue attribution is a measurement method that distributes the revenue associated with a conversion across multiple marketing touchpoints according to a selected attribution model.
The broader concept of multi-touch attribution divides conversion credit across more than one interaction. Multi-touch revenue attribution takes the next step by attaching a monetary value to that credit.
Suppose a $20,000 B2B deal follows LinkedIn, organic search, a webinar, and Google Ads. A conversion-only report can say each touchpoint contributed.
A revenue report must decide how much of the $20,000 each eligible interaction receives.
Multi-touch attribution vs. revenue attribution
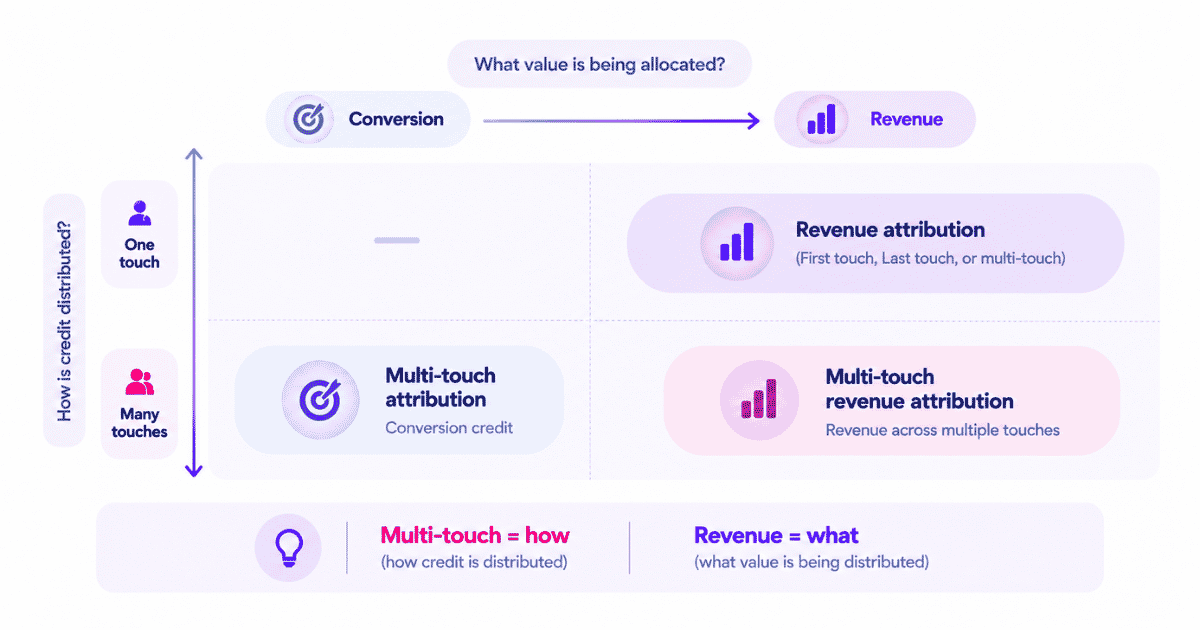
The terms are related, but they are not interchangeable. Multi-touch describes how credit is distributed. Revenue describes the value being distributed.
| Method | What it allocates | Main question |
|---|---|---|
| Multi-touch attribution | Conversion credit | Which touches contributed to the conversion? |
| Revenue attribution | Revenue credit | Which marketing contributed to revenue? |
| Multi-touch revenue attribution | Revenue across multiple touches | How much revenue credit should each touch receive? |
A revenue attribution report can still use First Touch or Last Touch. It becomes multi-touch only when the selected model distributes credit across multiple eligible interactions.
| Multi-touch describes how credit is distributed. Revenue describes what value is being distributed. |
How multi-touch revenue attribution works
A useful revenue-attribution workflow starts with the commercial outcome and works backward.
Understanding how multi touch attribution works helps keep the revenue report anchored to a real journey instead of whichever interaction is easiest to observe.
1. Define the revenue event
Choose the event that represents value: a completed purchase, subscription start, Closed Won deal, renewal, upgrade, or another agreed commercial outcome.
2. Reconstruct the eligible journey
Collect the marketing interactions that belong to the same person, account, or conversion path before that outcome occurs.
3. Apply the attribution window
Only touchpoints inside the selected lookback period remain eligible for credit. Use an attribution window that reflects observed buying lag rather than automatically choosing the longest available setting.
4. Apply an attribution model
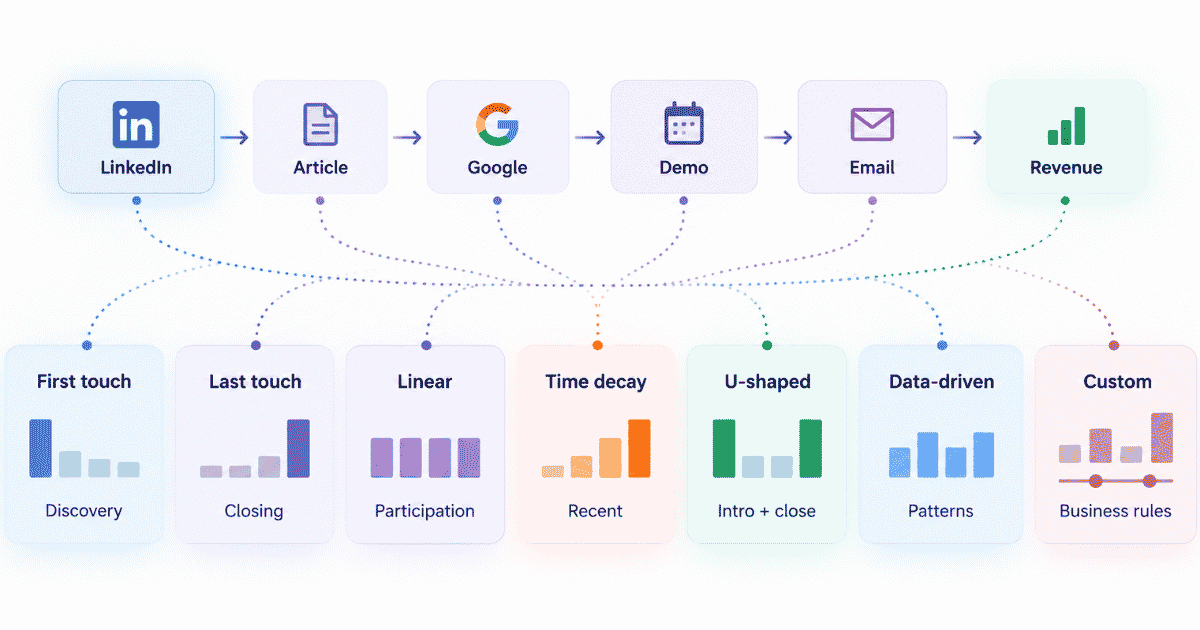
The model converts the journey into percentages. Linear splits evenly, U-Shaped emphasizes the first and last touches, and Time Decay gives more credit to recent interactions.
5. Convert credit into revenue
Multiply each touchpoint share by the revenue value attached to the conversion. The model now produces dollars rather than abstract conversion credit.
6. Aggregate the result
Roll the attributed revenue up by channel, source, campaign, content, paid ad, segment, or account so the report can support budget decisions.
Choosing the right attribution window means matching the lookback period to observed buying lag, because expanding or shrinking it changes which touchpoints remain eligible for credit.
| Stage | Question to answer | Output |
|---|---|---|
| Revenue event | What value are we allocating? | $20,000 Closed Won |
| Journey | Which interactions are eligible? | LinkedIn → Organic → Webinar → Google Ads |
| Window | How far back should we look? | Observed sales-cycle window |
| Model | How is credit split? | Linear, U-Shaped, Time Decay, custom |
| Allocation | What dollar value does each touch get? | Model % × $20,000 |
| Reporting | How should credits roll up? | Channel, campaign, source, account |
Multi-touch revenue attribution formula
The basic math is simple. The difficult part is making sure the revenue value, journey, identity, window, and model are all defined consistently before the calculation runs.
| Attributed revenue for a touchpoint = Revenue value × Attribution credit percentage |
If a $20,000 deal gives Organic Search 25% credit, the attributed revenue is $5,000.
If the model distributes the full outcome, the sum of all touchpoint credits should equal the revenue pool being allocated.
| Touchpoint | Credit | Attributed revenue |
|---|---|---|
| 30% | $6,000 | |
| Organic Search | 25% | $5,000 |
| Webinar | 15% | $3,000 |
| Google Ads | 30% | $6,000 |
| Total | 100% | $20,000 |
| Attribution does not create revenue. It creates a rule for allocating credit for revenue that already occurred. |
Drive business growth
with AI-powered analytics
How models change attributed revenue
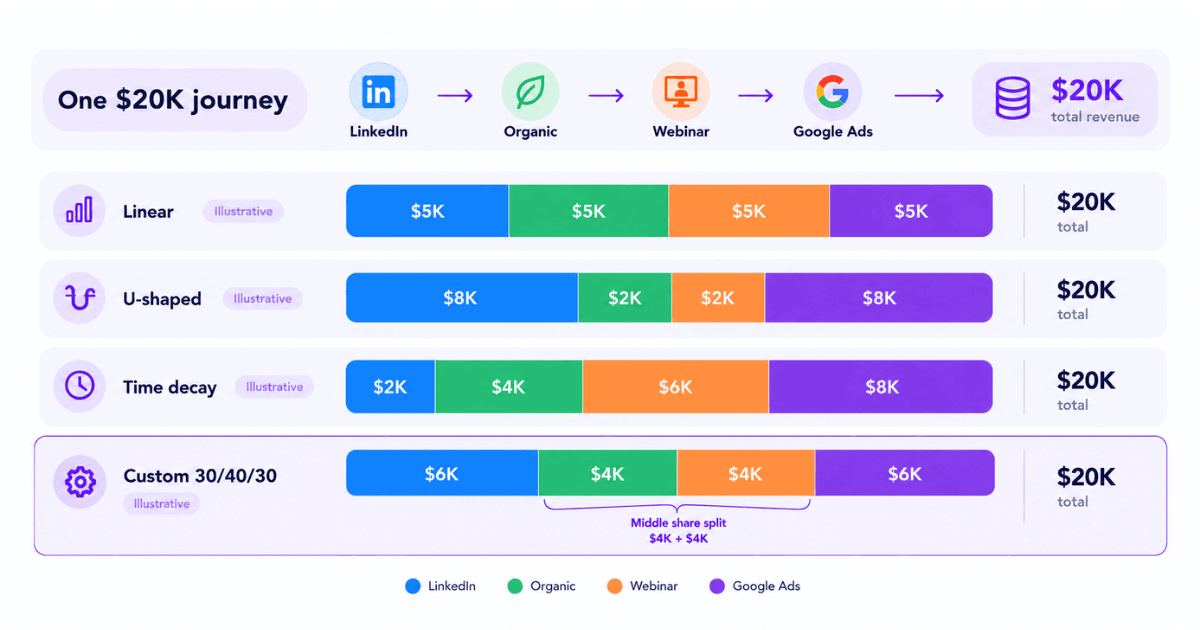
Use the same journey to compare models. Assume one Closed Won deal worth $20,000 follows LinkedIn → Organic Search → Webinar → Google Ads.
This is the core idea behind multi-touch reporting across the market. Salesforce Marketing Intelligence similarly describes MTA as distributing conversion credit across engagement signals instead of assigning the whole outcome to one interaction.
Linear revenue attribution
Linear attribution gives every eligible interaction the same share. Four touches means 25% each, so each interaction receives $5,000 of the $20,000 deal.
This is useful when the team wants a neutral baseline. The limitation is that a quick assist and a high-intent interaction receive the same weight.
U-shaped revenue attribution
U-Shaped attribution gives 40% to the first touch, 40% to the last touch, and splits the remaining 20% across the middle interactions.
For the example journey, LinkedIn receives $8,000, Organic Search $2,000, Webinar $2,000, and Google Ads $8,000. The model emphasizes both discovery and the final marketing interaction before conversion.
Time-decay revenue attribution
A time decay attribution model gives progressively more credit to interactions closer to the conversion.
Exact percentages depend on the implementation, so the distribution below is illustrative rather than a Usermaven formula.
An illustrative 10% / 20% / 30% / 40% split would assign $2,000 to LinkedIn, $4,000 to Organic Search, $6,000 to the webinar, and $8,000 to Google Ads.
Custom revenue attribution
A custom attribution model is useful when the business wants its credit rules to reflect its own buying process instead of a standard assumption.
In Usermaven, Enterprise workspaces can define first, middle, and last percentages that total 100% and add relative channel adjustments.
Teams can save up to ten active custom models and compare up to three models in a report.
The middle percentage is one shared pool. In a 30 / 40 / 30 model with two middle touches, the 40% middle share is divided between them instead of giving 40% to each.
| Model | Organic | Webinar | Google Ads | Total | |
|---|---|---|---|---|---|
| Linear | $5,000 | $5,000 | $5,000 | $5,000 | $20,000 |
| U-Shaped | $8,000 | $2,000 | $2,000 | $8,000 | $20,000 |
| Time Decay* | $2,000 | $4,000 | $6,000 | $8,000 | $20,000 |
| Custom 30/40/30 | $6,000 | $4,000 | $4,000 | $6,000 | $20,000 |
*Time Decay values are illustrative. Exact weights depend on the model implementation.
Attributed revenue vs. influenced revenue
Influenced revenue and attributed revenue answer different questions. Mixing them can make a report look as if the business generated more revenue than it actually did.
Assume one customer generates $10,000 after interacting with LinkedIn, Organic Search, and Email. All three channels can legitimately be said to have influenced the same $10,000 outcome.
| Channel | Influenced revenue | Attributed revenue |
|---|---|---|
| $10,000 | $4,000 | |
| Organic Search | $10,000 | $2,000 |
| $10,000 | $4,000 | |
| Reported total | $30,000 | $10,000 |
Influenced revenue is non-additive because the same customer outcome can appear under every channel that touched the journey. Attributed revenue applies a model and splits the available revenue pool.
| Influenced revenue can overlap. Attributed revenue should reconcile to the revenue pool being allocated. |
Pipeline value is not revenue
B2B reports often blur opportunity value and revenue. That can make marketing look stronger than the actual commercial outcome.
| Metric | What it represents |
|---|---|
| Pipeline value | Potential value attached to open or active opportunities |
| Closed Won value | Contract or deal value associated with won opportunities |
| Collected revenue | Money actually received by the business |
| Attributed revenue | Revenue credit assigned under a selected attribution model |
| Influenced revenue | Revenue touched by a channel without necessarily splitting the value |
A $50,000 opportunity entering the CRM is not automatically $50,000 in revenue. The deal can shrink, stall, or be lost. Reporting should keep potential pipeline and realized commercial outcomes separate.
That distinction is central to pipeline attribution. It lets teams compare the marketing that creates opportunities with the marketing that ultimately contributes to Closed Won revenue.
Which revenue should teams attribute?
The attribution model is not the first decision. The first decision is which commercial value the business wants the model to allocate.
| Choose the revenue event before choosing the attribution model. |
SaaS revenue
A SaaS team might attribute a first paid subscription, new MRR, ARR, an upgrade, expansion revenue, collected revenue, or LTV.
These values answer different questions and should not be mixed in one report without clear labels.
B2B revenue
B2B teams may analyze opportunity value, Closed Won value, recognized revenue, or collected revenue. Opportunity value should remain labeled as pipeline until the commercial event is actually won.
Ecommerce revenue
Ecommerce teams can choose gross order value, net revenue after discounts, revenue after refunds, repeat purchase revenue, or customer LTV.
The best choice depends on the budget decision the report is meant to support.
| Decision | Better value basis |
|---|---|
| Which ads generate completed purchases? | Verified purchase revenue |
| Which campaigns acquire valuable SaaS users? | Subscription or plan revenue |
| Which channels create sales opportunities? | Opportunity or pipeline value |
| Which marketing generates won business? | Closed Won revenue |
| Which sources create long-term customer value? | Retained revenue or LTV |
Teams that need to analyze how revenue behaves after acquisition can pair attribution with broader revenue analytics so the report does not stop at the initial conversion.
Multi-touch revenue attribution for B2B SaaS
B2B SaaS is one of the clearest use cases because the meaningful commercial outcome often occurs long after the first web conversion.
A demo request may be followed by qualification, an opportunity, procurement, and Closed Won revenue weeks later.
A typical journey can look like LinkedIn ad → organic article → webinar → demo → MQL → SQL → opportunity → Closed Won.
The first half lives in marketing systems; the second half usually lives in the CRM.
That is why b2b marketing attribution has to preserve acquisition context beyond lead creation. The attribution system should continue into CRM stages and commercial outcomes.
For B2B SaaS teams, the useful question is not only which channel generated the lead. It is which sequence of channels contributed to qualified pipeline and customers with meaningful revenue.
Account and CRM data make B2B attribution harder
A B2B deal can involve several people from one account, different acquisition paths, and a deal value that changes before close. Revenue attribution has to reconcile those relationships before it distributes credit.
Multiple contacts
A champion may discover the company through paid search while a decision-maker enters through a referral. If both are tied to one opportunity, person-level journeys and deal-level revenue need a clear association rule.
One account, several journeys
Different contacts from the same account can read different content, attend different events, or enter through different campaigns. Treating the first identified person as the whole account can hide buying-group behavior.
Opportunity associations
The CRM must connect people, companies, opportunities, and stages consistently. If the deal is missing contact roles or associations, the revenue event can exist without a defensible marketing journey.
Stage changes and deal value
An MQL, SQL, open opportunity, and Closed Won deal answer different measurement questions. Deal value can also change before close, so the chosen revenue field should match the report definition.
Reliable Salesforce marketing attribution depends on campaigns, opportunity data, stage history, contact roles, and pre-CRM activity staying connected throughout the B2B measurement workflow.
Usermaven’s current Salesforce integration reads Accounts, Contacts, Leads, Opportunities, stage history, and contact roles so CRM outcomes can be analyzed beside marketing and behavioral data.
What data multi-touch revenue attribution needs
A more sophisticated model cannot compensate for incomplete measurement inputs. The report needs enough context to identify the journey, the commercial outcome, and the amount being allocated.
| Data | Why it matters |
|---|---|
| Touchpoints | Reconstructs the customer journey |
| Channel/source | Identifies acquisition and assisting sources |
| Campaign parameters | Preserves campaign context |
| Identity | Connects anonymous and known activity |
| Conversion event | Defines the business outcome |
| Revenue value | Supplies the amount being allocated |
| Timestamp | Determines journey order and window eligibility |
| CRM/account ID | Connects contacts, companies, and opportunities |
| Stable event ID | Supports deduplication and reconciliation |
Reliable customer journeys help teams inspect the sequence behind aggregate revenue totals instead of treating each conversion as an isolated row.
The Measurement Trust Center checks campaign tracking, customer matching, connected platforms, conversion feedback, and data confidence before teams use attribution reports to move budget.
| Revenue precision cannot exceed measurement precision. |
How to read a multi-touch revenue attribution report
A useful report should let the reader separate influence, model credit, spend, and commercial outcomes instead of collapsing them into one revenue column. Start with reconciliation before comparing winners.
| Report field | What to verify | Why it matters |
|---|---|---|
| Revenue total | Matches the selected revenue pool | Prevents model credit from exceeding the outcome being allocated |
| Influenced revenue | May overlap across channels | Useful for reach and participation, not additive totals |
| Attributed revenue | Changes with the selected model | Shows the model-assigned share of value |
| Spend | Uses the intended date basis | Needed for meaningful ROAS comparisons |
| Pipeline / Closed Won | Reported separately | Prevents potential value from being mistaken for revenue |
| Unattributed value | Visible rather than hidden | Surfaces identity, tracking, or eligibility gaps |
Read the report in a sequence. First reconcile total revenue, then compare attribution models, inspect high-value conversion paths, and check whether the customer journey still makes sense at account or user level.
Next, compare revenue with spend, CAC, and ROAS.
A channel with less attributed revenue can still matter if it starts high-value journeys, while a closing channel can look stronger under models that favor recent interactions.
Date logic also matters. A conversion-date view groups revenue when the conversion happened, while a spend-period view asks what later outcomes came from earlier spend.
Usermaven also supports spend-period attribution with look-ahead for paid acquisition analysis.
| Conversion date and spend date answer different questions. Label the reporting basis before comparing ROAS. |
If totals change unexpectedly, start with conversion paths and customer-level journeys before switching models.
A consistent approach to how to measure marketing attribution keeps those checks tied to the same goals, windows, and revenue definitions.
Common multi-touch revenue attribution mistakes
Allocating pipeline as if it were revenue
Pipeline is potential value. Keep opportunity value separate from Closed Won or collected revenue so marketing is not credited with money that has not been realized.
Counting influenced revenue as additive
The same $20,000 deal can influence several channels. Adding those influenced values together can inflate the apparent revenue beyond the actual customer outcome.
Using the wrong revenue event
ARR, first-month revenue, Closed Won value, and collected cash answer different questions. Pick one definition and label it clearly.
Ignoring refunds, churn, or reversals
A purchase can later be refunded and a subscription can churn. If the reporting question is net value, downstream reversals need to be reflected.
Using an arbitrary attribution window
A 365-day maximum does not mean every company should use 365 days. Start from observed days-to-convert and the real buying cycle.
Losing identity between web and CRM
A revenue event can be accurate but unattributed if the system cannot connect it back to the original visit, campaign, or customer.
Double-counting browser and server events
Hybrid collection can send the same outcome through two paths. Stable event identifiers and source-of-truth rules should prevent one customer from becoming two conversions.
Treating the model as objective truth
A model is a credit rule. Changing the model can change the apparent winner without changing a single customer journey.
Multi-touch revenue attribution is not incrementality
Suppose LinkedIn receives $80,000 in attributed revenue. That means the selected model assigned LinkedIn $80,000 of credit across observed customer journeys.
It does not mean turning LinkedIn off would reduce revenue by exactly $80,000. Some of those customers may have converted through other channels or existing demand.
Attribution asks which recorded interactions receive credit for an observed outcome. Incrementality asks what additional outcome marketing caused compared with what would have happened without the intervention.
| Attributed revenue is credit, not causal lift. |
Use attribution to understand journey contribution and reporting credit. Use experiments, holdouts, or other causal methods when the decision depends on whether a channel created incremental demand.
How Usermaven measures multi-touch revenue
Usermaven is an AI marketing attribution platform that connects marketing, website, product, CRM, and revenue data.
The revenue workflow starts with a trusted conversion value, preserves the journey, applies attribution models, and carries the result into pipeline and revenue reporting.
Capture the revenue event
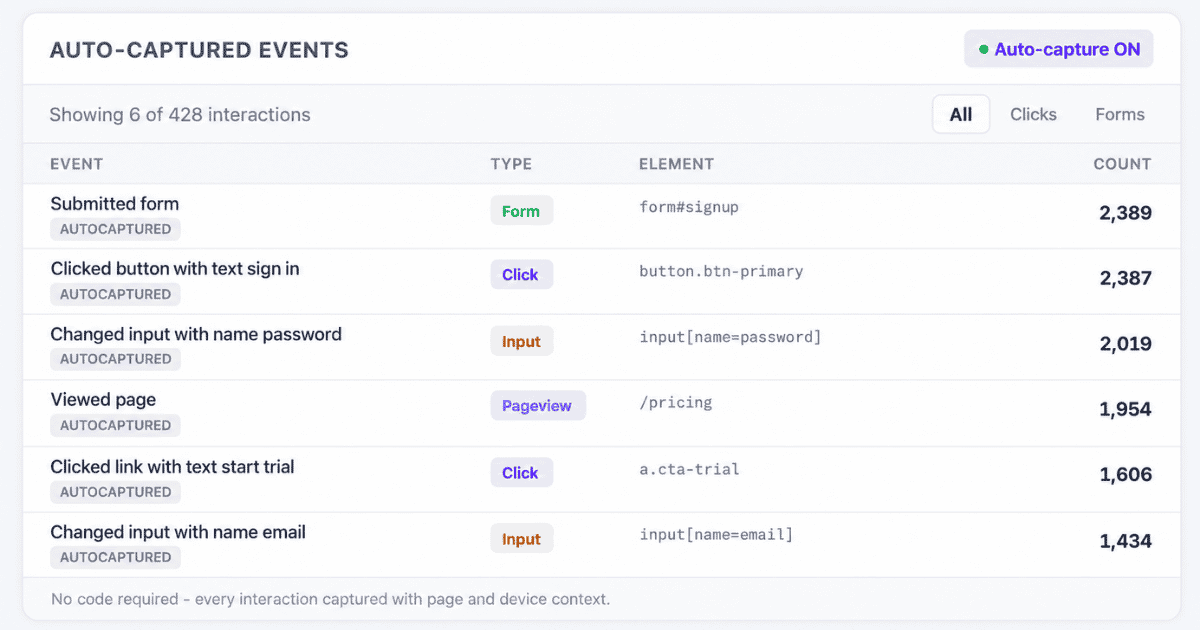
Conversion goals can use fixed values or dynamic values from custom events. Events and Event Sources can also bring payment, CRM, webhook, webinar, CSV, and other off-site conversions into the same analytics workspace.
Preserve the customer journey
Identity resolution connects anonymous behavior with known users and downstream events when the identifiers are implemented correctly.
This keeps acquisition context attached to the commercial outcome instead of resetting at signup or CRM creation.
Compare attribution models
Usermaven supports seven built-in models: First Touch, Last Touch, First Touch Non-Direct, Last Touch Non-Direct, Linear, U-Shaped, and Time Decay.
Enterprise workspaces can also create custom first/middle/last models with channel adjustments.
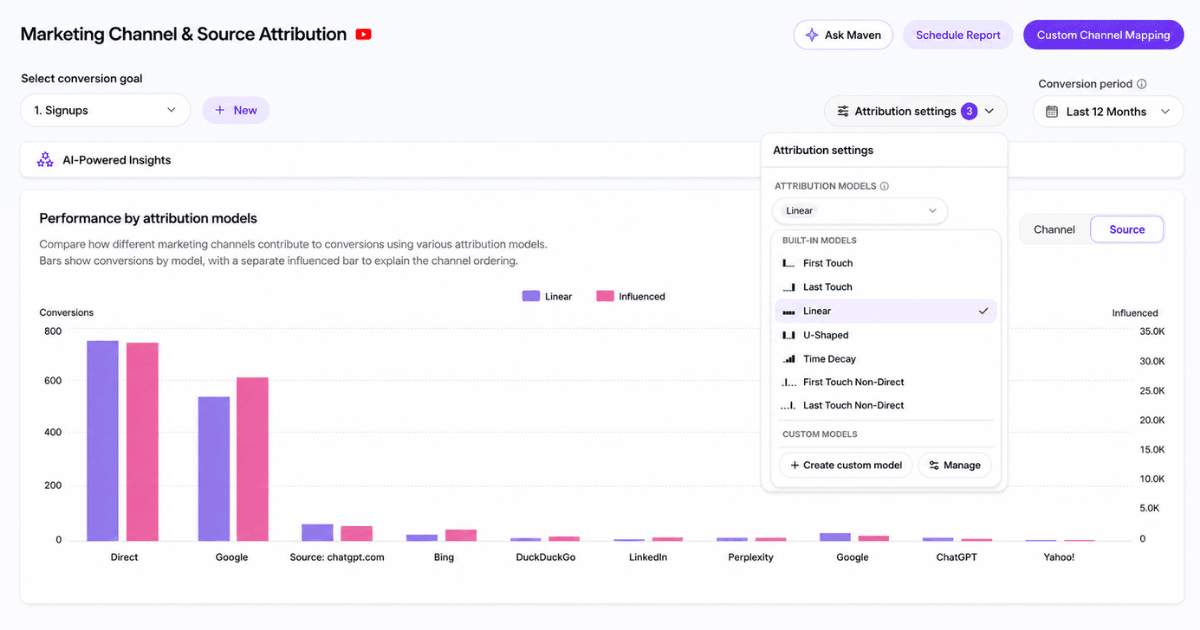
The multi-touch attribution software view helps teams compare how conversion and revenue credit changes when the model changes instead of treating one allocation as the only possible interpretation.
Use a lookback window that fits the cycle
Usermaven supports attribution lookback windows up to 365 days.
The important decision is to use the period that reflects the real conversion lag, especially when B2B deals take months to close.
Connect attribution with pipeline and revenue
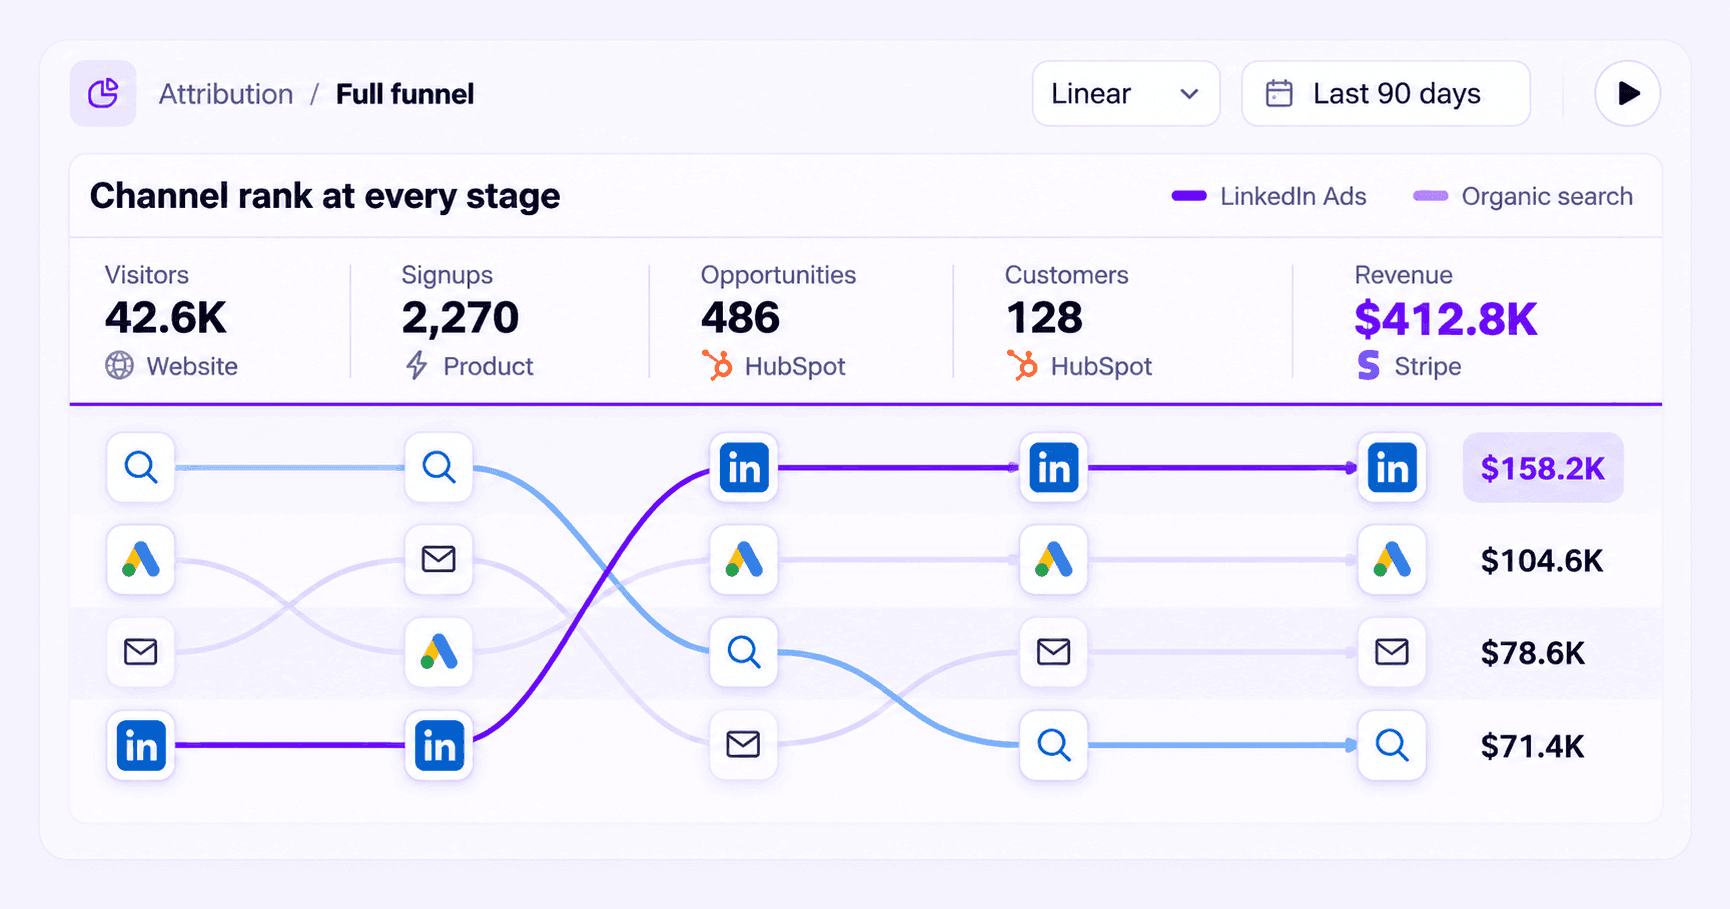
The full-funnel revenue attribution workflow keeps acquisition, conversion, opportunity, Closed Won, attributed revenue, ROAS, retention, and LTV in context instead of evaluating each stage independently.
Investigate the result with Maven AI
Maven AI can investigate questions such as which channels gain revenue credit under Linear vs. Time Decay, which campaigns influence high-value deals, or why attributed revenue changed between periods.
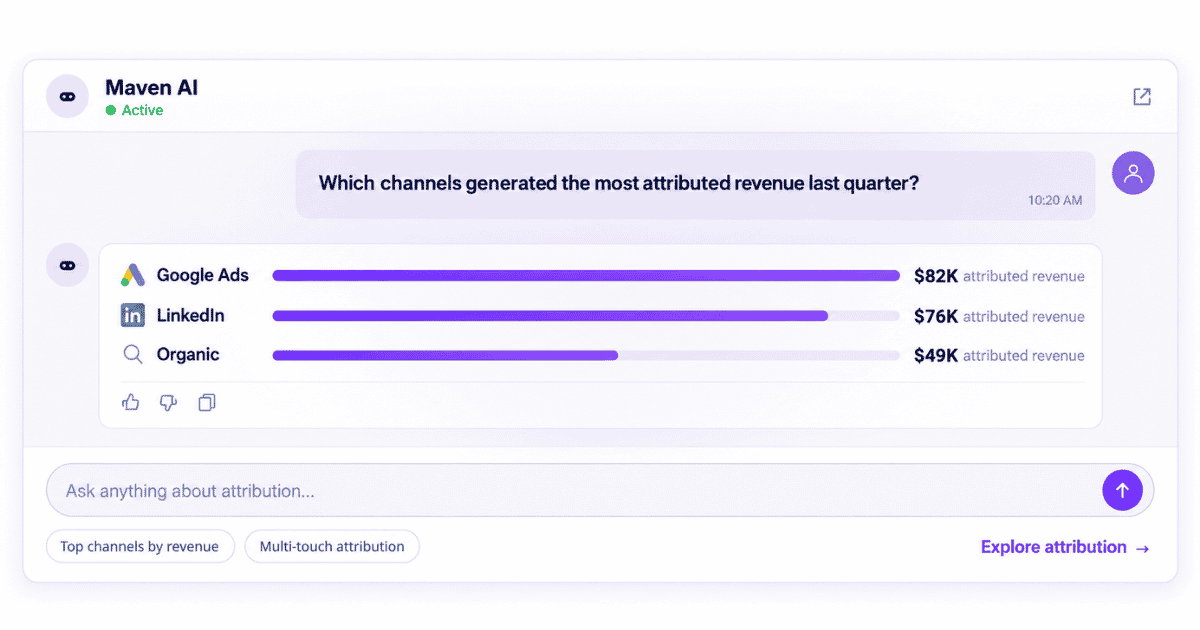
With tools like Usermaven, teams can also query authorized analytics from compatible external AI clients through MCP. AI can speed up investigation, but it cannot repair missing identities or bad revenue definitions.
First-party evidence: ContentStudio
ContentStudio is relevant because its paid platforms could show clicks and costs, but those reports did not connect spend cleanly with signups, demo bookings, plan upgrades, paying customers, and revenue.
After implementing Usermaven, the ContentStudio case study reports 128% growth in signups, 92% more plan upgrades, and 242% more demo bookings.
The team also reported a 30% ROAS improvement after connecting campaign data with downstream outcomes and reallocating budget.
The case also found that some paid conversions completed 7 to 14 days after the original ad click. That delay changed which campaigns looked profitable and prevented premature budget cuts.
These results should not be attributed to multi-touch revenue attribution alone. The defensible lesson is that connecting acquisition with customer and revenue outcomes changed the decision surface alongside funnel and campaign optimization.
Multi-touch revenue attribution reporting checklist
Use these checks before treating model-assigned revenue as a basis for budget decisions.
Revenue outcome: Define the commercial value the report will allocate.
Source of truth: Confirm which system owns that outcome.
Campaign context: Preserve channel, source, campaign, and click data.
Identity: Resolve anonymous and known users consistently.
CRM associations: Connect contacts, companies, opportunities, and revenue where relevant.
Lookback period: Set the attribution window from observed conversion lag.
Model choice: Select or configure the credit model deliberately.
Revenue reconciliation: Confirm attributed revenue matches the allocated revenue pool.
Influence vs. credit: Keep influenced revenue separate from model-assigned revenue.
Pipeline separation: Keep pipeline separate from Closed Won revenue.
Deduplication: Reconcile browser, server, and imported conversion events.
Net value: Include refunds, cancellations, or reversals when the metric requires them.
Model comparison: Compare more than one model before moving budget.
Measurement health: Validate tracking and identity before trusting the report.
Report definition: Document the model, revenue field, and window in every shared report.
Metrics that make the report actionable
These metrics show whether the report is complete enough to guide spend, not just whether it contains a revenue number.
| Metric | Definition / use |
|---|---|
| Attributed revenue | Revenue credit assigned under the selected attribution model |
| Influenced revenue | Revenue touched by a channel or campaign, without requiring the value to be split |
| Pipeline value | Potential value attached to opportunities |
| Closed Won revenue | Value attached to won deals |
| Conversion value | Monetary value attached to the selected conversion goal |
| ROAS | Attributed or selected revenue divided by advertising spend |
| CAC | Acquisition cost divided by new customers |
| Attribution coverage | Share of revenue outcomes with enough journey context to receive model credit |
| Unattributed revenue | Revenue with insufficient eligible or contextual data for model credit |
| Days to convert | Time between acquisition or touchpoint and the conversion |
| Revenue per customer/account | Commercial value generated by each customer or account |
Final verdict
Multi-touch revenue attribution is most useful when a customer journey involves several meaningful interactions and the business needs to understand how real revenue should be distributed across them.
The model matters, but the revenue definition matters first. Preserve identity and journey context, use a window that matches the buying cycle, and keep influenced revenue, pipeline, and attributed revenue clearly separated.
Most importantly, treat the output as a decision framework rather than causal proof.
A model can explain how credit is allocated across observed journeys, but it cannot tell you exactly what revenue would disappear if a channel were removed.
Book a demo to see how Usermaven connects marketing touchpoints with customer journeys, pipeline, and revenue across multiple attribution models.
FAQs
1. What is multi-touch revenue attribution?
Multi-touch revenue attribution distributes a conversion’s revenue across multiple eligible marketing interactions according to an attribution model. It shows how much revenue credit each touchpoint receives.
2. How does multi-touch revenue attribution work?
Define the revenue event, reconstruct the eligible journey, apply the attribution window, choose a model, convert model credit into revenue, and aggregate the result by channel, campaign, source, or account.
3. How do you calculate attributed revenue?
Multiply the revenue value by the attribution credit percentage. If a $20,000 deal gives a touchpoint 25% credit, that touchpoint receives $5,000 in attributed revenue.
4. Multi-touch attribution vs. revenue attribution?
Multi-touch attribution describes how conversion credit is split across interactions. Revenue attribution assigns monetary value to marketing. Multi-touch revenue attribution combines both by distributing revenue across multiple eligible touches.
5. What is influenced revenue vs. attributed revenue?
Influenced revenue can count the full revenue for every channel that touched a journey, so values can overlap. Attributed revenue divides the available revenue pool according to a selected model.
6. Is pipeline value the same as attributed revenue?
No. Pipeline value is potential value attached to opportunities, while attributed revenue is model-assigned credit for a defined revenue outcome. Report pipeline and Closed Won or collected revenue separately.
7. Which multi-touch attribution model is best for revenue?

Written by
Adeel Khan
Growth Marketing Expert
Adeel Khan is a full-stack SaaS marketer with 10+ years of experience in content marketing, paid advertising, analytics, and conversion rate optimization. He shares practical insights and strategies drawn from hands-on experience, helping B2B SaaS marketers improve performance and make better marketing decisions.
All articles by Adeel →