Your analytics can tell you how many people signed up last month, but only behavior data tells you why most of them never came back.
Behavior data tracking software records what people actually do on your website and in your product: the pages they view, the buttons they click, the features they use and the step where they give up. Read together, those actions show where your experience works and where it quietly loses customers.
This guide covers the main benefits for SaaS and website teams, the metrics worth tracking, real use cases by team, and what to look for when you start tracking user behavior.
Key takeaways
- Behavior data tracking software shows what users do, so you can fix the exact step where they get stuck instead of guessing.
- The biggest benefits are faster activation, higher feature adoption, earlier churn warnings and clearer product decisions.
- Track a small set of metrics tied to outcomes: activation rate, feature adoption, retention, churn and stickiness.
- Behavior data is most useful when it is connected to acquisition channels and revenue, not kept in a separate tool.
- Choose a tool with automatic event capture, funnels, journeys, segments, retention analysis and privacy-friendly tracking.
What is user behavior?
User behavior refers to all the actions that users perform on a site or app, including how long they spend on a page, how many pages they visit, how they interact with the site, and any difficulties they experience.
Meanwhile, user behavior analytics (UBA) is a technique where websites and products record what their users are doing and then analyze this data to figure out why users behave a certain way.
What is behavior data tracking software?
Behavior data tracking software is a tool that captures user actions as events, such as page views, clicks, form submissions, signups and feature usage, and turns them into reports. Those reports show how people move through your site or product, where they drop off, and which actions lead to conversion and retention.
Think of it like security cameras in a physical store. Staff notice some patterns just by walking the floor, but recordings over time reveal which aisles people skip and where queues form. Event tracking does the same for your SaaS product and website.
While a traditional analytics program such as Google Analytics can help you track where your visitors are coming from, it won’t always tell you why they’re behaving the way they are. Behavior tracking fills that gap by following each visitor or user from first visit to signup, activation and upgrade.
Behavior analytics vs. behavioral analytics
The two terms sound alike, but they’re not quite the same. While behavioral analysis focuses on predicting user behavior, behavior analysis aims to optimize the experience. In practice, most modern tools do both, and our explainer on what behavioral analytics is covers the overlap in detail.
Grow smarter with privacy-first analytics
Quantitative and qualitative behavior data
Behavior tracking gathers two kinds of data. Quantitative data shows what happened and how often. Qualitative data explains how people felt about it. Combining both gives you more useful answers than either one alone.
| Type | What it tells you | Examples |
|---|---|---|
| Quantitative behavioral metrics | What users do, at scale | Retention rate, churn rate, abandonment rate, feature usage, funnel conversion |
| Qualitative attitudinal metrics | How users feel and why | Surveys, NPS, customer satisfaction score, customer effort score, interviews |
- Qualitative attitudinal metrics: Customer feedback and surveys are an excellent way of gathering data about your customers’ feelings toward your product or service, including factors such as loyalty, usability, and satisfaction.
- Quantitative behavioral metrics: Measuring how your users engage with your product goes further than how they say they feel. You need to measure things like retention rates, churn rates, abandonment rates, and user success rates.
8 benefits of behavior data tracking software
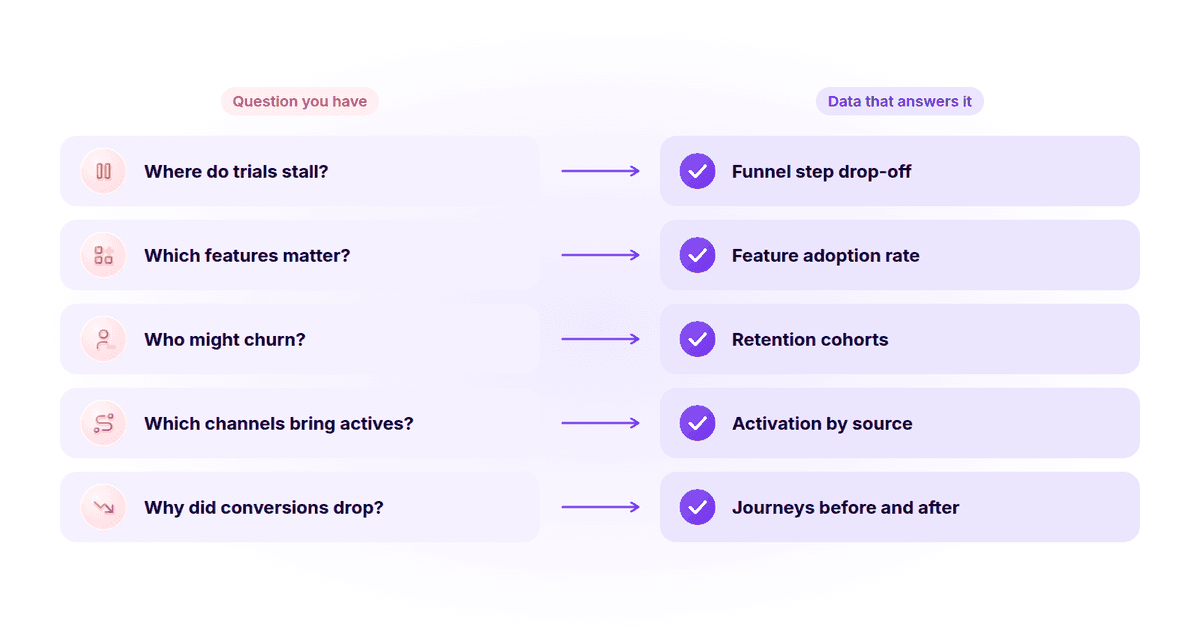
By understanding how users interact with your product, you can make informed decisions about features, design, onboarding and marketing. Each benefit below starts with a question your team is probably already asking.
1. See exactly where users get stuck
Behavior data shows which parts of your site or app are confusing or hard to use. A funnel tells you the step where most people leave, so you fix one specific screen instead of redesigning everything.
Small fixes add up. Baymard Institute’s usability testing found that the average large ecommerce site could gain a 35% increase in conversion rate through better checkout design. If your rate is slipping, our guide on why your conversion rate is dropping walks through the checks to run first.
2. Shorten time to value and improve activation
Behavior patterns show when people first see the value of your product, often called the “aha” moment. Once you know which actions lead there, you can remove the barriers in front of them and reduce time to value.
Imagine someone signs up for a free trial and gets lost, or doesn’t know where to start. Checklists and in-app guides remove those blocks and lead them to user activation faster. Behavior data then tells you whether the change actually worked.
3. Learn which features drive adoption
Behavior tracking reveals which features are most popular and which ones are underused. That matters more than most teams expect. Pendo’s analysis of anonymized usage data found that 80 percent of features in the average software product are rarely or never used.
With feature-level data you can promote the features that keep customers active, improve the ones people try once and abandon, and stop investing in the rest. These feature adoption metrics are a good place to start.
4. Spot churn risk before customers leave
Customers rarely cancel without warning. Logins become less frequent, key features go untouched and seats stop being used. Cohort analysis shows these patterns early, so customer success can step in while the account is still saveable.
Short Hills Design, a digital agency, used clearer journey and retention visibility in Usermaven to reduce churn risk by 37% and improve onboarding progression by 34%. For a broader method, see how to run a churn analysis.
5. Connect behavior to channels and revenue
Not all signups are equal. Behavior data shows which acquisition channels bring users who activate, stay and upgrade, not just users who sign up. That changes where you spend your marketing budget.
When behavior tracking sits inside your marketing attribution software, you can follow a user from the first ad click to the in-product actions that predict revenue. Conversion path analysis shows which sequences of touchpoints lead there most often.
6. Make product decisions with evidence
Roadmap debates often come down to opinions. Behavior data replaces them with evidence: how many accounts use a feature, how often, and whether using it correlates with retention or upgrades. It also lets you measure a release by comparing behavior before and after it shipped.
7. Personalize onboarding and messaging
Once you can group users by what they do, you can tailor what they see. A user who connected an integration needs different guidance from one who hasn’t logged in since day one. Micro surveys at key points in the journey add the “why” behind those actions.
- Onboarding surveys enable you to segment clients properly so you can better help them achieve their business objectives.
- Measure user sentiment and loyalty with NPS surveys.
- Get valuable feedback after launching a new product or new feature.
- Regularly check in with users to understand where they are struggling with your app.
8. Catch unusual activity and data problems
Tracking user behavior also helps you notice activity that doesn’t look human or normal, such as bot traffic, sudden spikes from one source or accounts behaving very differently from the rest. It also exposes broken tracking quickly, because a key event that suddenly stops firing shows up as a gap in your reports.
User behavior metrics you should track
User behavior metrics tell you what users do when they visit your site or app. Track a few that map to business outcomes rather than everything you can measure. These are the most useful for SaaS teams.
| Metric | What it tells you | Watch for |
|---|---|---|
| Trial-to-paid conversion | How many visitors become trial users, then paying customers | Drop-off between signup and first key action |
| Activation rate | Share of new users who reach the “aha” moment | Long time to activate |
| Feature adoption rate | How widely a feature is used | Features tried once and abandoned |
| Retention rate | How many users keep coming back | Cohorts that fall off after week one |
| Churn rate | How many customers you lose | Usage decline before cancellations |
| Stickiness (DAU/MAU) | How habitual your product is | Falling daily use among monthly actives |
| Time per task and user error rate | How easy key workflows are | Repeated attempts on the same step |
| Customer satisfaction and effort score | How users feel about the experience | Low scores right after a key step |
Here is how to calculate the core product metrics, with an illustrative example for a SaaS product.
| Metric | Formula | Example |
|---|---|---|
| Activation rate | Activated users ÷ new signups × 100 | 380 ÷ 1,000 = 38% |
| Feature adoption rate | Users who used the feature ÷ active users × 100 | 600 ÷ 2,400 = 25% |
| Week-4 retention | Users active in week 4 ÷ users in the cohort × 100 | 420 ÷ 1,000 = 42% |
| Monthly churn rate | Customers lost this month ÷ customers at the start × 100 | 12 ÷ 400 = 3% |
| Stickiness | Daily active users ÷ monthly active users × 100 | 480 ÷ 2,400 = 20% |
Illustrative numbers. Compare your own results over time and across segments rather than against a single benchmark.
By tracking these key performance indicators, you can identify where customers encounter obstacles, where they feel the most frustration, and where the most value is being created. For onboarding-specific numbers, see these user onboarding KPIs, and for the active-user metrics behind stickiness, our guide to MAU, WAU and DAU.
How different teams use behavior data
Behavior data isn’t only for product managers. Every team that touches the customer journey can use it to answer its own questions.
| Team | Typical question | Behavior data that answers it |
|---|---|---|
| Product | Which features keep accounts active? | Feature adoption and retention by feature |
| Marketing | Which channels bring users who activate? | Activation and upgrade rates by acquisition source |
| Growth | Where does the signup or demo flow leak? | Funnel step conversion and drop-off |
| Customer success | Which accounts are at risk? | Declining usage and logins by company |
| Sales | Which trial accounts are ready for a conversation? | Product usage signals, such as invited teammates or pricing page visits |
That last row is how many teams find product qualified leads, a core part of product-led growth.
Is behavior tracking software worth it?
For most SaaS and online businesses, yes, as long as you act on what you find. The value comes from decisions: fixing a leaky onboarding step, dropping an unused feature, or moving budget to channels that bring engaged users. A tool that only produces dashboards nobody reads is not worth the cost.
A simple test is to list three questions you can’t answer today, such as “Where do trials stall?” or “Which features predict upgrades?” If a behavior tracking tool can answer them within a few weeks, the business case usually makes itself.
How to get started with behavior data tracking
You don’t need a big analytics project to start. Five steps get most teams to useful answers.
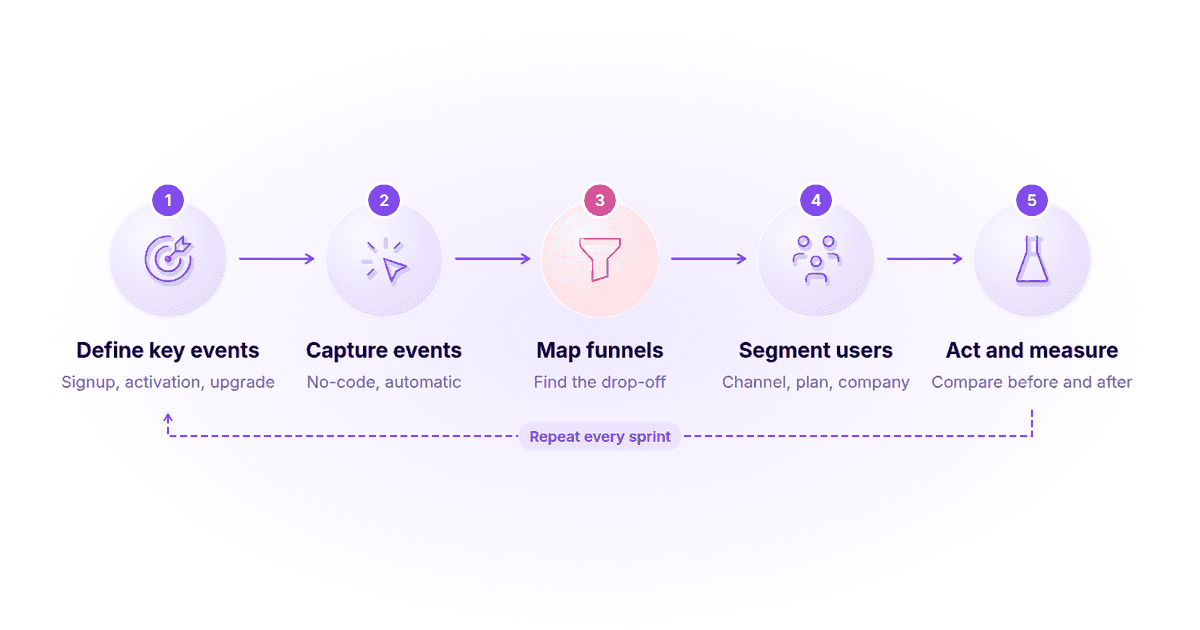
- Define your key events. Pick the few actions that matter most, such as signup, activation, first key action and upgrade.
- Capture behavior automatically. Use a tool that records clicks and page views without tagging every element by hand, then add custom events for the actions above.
- Map funnels and journeys. Build a funnel for each key flow and look at the paths users take to find the biggest drop-off.
- Segment users. Compare behavior by acquisition channel, plan, device and company to see who struggles and who succeeds.
- Act and measure. Ship one fix at a time and compare behavior before and after. Then repeat every sprint or month.
This is the same loop behind conversion analysis for business growth. If you’re also tracking marketing outcomes, pair it with these conversion metrics for digital marketers.
Choose the best behavior data tracking software for you
When choosing behavior data tracking software, start with your specific needs. There are many options, and the best way to find the right one is to shortlist a few and test them on your own questions.
One of the most important things to consider is what kind of data you need to track and how well the platform helps you avoid data tracking risks that can lead to incomplete or misleading insights.
Different software programs offer different features, so it’s important to find one that lets you track the specific data you need and supports tracking QA automation.
Use this checklist of essential features when you compare tools.
| Feature | Why it matters |
|---|---|
| Automatic event capture | Collects behavior from day one without waiting on developers |
| Funnels and user journeys | Shows where people drop off and which paths lead to conversion |
| User and company-level views | Essential for B2B, where buying and usage happen at the account level |
| Retention and cohort analysis | Reveals whether users keep getting value over time |
| Segmentation | Lets you compare behavior by channel, plan, device and company |
| Privacy-friendly tracking | Keeps you compliant and reduces data loss from ad blockers and cookie rules |
| Attribution and integrations | Connects behavior to campaigns, CRM data and revenue |
| Ease of use and pricing | Your whole team should be able to answer questions without an analyst, at a price that fits your budget |
Want to compare specific products? Our roundups of user behavior analytics tools and behavioral analytics software cover the main options side by side.
Don’t forget privacy
Behavior tracking has to respect your users. Collect only what you need, be clear in your privacy policy, and follow consent rules such as GDPR and CCPA where they apply. Privacy-friendly analytics and data anonymization let you learn from behavior without exposing personal data.
How Usermaven helps you track and act on behavior data
Usermaven brings website analytics, product analytics and marketing attribution into one platform, so behavior data is connected to the channels and campaigns that brought each user in.
- No-code event tracking: automatically captures user behavior and events without developer involvement.
- Funnels: analyze conversion steps retroactively, switch between visitor, user and company-level views, and surface bottlenecks automatically.
- User journeys: see the paths people take, segmented by visitor, user or company.
- Feature adoption and retention: measure which features users adopt and use cohorts to see what keeps them coming back. The docs explain how to measure feature adoption in Usermaven.
- Segments: group visitors, users, leads or companies by behavior and attributes, with segments that update as behavior changes.
- Trends and reports: follow key metrics over time and schedule reports to email or Slack.
- Maven AI: ask questions about your behavior and conversion data in plain language.
- Privacy-first tracking: cookieless, GDPR-compliant analytics that keep working when visitors use ad blockers.
Power up your SaaS
with perfect product analytics
Conclusion
The right behavior data tracking software helps you improve your business by showing how customers really interact with it. With that visibility, you can fix friction, speed up activation and keep more customers.
Start small: define a few key events, find your biggest drop-off and fix it. Then connect behavior to your acquisition channels so marketing, product and customer success all work from the same picture of the customer, the same way a customer behavior analysis brings every signal together.
Frequently asked questions
How do you track behavioral data?
Install a behavior tracking or product analytics tool on your website and app. It records actions such as page views, clicks, signups and feature usage as events. Then define the key events that matter to your business and use funnels, journeys and cohorts to analyze them.
What is a behavior app?
In analytics, a behavior app is a behavior data tracking tool that collects and reports on how people use a website or product. It shows what users do, where they get stuck and which actions lead to conversion or retention, so teams can improve the experience.
What are the benefits of user behavior analytics?
The main benefits are finding where users get stuck, shortening time to value, learning which features drive adoption, spotting churn risk early, connecting behavior to acquisition channels and revenue, and making product decisions based on evidence instead of opinions.
What features are essential in behavior tracking software?
Look for automatic event capture, funnels and user journeys, user and company-level views, retention and cohort analysis, segmentation, privacy-friendly tracking, and integrations or attribution that connect behavior to campaigns and revenue.
Is a user behavior analytics tool worth it for product teams?
Usually yes, if the team acts on the data. Product teams use it to see which features are adopted, where onboarding stalls and how releases change behavior. If a tool can answer the questions you can’t answer today within a few weeks, it tends to pay for itself.
Is user behavior tracking legal under GDPR?
It can be, if you have a lawful basis, collect only the data you need, explain it in your privacy policy and respect consent rules where they apply. Privacy-friendly and cookieless analytics tools make compliance easier, but you should confirm your setup with your legal team.
What is the difference between behavior data and attribution data?
Behavior data shows what people do on your site or in your product. Attribution data shows which marketing touchpoints led them there and how much credit each one gets for a conversion. Used together, they show which channels bring users who activate and pay.

Written by
Adeel Khan
Growth Marketing Expert
Adeel Khan is a full-stack SaaS marketer with 10+ years of experience in content marketing, paid advertising, analytics, and conversion rate optimization. He shares practical insights and strategies drawn from hands-on experience, helping B2B SaaS marketers improve performance and make better marketing decisions.
All articles by Adeel →