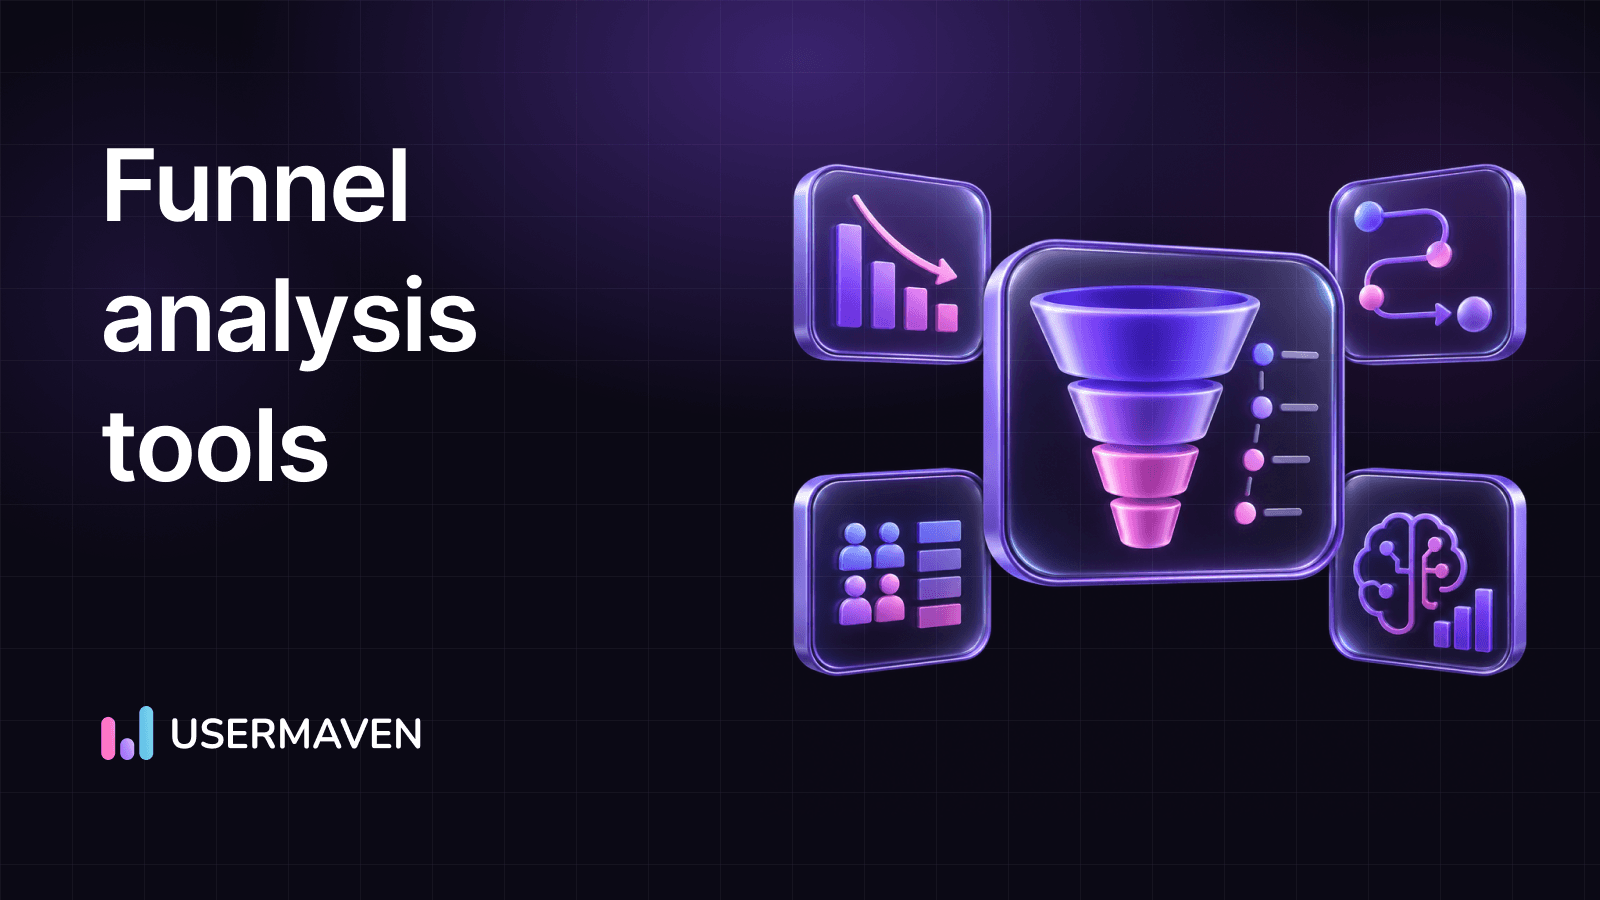
Funnel analysis tools show how people progress toward a conversion and where they stop. The right platform depends on the journey you need to measure: a website signup, an in-product onboarding flow, an ecommerce checkout, or a B2B journey that ends in pipeline and revenue.
Some tools excel at measuring step-by-step behavior. Others add session replay to investigate friction or connect funnel performance to acquisition and revenue. This guide compares 11 options by their documented capabilities, pricing structure, and best-fit scenarios, without treating different tool categories as interchangeable.
Shortlisted candidates
Start with these three options based on the question your team needs to answer. The full comparison below covers additional use cases and pricing approaches.
| Tool | Best for | Why shortlist it |
|---|---|---|
| Usermaven | Marketing attribution and connected funnels | Connect acquisition, paid ads attribution, product behavior, and CRM outcomes in one analytics workflow. |
| Mixpanel | Product behavior and onboarding | Analyze event-based funnels, cohorts, and retention when product adoption is the main question. |
| PostHog | Developer-led product teams | Combine product analytics with developer-oriented tools such as feature flags and experiments. |
Key takeaways
- Best for acquisition-to-revenue measurement: Usermaven connects funnel reporting with customer journeys and marketing attribution.
- Best for detailed product funnels: Mixpanel and Amplitude provide event-based funnel analysis alongside cohorts and retention.
- Best for developer-led teams: PostHog combines funnels with replay, experiments, and feature flags under usage-based pricing.
- Best free starting point for websites: GA4 offers funnel explorations when the necessary events and identities are configured.
- Best for investigating friction: Contentsquare, Fullstory, and Mouseflow bring behavioral observations closer to replay or experience diagnostics.
- Compare counting rules, not just dashboards: Entry criteria, identity handling, time windows, and pricing units can materially change conclusions.
What are funnel analysis tools?
Funnel analysis software measures how users, sessions, or accounts complete a defined sequence of actions. A SaaS funnel might follow pricing_page_viewed → trial_started → data_source_connected → first_report_created. The report reveals how many qualified entrants reach each step and where the largest losses occur.
A funnel is not the same as a customer journey map. A journey may include many routes, while a funnel evaluates a specific ordered goal. The principles of funnel analysis help teams define the sequence and interpret drop-offs.
Typical capabilities include step conversions, drop-off rates, segmented comparisons, time to conversion, and changes across reporting periods. More advanced systems add user paths, replay, alerts, experiments, account-level funnels, or attribution.
A well-configured funnel analytics software platform helps teams see where to investigate, not automatically why a user abandoned a process.
Types of funnel analysis software
Behavioral funnel analytics: Event-based systems examine actions across an app or website. They are particularly useful for onboarding, feature adoption, and paid conversion, where user identity and event quality are important.
Website and ecommerce analytics: These systems connect visits, campaigns, and commerce events. They can measure a checkout or lead-generation funnel, provided the relevant steps are collected consistently.
Experience diagnostics: Replay, heatmaps, errors, and frustration signals help investigate what a user encountered around a drop-off. They complement numerical funnel rates but do not, on their own, establish the cause of a conversion problem.
Marketing journey mapping: Visual mapping platforms describe intended journeys and, on suitable plans, overlay observed behavior, leads, campaign spending, and conversions. Mapping-only products must not be confused with end-to-end behavioral tracking.
The same company may need more than one category. For example, a product analytics team may find a fall in activation, then use replay or usability research to understand the friction. Teams optimizing campaigns should also examine the broader conversion funnel, not only product steps.
11 best funnel analysis tools compared at a glance
The comparison below groups tools by their principal job. Prices and free allowances were checked against vendor-published information in November 2026; limits and feature access can change. Event, session, user, and monthly-active-user allowances are different units and should not be compared directly.
| Tool | Best for | Pricing snapshot |
|---|---|---|
| Usermaven | Marketing and ad attribution linked to web, product, and B2B funnels | Business and Enterprise, custom quote |
| Mixpanel | Detailed product conversion funnels | Free up to 1M events/month; paid usage-based |
| Amplitude | Behavioral cohorts and complex product analysis | Free up to 2M events/month; Plus usage-based |
| PostHog | Engineering-led product funnels and experiments | Free up to 1M analytics events/month; pay as you go |
| Google Analytics 4 | Website acquisition and ecommerce funnels | Free standard GA4; enterprise 360 separately |
| Contentsquare | Funnel drop-offs plus experience diagnostics | Free up to 200K sessions/month; Growth from $39/month |
| Fullstory | Session replay and digital experience investigation | Free up to 30K sessions/month; advanced paid quote |
| Pendo | In-app onboarding and product adoption | Free up to 500 MAUs; paid plans by quote |
| Matomo | Website funnels with hosting control | Funnels included in Cloud; on-premise premium plugin |
| Mouseflow | Website friction and conversion analysis | Free 500 sessions/month; Essential from $25/month |
| Funnelytics | Visual marketing journeys with tracking | Map Pro $39/month; tracking from $129/month |
Methodology: We selected tools because their current product pages describe funnel or conversion analysis capabilities and because they serve meaningfully different buying needs. These are editorial fit assessments based on published documentation, not identical hands-on product tests.
No numerical ratings, fabricated benchmarks, or invented test datasets are used.
1. Usermaven
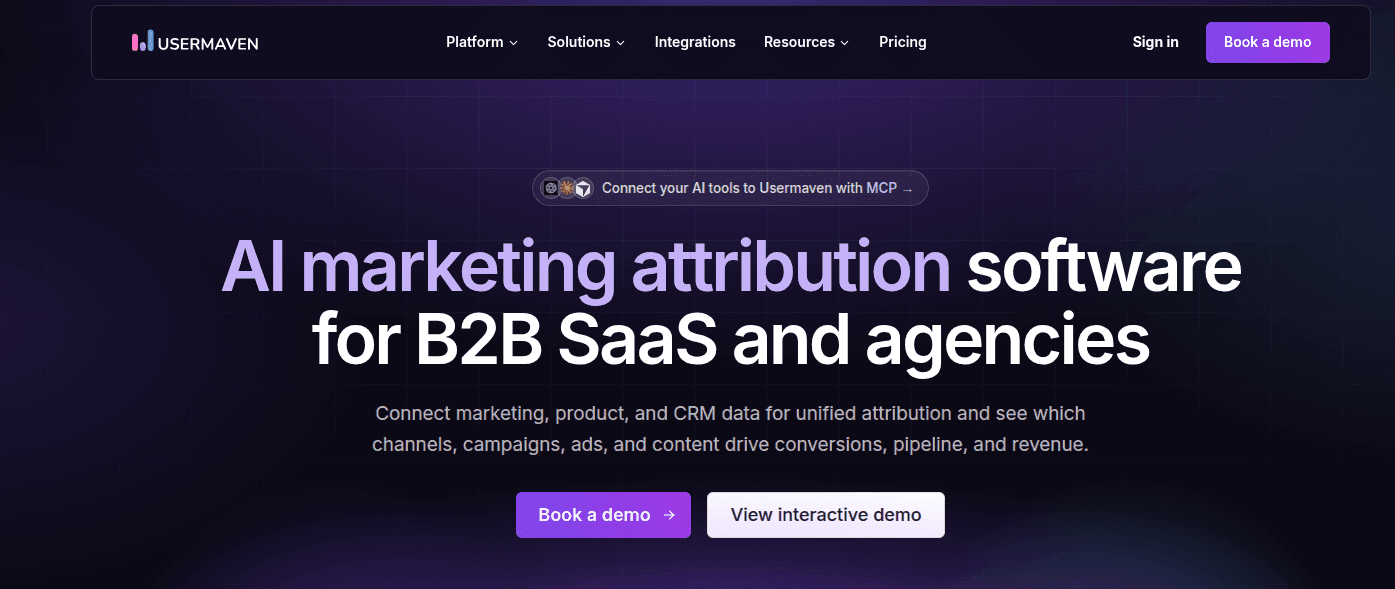
Usermaven is a marketing attribution platform with funnel analysis, customer journeys, product analytics, and reporting. It is particularly relevant when a growth team needs to compare not only whether people convert, but also the channels and campaigns associated with those customers. The platform also supports company-level funnels for B2B journeys.
Key features: Configure funnel steps from pages, custom events, and pinned events. Select sequential or strict ordering, mark steps optional, set conversion windows, and compare segments or date ranges.
Usermaven supports user-level and company-level funnels, step timing, breakdowns by marketing dimensions, and alerts. These capabilities can be combined with customer journey analytics software and attribution reporting.
Pricing: Current Business and Enterprise plans are quote-based. Usermaven does not publish a standard fixed monthly starting price. The published Usermaven pricing page outlines plan capabilities and the demo process.
When it is best: B2B SaaS and marketing teams seeking acquisition-to-conversion visibility in a shared analytics environment, especially when CRM or other conversion events need to be associated with campaign activity.
Important limitation: Usermaven is not primarily a session-replay or heatmap specialist. A funnel report points to stages worth investigating, but visual UX diagnosis or controlled experiments may require other workflows. Accurate identity connections and event instrumentation remain essential.
2. Mixpanel
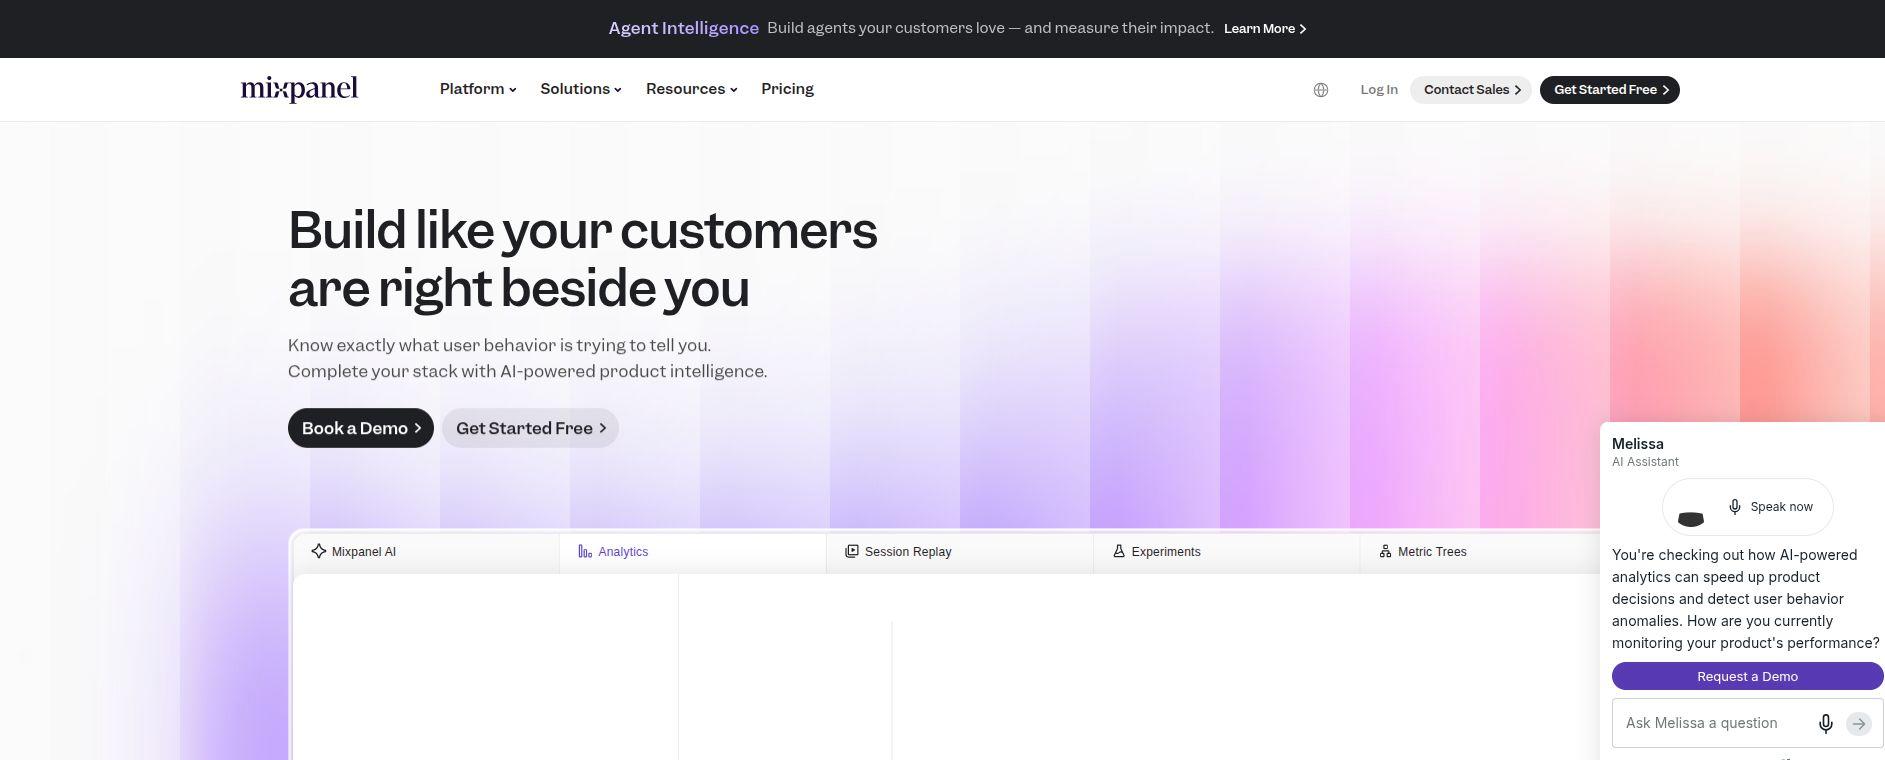
Mixpanel is an event-based product analytics platform well suited to teams that want to understand how defined user behaviors lead to activation, purchase, or repeated product use. Its funnels sit alongside retention and flows analyses, making it useful when product managers need to compare conversion patterns across cohorts.
Key features: Flexible funnel steps, conversion breakdowns, time-to-convert analysis, cohorts, user behavior flows, and retention reports. Teams can use event properties to compare experiences such as desktop versus mobile or free versus paid accounts. Mixpanel also supports session replay and experimentation in its broader platform.
Pricing: Its Free plan supports up to 1 million monthly events, subject to plan-level limits such as saved reports. Paid tiers are usage-based, with the first million monthly events included on eligible plans. Refer to Mixpanel’s current pricing for event and feature details.
When it is best: SaaS product teams measuring onboarding, adoption, or upgrades, especially when event-based segmentation and user retention are central requirements.
Important limitation: A powerful funnel report still depends on event definitions and identity handling. Without a consistent tracking plan, a change in instrumentation can look like a real performance change.
A Mixpanel alternative focused on attribution can connect product behavior with marketing outcomes.
3. Amplitude
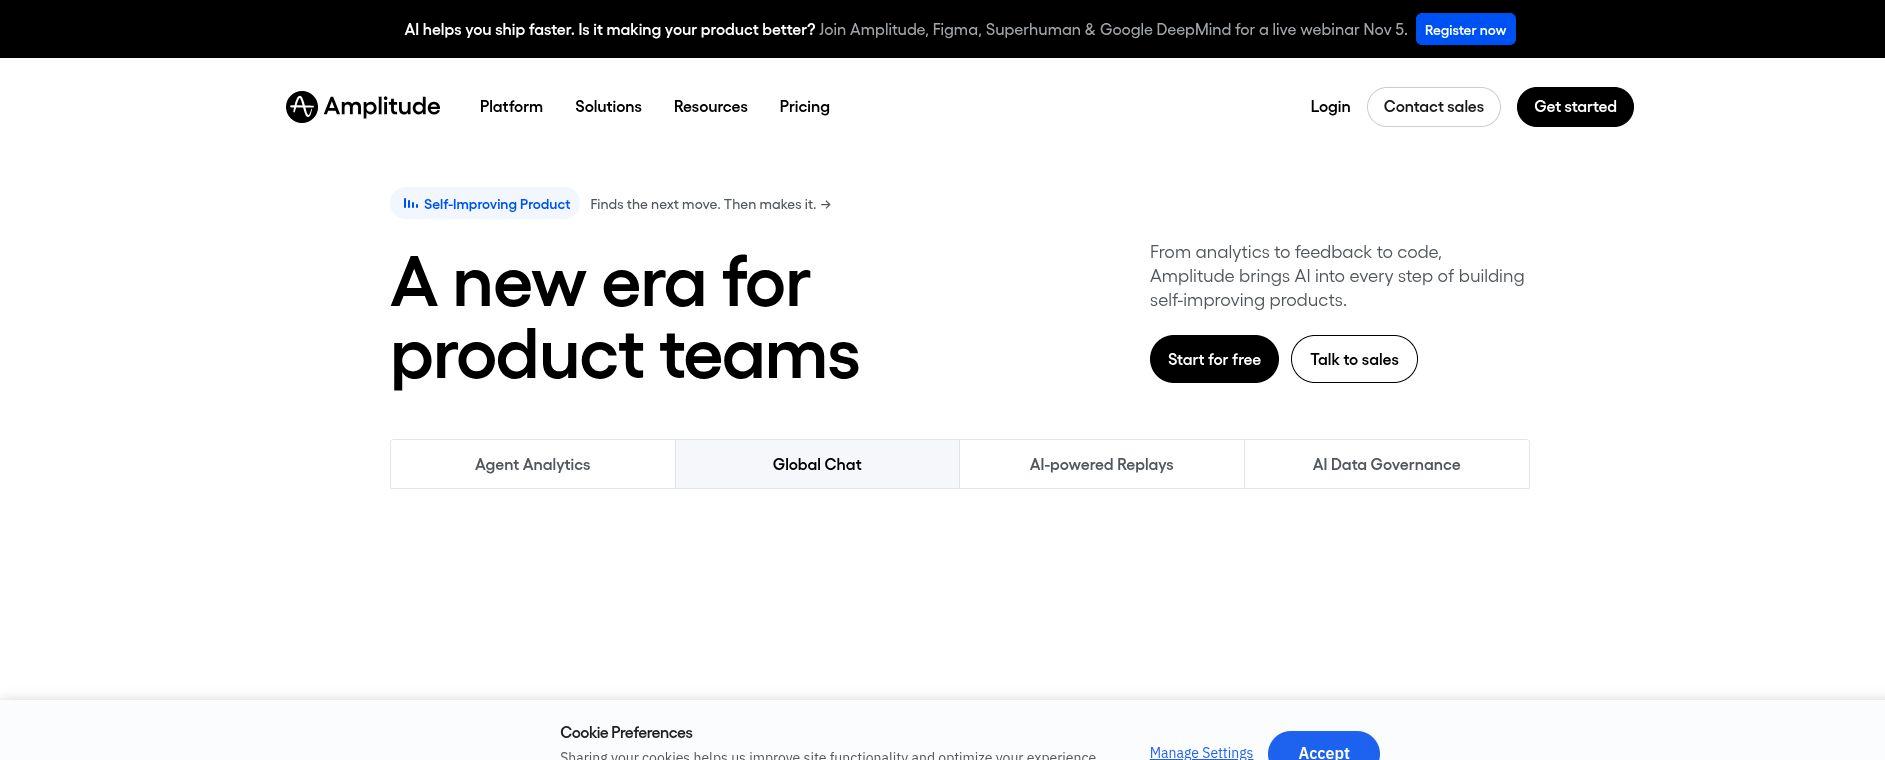
Amplitude focuses on behavioral product analytics at scale. It combines funnels, user journeys, retention, and experimentation-oriented workflows for teams making recurring product decisions. Its depth makes it attractive to organizations with multiple product areas and analysts who need flexible behavioral comparisons.
Key features: Event-based funnels, segmentation, behavioral cohorts, retention, path analysis, and connections to replay and experiments. Analysts can compare different audiences and study how experiences before or after a conversion correlate with outcomes.
Pricing: Amplitude’s Free plan currently includes 2 million events per month. Plus scales by event volume, while Growth and Enterprise require custom quotes. Some advanced capabilities depend on plan or add-ons; check the official pricing page.
When it is best: Product-led organizations that need deep behavioral analysis, detailed cohorts, and a mature analytics program spanning acquisition, activation, and retention.
Important limitation: Teams should verify which advanced segmentation, governance, and experimentation capabilities are included in their chosen package. A broad platform can require more configuration and ownership than a small business needs.
An Amplitude alternative such as Usermaven connects product analysis with marketing and revenue.
4. PostHog
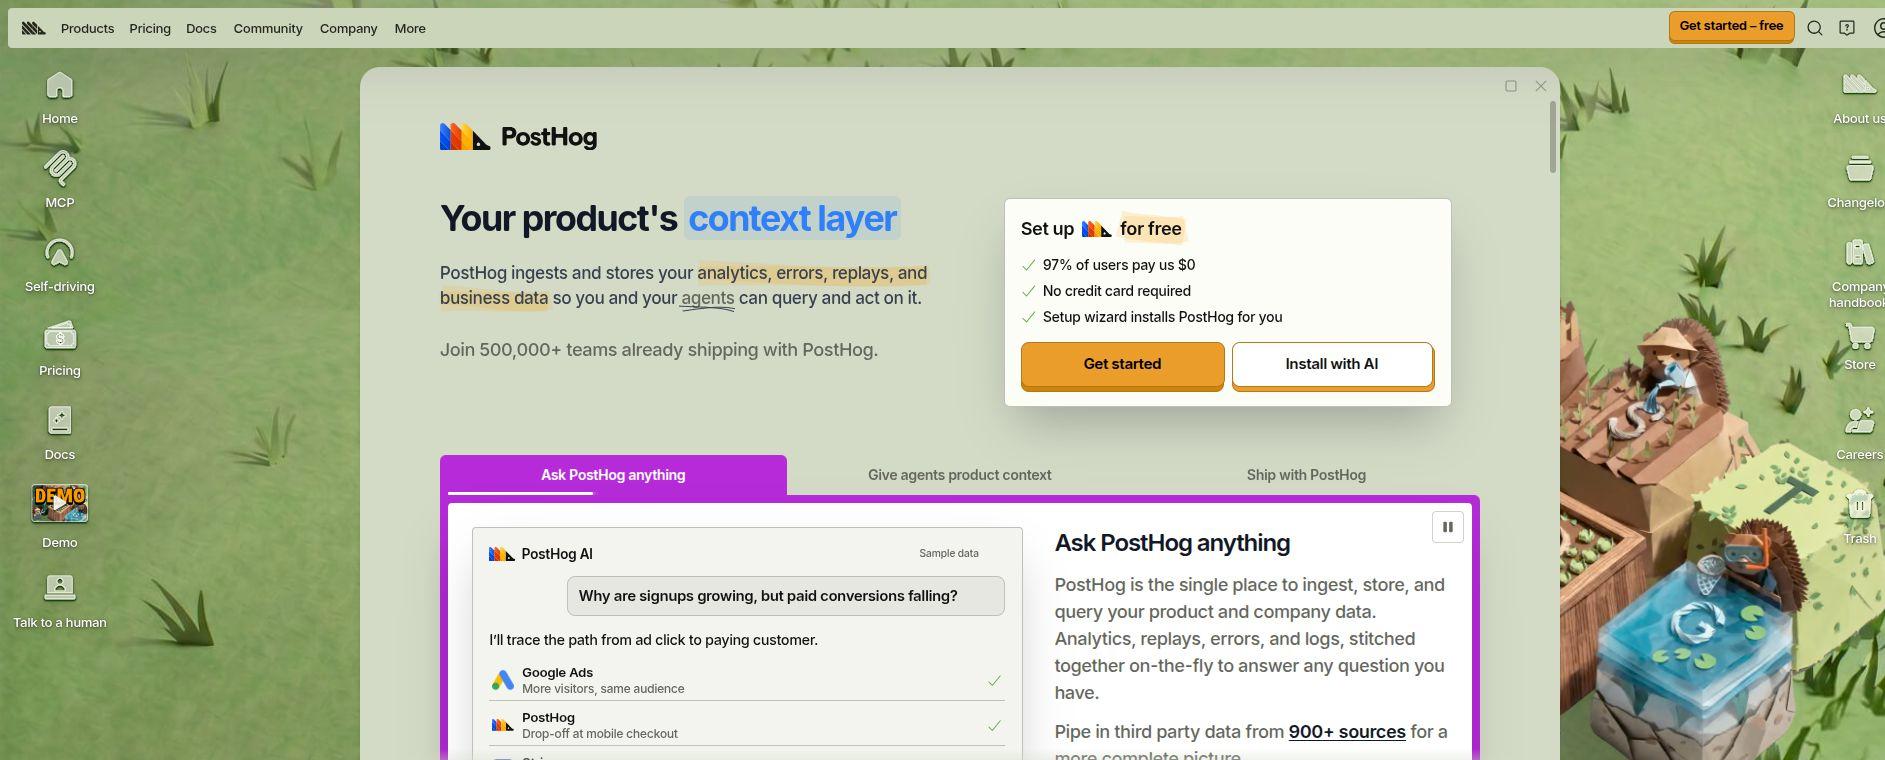
PostHog is a developer-oriented product stack with analytics, session replay, feature flags, and experiments. It is appealing to teams that want funnel reports close to product engineering workflows, with the ability to investigate behavior and then ship and evaluate a change in related tooling.
Key features: Configurable funnel and path analysis, event tracking, group analytics, retention reporting, replay, flags, and experiments. Having these tools together can simplify the investigation cycle for teams comfortable working with technical configuration.
Pricing: The monthly free analytics allowance is 1 million events, with separate free quotas for replay and other products. Usage-based billing applies above allowances when enabled. See PostHog pricing for current rates and limits.
When it is best: Startups, engineering-led SaaS teams, and technical product organizations that want to measure funnels and run experiments within a broader product-development environment.
Important limitation: PostHog’s separate metering for analytics, replay, and other services makes volume forecasting important. Its technical flexibility also means it may need more implementation involvement than a marketing-only team wants.
A PostHog alternative may be a better fit when marketing attribution is the main priority.
5. Google Analytics 4
Google Analytics 4 is a broadly available option for evaluating website and ecommerce conversion journeys. It is often already installed for acquisition reporting, so marketers can create funnel explorations without introducing a separate analytics vendor. It is especially useful for teams working within Google’s measurement ecosystem.
Key features: Funnel exploration supports open and closed funnels, custom steps, indirect or directly followed steps, segment comparisons, and step-based breakdowns. Ecommerce implementations can also use structured purchase journey reporting. Entry and step-count rules depend on the funnel configuration.
Pricing: The standard GA4 product is free. Google Analytics 360 is a separately priced enterprise offering.
When it is best: Marketing sites and ecommerce teams that need baseline traffic-to-lead or product-to-purchase funnels and already maintain GA4 events.
Important limitation: Open and closed funnels follow specific counting logic, and GA4’s funnel exploration counts a user’s first qualifying sequence within the selected period. Complex identity, offline conversion, and attribution needs may require additional implementation or reporting tools.
A GA4 alternative can bring attribution and customer journeys together.
6. Contentsquare

Contentsquare is a digital experience analytics platform that combines quantitative funnel reporting with experience diagnosis. It helps teams identify which pages or steps lose users and investigate observable behaviors using replay, heatmaps, and experience signals. Heap’s product analytics technology is now part of Contentsquare’s wider offering.
Key features: Funnels, journey analysis, heatmaps, session replay, error and performance indicators, and experience-focused AI capabilities on applicable plans. This combination suits teams that need to connect step conversion rates with what visitors experienced on a page.
Pricing: The Experience Analytics Free tier allows up to 200,000 monthly sessions, with shorter data access and replay sampling limits. Growth starts at $39/month, with scaled session allowances; Pro and Enterprise are custom-priced. Read the Contentsquare pricing details for exact inclusions.
When it is best: Ecommerce and high-traffic digital experience teams investigating checkout and form friction alongside quantitative funnel changes.
Important limitation: Replay capture and analytics data access differ by plan. A generous session headline does not mean all sessions are replayed or retained for the same duration.
7. Fullstory
Fullstory specializes in digital experience intelligence, especially session replay and behavioral investigation. Its visual evidence helps product and UX teams understand what people encountered during a failed checkout, broken form, or interrupted onboarding task, complementing conventional conversion reporting.
Key features: Session replay, behavioral analysis, event capture, experience debugging, and advanced analytical capabilities on appropriate paid plans. Teams can investigate friction signals and review sessions near critical conversion events rather than interpreting a funnel percentage in isolation.
Pricing: FullstoryFree includes 30,000 monthly sessions and core analytics, with 12 months of data retention. Advanced options such as dashboards or StoryAI require paid plans; consult Fullstory’s plan information.
When it is best: UX, product, and support teams that prioritize understanding interaction problems behind observed conversion losses.
Important limitation: Fullstory is primarily a behavioral and experience-diagnostics choice. Buyers should confirm the funnel reports available on their plan and whether they also need a separate attribution solution.
8. Pendo
Pendo combines product usage analytics with in-app guides and adoption tools. That makes it relevant when a team wants to analyze a trial or onboarding sequence and then change the in-product guidance customers receive. Its core strength is improving experiences inside software products.
Key features: Product analytics, usage paths, in-app guides, feedback, segmentation, and experience management features depending on plan. Teams can use product behavior to identify onboarding friction and guide users toward important actions.
Pricing: Pendo Free supports up to 500 monthly active users and core analytics and guide features. Base, Core, and Ultimate are quote-based, and premium features or capacity vary by package. See Pendo’s plans.
When it is best: SaaS teams focused on activation, feature adoption, and supporting users inside an application, rather than primarily reporting marketing acquisition.
Important limitation: Pendo pricing is based on monthly active users, unlike event- or session-priced products. Teams should confirm that the exact funnel and diagnostic features they need are available at their plan level.
9. Matomo
Matomo is a web analytics platform that gives organizations options for cloud hosting or self-managed deployment. Its Funnels functionality is useful for teams seeking website conversion measurement alongside greater control over where their analytics instance runs.
Key features: Defined conversion steps, funnel reports, website analytics, campaign analysis, and broader tracking features. Cloud plans include Funnels, while on-premise installations can add the premium Funnels plugin. Funnel availability depends on the deployment and selected plan.
Pricing: Matomo Cloud uses subscription pricing tied to usage and plan. On-premise software can be self-hosted, but the Funnels plugin is a separately purchased premium feature. Teams must evaluate hosting and operational costs alongside licensing.
When it is best: Privacy-conscious organizations and web analytics teams needing funnel reports with a clear deployment choice.
Important limitation: Self-hosting does not eliminate implementation, security, or maintenance work. Buyers comparing prices should include plugin licensing and infrastructure support.
A Matomo alternative may suit teams prioritizing attribution alongside analytics.
10. Mouseflow
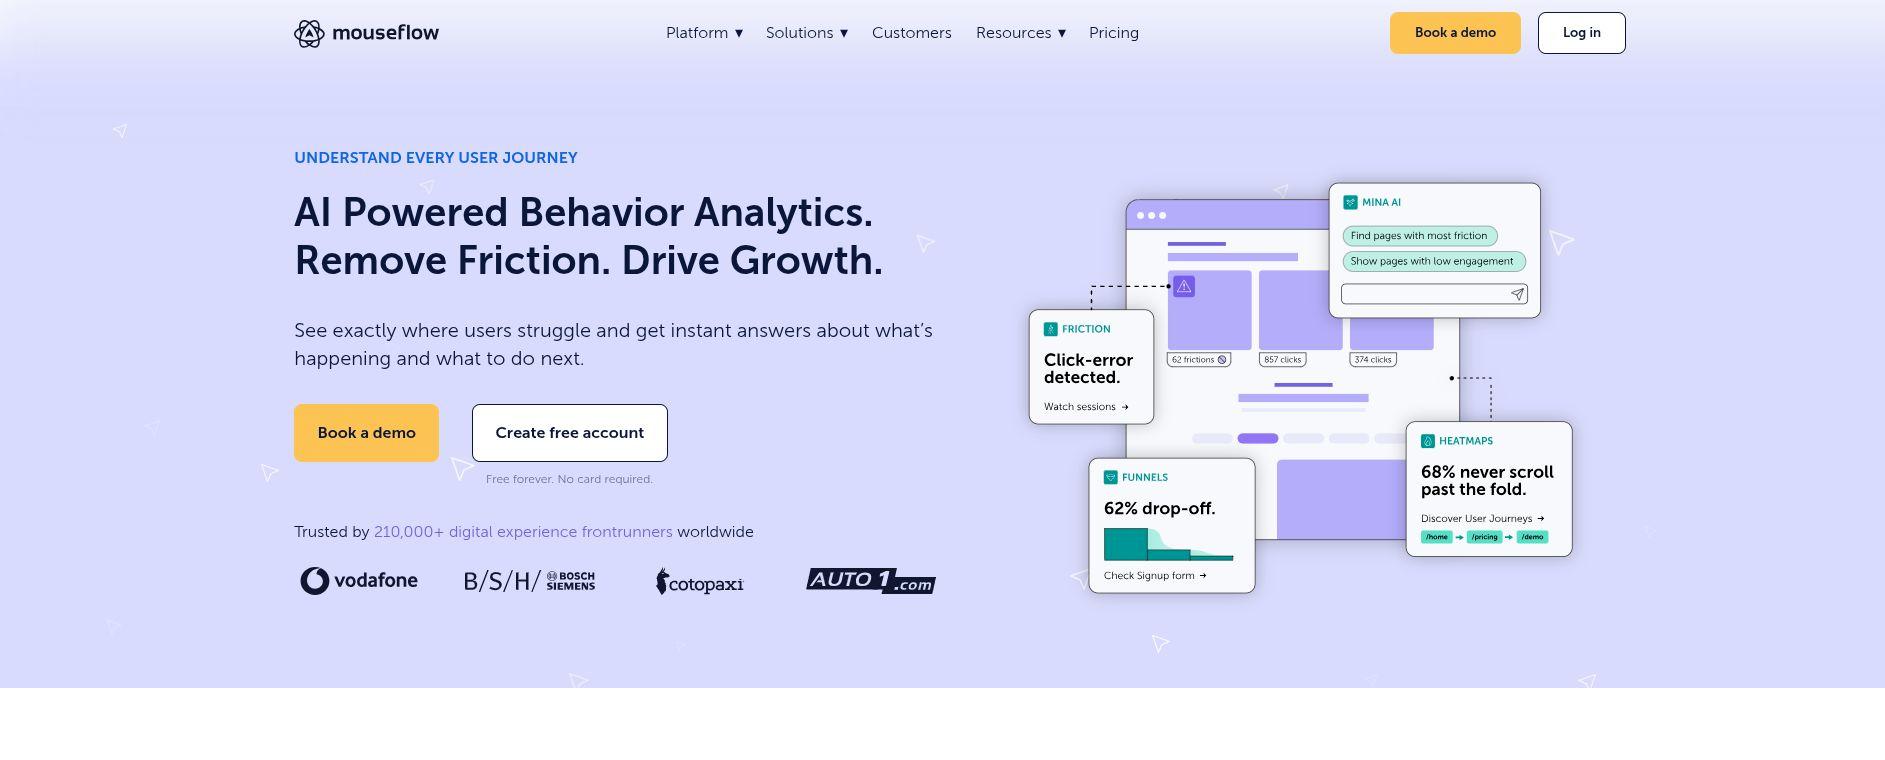
Mouseflow combines behavior analytics, replay, heatmaps, customer journeys, and friction signals. It is an accessible option for teams investigating where website visitors abandon forms or key conversion steps, particularly when visual evidence matters more than very sophisticated product-event modeling.
Key features: Session recordings, heatmaps, form and funnel analysis, friction and error detection, and website journey investigation. Marketers can inspect dropped sessions and identify recurring interaction problems for further testing.
Pricing: The Free plan covers 500 monthly sessions. Essential is listed from $25/month and higher tiers increase the session allowances and feature breadth. Confirm exact plan access and billing on Mouseflow’s pricing page.
When it is best: Smaller websites, ecommerce stores, and conversion-rate optimization teams seeking replay-led website insights.
Important limitation: Session-based quotas can be exhausted quickly at high traffic volumes. Mouseflow is not a replacement for deep B2B account attribution or advanced product event modeling.
11. Funnelytics
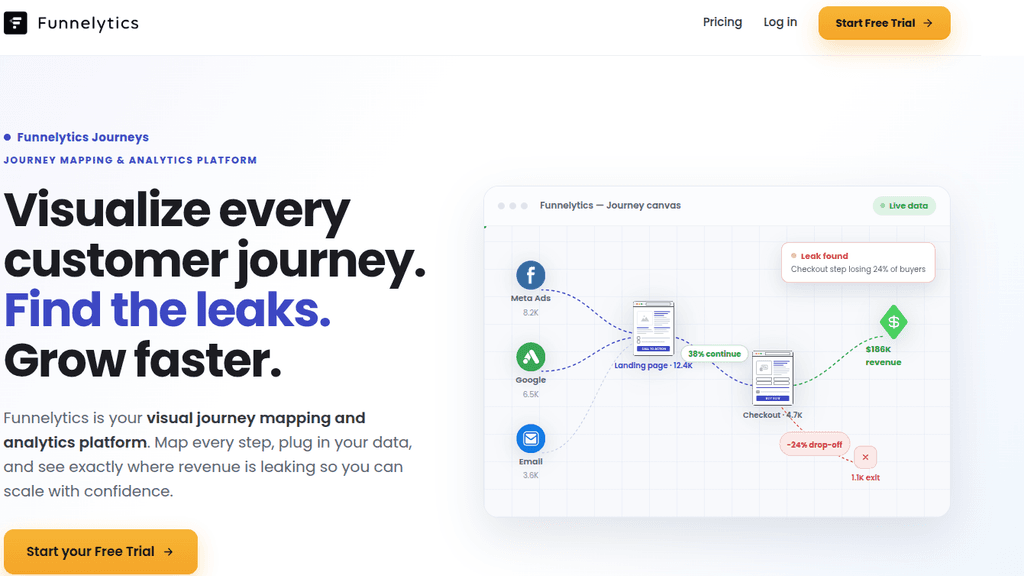
Funnelytics is built around visual marketing-funnel maps, with analytics available on higher plans. It suits marketers who need to design a multi-page or multi-channel path, present that journey clearly, and eventually overlay tracked activity to see where lead-generation efforts need attention.
Key features: Drag-and-drop funnel mapping, forecasting and journey planning, and lead-path tracking, conversion monitoring, alerts, and connected campaign analysis on the relevant Performance tiers. Its interface emphasizes visual communication as well as reporting.
Pricing: Map Pro starts at $39/month but is intended for planning. Performance Pro, which adds lead-generation journey tracking, starts at $129/month. Performance Business is listed at $349/month for more extensive journey and business-outcome analysis. Details appear on Funnelytics pricing.
When it is best: Agencies and growth marketers mapping campaign journeys and explaining them to stakeholders, especially when the planned flow is an important part of the work.
Important limitation: A mapping subscription alone should not be represented as full-funnel performance analytics. Teams needing detailed product-event cohorting may prefer a dedicated behavioral analytics platform.
How to choose the right funnel analysis tool
Start with the conversion you are actually trying to understand. A website visitor filling a lead form is different from a known user completing a feature onboarding sequence, and different again from a buying committee progressing toward an opportunity.
Selection becomes much easier when the journey and counting unit are clear.
Define the funnel: Write the exact steps, identify where each event originates, and specify what counts as completion. Decide whether steps must be strictly ordered or whether users may take other actions between them. Avoid treating a pageview as proof that an important product action succeeded.
Choose the unit of analysis: Sessions answer questions about visits; users about people; accounts about organizations. A B2B conversion can involve several contacts, so a user-only funnel may understate account progress. Determine whether b2b marketing attribution or account-level analysis is relevant.
Validate instrumentation: Test every event in a real staging or controlled environment. Check duplicate events, cross-domain navigation, consent constraints, and identity changes after sign-in. Small differences in implementation can make the same journey appear to have dramatically different conversion rates.
Check diagnostic depth: Funnels reveal the size and location of losses. Replay and errors reveal observable friction; surveys explain reported motivations; experiments estimate the effect of a proposed change. Favor a tool that supports the next question your team needs to answer.
Check integrations and governance: Confirm CRM, ad platform, warehouse, and server-side event access. Review retention periods, privacy controls, user permissions, exports, and whether conversion events are reliable enough for reporting.
Forecast pricing using your own data: Estimate monthly events, sessions, or MAUs, then account for replay caps, data-retention windows, extra seats, and support. Compare realistic monthly costs for your volume instead of selecting a winner by headline free allowance.
A practical evaluation checklist
- Tracking: Can the platform capture and validate every required funnel step?
- Counting: Can you explain its entry, repeat, identity, and conversion-window rules?
- Segments: Can you compare device, campaign, cohort, account, and region when needed?
- Investigation: Can your team move from the largest drop-off to supporting evidence?
- Action: Can findings inform experiments, onboarding changes, or campaign improvements?
- Governance: Do data controls, integrations, retention, and pricing fit your environment?
Best funnel analysis tools by business type
B2B SaaS: Usermaven is an attractive fit when the same team needs funnel breakdowns, company-level analysis, and attribution from campaigns to revenue. Mixpanel or Amplitude may be preferable where behavioral product research is the dominant requirement. Technical teams may favor PostHog for experimentation and development workflows.
Product-led SaaS: Mixpanel and Amplitude are natural choices for activation and feature conversion analysis. PostHog adds flags and experiments, while Pendo is particularly relevant when onboarding guidance or adoption changes are part of the intervention.
Ecommerce: GA4 offers a free baseline for a correctly implemented purchase journey. Contentsquare, Fullstory, and Mouseflow add experience diagnostics around checkout, navigation, or form friction. Large retailers may need a combination rather than one platform.
Marketing agencies: Funnelytics can help map and communicate a multi-stage lead journey, provided the plan includes actual tracking when needed. Usermaven adds a stronger attribution-oriented angle for agencies evaluating campaign contribution beyond lead volume.
Privacy and deployment-sensitive teams: Matomo gives buyers a cloud versus self-managed choice. Teams should confirm hosting, consent, security, and plugin requirements rather than assume deployment control equals automatic compliance.
How much do funnel analysis tools cost?
Pricing reflects how a platform collects and processes data. Event-based systems commonly count every tracked action; session-based systems count visits or recordings; MAU-based systems focus on distinct monthly users; enterprise products may quote based on features, volumes, and support. These methods are not interchangeable.
The cheapest option can become more expensive if a small free plan forces teams to discard important events or limit replay. Conversely, advanced analytics may be unnecessary when a team only needs a basic lead or checkout funnel. Build a twelve-month estimate from observed volumes and expected growth.
Also compare analysis access. Free allowances may have caps on historical data, dashboards, segment complexity, or recordings. A quote-based plan should be evaluated against reporting requirements and ownership costs, not assumed to be unsuitable simply because it does not display a monthly sticker price.
Funnel analysis mistakes that lead to bad decisions
Mixing user and session counts: A visitor returning three times is not three unique customers. Ensure the numerator and denominator use compatible identity rules.
Ignoring missing events: A broken signup-complete event can make conversion appear to collapse while the underlying workflow continues. Monitor instrumentation before acting on sudden changes.
Confusing correlation with explanation: A sharp drop on mobile could reflect poor design, traffic mix, missing tracking, or different intent. The funnel shows where to investigate, not which hypothesis is true.
Comparing different windows: A same-day checkout funnel and a 30-day B2B conversion funnel answer different questions. Set time windows deliberately and compare like with like.
Optimizing an intermediate step alone: More trial signups do not necessarily mean more activated users or revenue. Use conversion funnel optimization to evaluate changes across the wider outcome.
How Usermaven connects funnels with marketing attribution
For growth teams, funnel analytics often becomes more valuable when they can compare the behavior of customers from different campaigns. Usermaven brings Funnels into the same environment as journeys, conversion goals, and multi-touch attribution, helping teams distinguish traffic volume from downstream customer progress.
A marketing team can use marketing attribution software to compare funnel completion by acquisition source and inspect whether segments progress to deeper conversion events.
Where tracked CRM or other imported business events are configured correctly, those events can also be used within the broader reporting environment. This helps bridge website activity and later funnel outcomes without claiming every offline interaction is automatically captured.
The platform’s documentation includes user-level and company-level funnels, configurable step order, optional steps, comparison views, conversion windows, and alerts.
Usermaven introduced recurring Maven AI Agents in September 2026 and the ability to save Maven AI-generated reports to dashboards and share Agent findings in October. These capabilities support repeated monitoring, while AI funnel insights can help teams investigate changes. Data-quality checks and causal tests remain essential.
For teams comparing campaigns and conversion journeys together, Usermaven can provide additional context. Book a demo to discuss your measurement setup.
FAQs
What is the best tool for funnel analysis?
There is no universal winner. Usermaven is a strong option for funnels connected to marketing attribution, Mixpanel and Amplitude for behavioral product funnels, GA4 for website and ecommerce entry-level analysis, and replay-focused tools for diagnosing experience friction. Match the choice to the journey, data requirements, and team.
What are the best free funnel analysis tools?
GA4 offers free funnel explorations. Mixpanel, Amplitude, and PostHog have event-limited free tiers, while Contentsquare, Fullstory, Pendo, and Mouseflow offer free plans with different session or user allowances. Check whether the particular funnel features you need are included at no cost.
Can funnel analytics show why users abandon a step?
Funnel analytics shows where measured progression declines. It rarely proves why. Session replay, error reports, customer feedback, usability tests, and experiments can help investigate or validate possible reasons.
What is the difference between open and closed funnels?
In an open funnel, users can qualify by entering at a later defined step. In a closed funnel, users must begin at the first step. Vendor-specific rules also govern event order and repeated attempts, so reports from different platforms are not necessarily equivalent.
Can I analyze B2B funnels by company instead of by user?
Yes, some platforms support account or company-level funnels, including Usermaven. Company analysis requires reliably associating people and events with the correct organizations, and you must define what qualifies an account as converted.
Should I choose a funnel builder or a funnel analysis tool?
Choose a builder when the primary goal is designing landing pages, forms, and marketing sequences. Choose an analysis tool when the goal is measuring actual step completion and drop-offs. A visual planning platform may offer both capabilities, but often on different plans.

Written by
Adeel Khan
Growth Marketing Expert
Adeel Khan is a full-stack SaaS marketer with 10+ years of experience in content marketing, paid advertising, analytics, and conversion rate optimization. He shares practical insights and strategies drawn from hands-on experience, helping B2B SaaS marketers improve performance and make better marketing decisions.
All articles by Adeel →