

Amplitude is a serious product analytics platform. It can reveal how people move through funnels, return to a product, and adopt features. But the best Amplitude alternative depends on the decision that is difficult to make with the current setup: improving onboarding, explaining marketing revenue, guiding users inside the product, or diagnosing UX friction.
When acquisition spans ad campaigns, content, a CRM, and eventual revenue, the comparison expands beyond product events to marketing attribution software. This guide evaluates ten Amplitude alternatives by their real strengths, pricing models, implementation effort, and measurement trade-offs.
Best Amplitude alternatives at a glance
| Alternative | Best fit | Main difference from Amplitude |
|---|---|---|
| Usermaven | Marketing attribution + SaaS product analytics | Connects acquisition and CRM revenue with product behavior |
| Google Analytics 4 | Google-centric website and app reporting | Free broad channel/event analysis |
| Mixpanel | Product analytics + experimentation | Strong event analysis, replays, experiments, and attribution |
| Heap | Autocapture and retroactive product analysis | Automatic behavioral capture plus Sense AI |
| Pendo | Product adoption and in-app guidance | Analytics coupled with guides, NPS, and feedback |
| Hotjar / Contentsquare | UX friction, replays, and feedback | Qualitative observation beyond product metrics |
| Chartbeat | Publishers and editorial teams | Real-time content and audience intelligence |
| Fathom Analytics | Simple website analytics | Lightweight traffic, events, and revenue tracking |
| Plausible Analytics | Simple, open-source web analytics | Lightweight reporting with events and funnels |
| Simple Analytics | Minimal website reporting | Cookie-free traffic reports without user-level journeys |
What Amplitude already does well
Replacing Amplitude only makes sense if another architecture fits better. Current Amplitude plans include product analytics, session replay, experimentation, feature flags, AI Agents, and MCP. The free tier includes up to 2 million events per month, and the Plus plan scales with usage. Growth and Enterprise are quote-based.
- Product behavior: Funnels, cohorts, retention, path analysis, and experiments help improve activation and engagement.
- AI: Built-in agents and MCP support are no longer unique differentiators for a challenger.
- Volume: Compare event-based pricing against session-, pageview-, or MAU-based billing before assuming one tool costs less.
- Implementation: Event definitions, user identification, governance, and consent still matter regardless of the analytics vendor.
The strongest reason to leave is a mismatch between the platform and the business question, not an assumption that Amplitude lacks fundamental analytics capabilities.
How to compare the ten alternatives
| Decision to make | Prioritize | Avoid assuming |
|---|---|---|
| Which channels produce revenue? | Marketing and CRM attribution | A signup always represents a paying customer |
| Why do users churn after signup? | Product events and retention cohorts | All event schemas are directly comparable |
| What prevents users from completing a task? | Funnels, replay, feedback | A funnel identifies the root cause by itself |
| Which content deserves editorial attention? | Publisher engagement and real-time testing | Pageviews measure the full reader experience |
| What is the simplest dashboard? | Traffic, events, goals, ease of use | A simple tracker replaces lifecycle analysis |
Top 10 Amplitude alternatives
1. Usermaven: Marketing attribution + product analytics

Usermaven is a strong Amplitude alternative when the measurement problem extends beyond in-product events. It connects acquisition sources and conversion paths with website and product behavior, CRM outcomes, and revenue. This is particularly useful for SaaS businesses where a signup is only the beginning of a longer revenue journey.
Unlike a platform chosen primarily for experimentation and behavioral analysis, Usermaven is positioned around marketing-to-revenue measurement. The goal is to see not just which customers activate, but which campaigns brought customers who eventually generate meaningful revenue.
Attribution and conversion paths
Multi-touch attribution helps compare source, channel, paid ads, content, and conversion paths. Usermaven offers standard attribution models, plus custom attribution models for Enterprise workspaces announced in September 2026. When comparing models, evaluate their alternative allocations of the same conversions, never add attributed revenue from separate models together.

Funnels, activation, and feature adoption
Use funnel analysis to investigate where prospects move from visit to signup to activation, then use product analytics to understand which features engaged users adopt. The same acquisition cohort may have very different activation or retention outcomes depending on its source.


Journeys, profiles, and segmentation
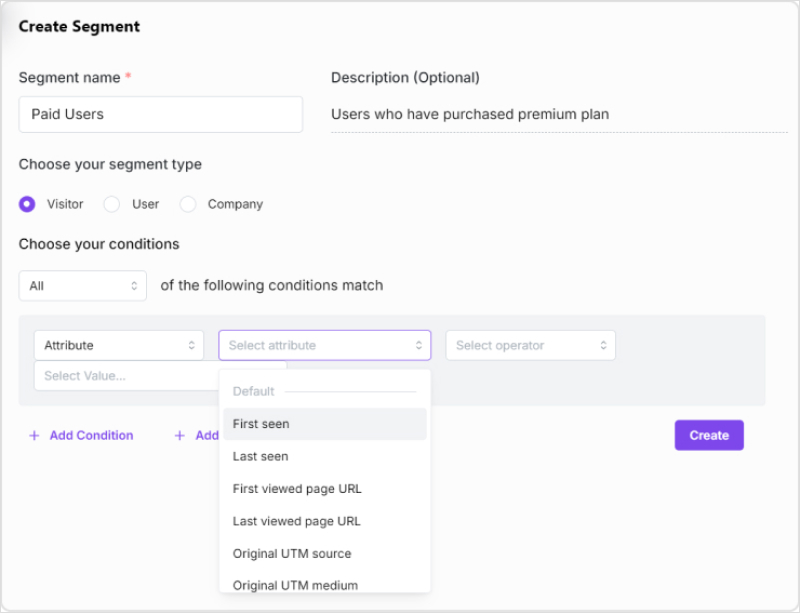
The user journeys view exposes sequences of measured touchpoints. Segments and Contacts Hub support follow-up analysis of user and account behavior. Cross-device and anonymous-to-known identity matching still depend on correctly configured identifiers and consent.


Onboarding, real-time reporting, and measurement
Track product onboarding alongside core conversion goals. Usermaven also provides real-time website reporting and a Measurement Trust Center, but attribution accuracy still requires validated events, sensible source rules, and reconciliation with CRM records.


Cookieless options and Maven AI
Usermaven supports a cookieless tracking option and pixel white-labeling. Neither feature removes the need to evaluate consent, disclosures, and applicable regulations. Maven AI can analyze funnels, attribution, and behavior; the September 2026 release introduced scheduled AI Agents for recurring investigations.


Its MCP support also makes authorized analytics available to compatible AI clients. The practical advantage is analyzing behavioral and attributed revenue data in one workflow, not claiming that competitors lack AI.
Pricing and best fit
Usermaven documentation for new customers describes Business and Enterprise plans with custom quotes. A separate public pricing page still shows Growth and Scale pricing, so confirm which structure applies when requesting a quote. For a marketing and product analytics evaluation, the B2B SaaS solution is especially relevant.
Best fit: SaaS and performance-marketing organizations that need to trace acquisition through activation, CRM pipeline, and revenue. Trade-off: Not a direct substitute for every experimentation, feature-flag, or session-replay workflow built into Amplitude.
2. Google Analytics 4: Google ecosystem reporting

Google Analytics 4 (GA4) is well suited to website/app event collection, channel reporting, Google Ads and Search Console integration, and free reporting. GA4 supports custom events, key events, explorations, and data-driven attribution for eligible advertising analysis. It should not be characterized as a basic pageview counter.
Pricing: Standard GA4 is free; Analytics 360 has enterprise pricing. For standard properties, user- and event-level exploration retention can be configured up to 14 months; this does not mean all aggregated reporting expires after 14 months.
Best fit: Organizations already working primarily in the Google ecosystem. Trade-off: Linking multi-touch engagement to CRM pipeline and product activation can require additional integrations, identity work, and data modeling.
3. Mixpanel: Deep product analytics and experiments

Mixpanel is one of Amplitude’s closest substitutes for product event analysis. It supports funnels, retention, flow reports, behavioral cohorts, experimentation, feature flags, session replay, autocapture, and AI-assisted investigation. Its pricing page also lists multi-touch attribution, so it is inaccurate to call Mixpanel a product-only tool without attribution.
Pricing: Free includes up to 1 million monthly events and 10,000 monthly session replays. Growth starts at $0 within its free event allowance and scales with event volume; Enterprise uses custom pricing.
Best fit: Product organizations seeking a direct Amplitude competitor with event analysis and experimentation. Trade-off: More extensive B2B CRM and pipeline attribution may still call for additional measurement architecture.
4. Heap: Autocapture and retroactive analysis

Heap helps product teams understand journeys without requiring every interaction to be manually tagged in advance. Its autocapture and retroactive event definitions are useful when the team wants to explore unanticipated behavior. Heap also offers Sense AI for supported paid tiers.
Pricing: Free includes up to 10,000 monthly sessions and six months of data history. Growth, Pro, and Premier offer expanded capabilities with plan-specific pricing.
Best fit: Product teams prioritizing automatic interaction capture and retrospective analysis. Trade-off: A well-defined event taxonomy is still important for trustworthy conclusions; autocapture does not automatically establish business meaning.
5. Pendo: Product adoption and in-app guides

Pendo combines product analytics with in-app onboarding, guides, NPS, surveys, and product adoption workflows. That makes it particularly useful when the next step after measuring friction is to change the experience inside the application.
Pricing: Pendo Free supports up to 500 monthly active users; paid Base, Core, and Ultimate plans are quote-based. Pricing depends on tracked MAUs and selected functions.
Best fit: Product adoption, onboarding, and user guidance. Trade-off: Marketing-to-CRM revenue attribution is not its primary buying rationale.
6. Hotjar: Replays, heatmaps, and feedback

Hotjar has been integrated into Contentsquare. Heatmaps, recordings, surveys, and experience analytics now sit within the Contentsquare suite, alongside product analytics options. This is not a one-to-one product analytics replacement for Amplitude.
Pricing: Contentsquare offers a free entry tier; Growth, Pro, and Enterprise offerings vary by product and usage. Legacy Hotjar prices such as $32 for Plus should not be treated as the current default.
Best fit: UX teams diagnosing friction with recordings and direct feedback. Trade-off: Session observation does not by itself connect marketing spend to customer lifetime revenue.
7. Chartbeat: Publisher and content analytics

Chartbeat focuses on real-time editorial performance, engaged attention, content recirculation, and headline testing. It is a specialist alternative for media and publishing, rather than a broad substitute for Amplitude’s software product analytics.
Pricing: Chartbeat uses sales-led pricing based on website and app pageviews, with Essentials and Plus offerings. Its Essentials plan documents historical content analysis for up to 13 months, so the claim that it lacks meaningful historical reporting is misleading.
Best fit: Newsrooms and editorial publishers. Trade-off: Less appropriate for measuring SaaS feature adoption or CRM-linked revenue attribution.
8. Fathom Analytics: Lightweight traffic reporting

Fathom Analytics provides a simple dashboard with traffic sources, UTM campaigns, custom events, revenue tracking, exports, and API access. Its simplicity is a deliberate product choice, not an absence of goal or revenue tracking.
Pricing: Starts at $15 per month for 100,000 monthly pageviews, with 50 sites included and higher usage tiers available.
Best fit: Small businesses, content sites, and agencies that mainly need clear traffic and campaign reports. Trade-off: Does not replace advanced individual product journeys, retention cohorts, or CRM revenue attribution.
9. Plausible: Simple open-source web analytics

Plausible is a lightweight web analytics option with traffic reports, custom events, goals, funnels, ecommerce revenue tracking, and optional self-hosting. Its paid features and allowances depend on plan.
Pricing: At the 10,000-pageview tier, published plans start around $9 per month; higher plans provide additional functions and limits. Confirm the billing period and current tier when comparing.
Best fit: Site owners who want simple analytics and control over deployment. Trade-off: It is not designed to be the same sort of behavioral SaaS intelligence suite as Amplitude.
10. Simple Analytics: Minimal traffic reporting

Simple Analytics emphasizes cookie-free website analytics with a compact dashboard and simple event reporting. It is an intentionally narrower choice for readers who do not need extensive product behavior or attribution modeling.
Pricing: A free hobby tier is available with limited history and required badge placement; paid self-serve pricing starts around £20 per month at the displayed 100,000-pageview tier. Prices and allowances depend on selections.
Best fit: Straightforward website analytics with minimal setup. Trade-off: Not a substitute for product-led lifecycle measurement or CRM revenue analysis.
Example: Why acquisition quality changes the shortlist
Consider two illustrative acquisition campaigns. Both may look effective in a signup dashboard, yet their downstream value differs once activation and revenue are matched to the same customer cohort. These numbers are examples, not product benchmarks.
| Metric | Paid search | Organic content |
|---|---|---|
| Signups | 200 | 100 |
| Activated accounts | 50 | 45 |
| Activation rate | 25% | 45% |
| New paying customers | 10 | 15 |
| Measured customer revenue | $12,000 | $18,000 |
Calculation: Activation rate = activated accounts ÷ signups × 100. Paid search: 50 ÷ 200 = 25%. Organic content: 45 ÷ 100 = 45%. The second campaign creates fewer signups but more paying customers in this example.
A product analytics platform can reveal the activation gap. To decide where to increase acquisition spend, the business also needs channel cost, reliable customer identity, and revenue linked to source. Attributed revenue is model-based credit, not proof that a campaign caused a sale.
Five checks before switching from Amplitude
- 1. Define the measurement question: Decide whether the missing answer concerns product adoption, marketing revenue, editorial attention, or session friction.
- 2. Audit events and goals: Inventory key events, conversions, their properties, and the definitions used by existing Amplitude reports.
- 3. Validate identity and source data: Confirm anonymous-to-known transitions, UTMs, referral exclusions, consent effects, and CRM joins where relevant.
- 4. Reconcile reporting: Compare signup, activation, customer, and revenue counts with your systems of record using the same date and conversion definitions.
- 5. Compare cost and operational fit: Model realistic events, sessions, pageviews, seats, history, implementation time, and missing specialized features.
Do not combine revenue totals from first-touch, last-touch, and multi-touch models. They are alternative allocations of overlapping conversions, not additive new revenue streams.
Which Amplitude alternative is the best fit?
There is no universal winner. Mixpanel and Heap are direct behavioral competitors; Pendo is strongest when in-app guidance drives the purchase; Contentsquare and Hotjar prioritize experience diagnosis; Chartbeat fits publishing; and Fathom, Plausible, and Simple Analytics simplify website reporting. GA4 is compelling inside the Google ecosystem.
Usermaven makes the most sense when the central problem is linking marketing acquisition to product activation, CRM outcomes, and revenue, rather than replacing every experimentation or replay feature Amplitude provides. Agencies with multi-client attribution work can also review the marketing agencies solution.
To see how those acquisition and product journeys would be measured together, book a Usermaven demo tailored to your analytics and attribution questions.
[insight_growth]
FAQs
1. What is the best alternative to Amplitude?
For direct event-based product analytics, Mixpanel and Heap are close alternatives. Usermaven is a stronger fit when marketing attribution, product behavior, CRM pipeline, and revenue need to be analyzed together. Pendo specializes in adoption and in-app guidance.
2. Is there a free Amplitude alternative?
Yes. GA4 has a free standard property; Mixpanel includes up to 1 million monthly events; Heap offers up to 10,000 monthly sessions; and Pendo has a free tier for up to 500 monthly active users. Allowances and functions differ.
3. How does Usermaven compare with Amplitude?
Amplitude emphasizes product analytics, experimentation, and AI across digital journeys. Usermaven emphasizes marketing attribution connected to website behavior, product analytics, CRM outcomes, and revenue. The better option depends on which decisions matter most.
4. Do Amplitude and Mixpanel both support AI?
Yes. Amplitude offers AI Agents and MCP in its current product plans, while Mixpanel includes Mixpanel Agent and MCP capabilities. The comparison should focus on what data each system can access and which workflows are supported.
5. Which alternative is best for autocapture?
Heap is a strong choice for automatic interaction capture and retroactive event analysis. Mixpanel also offers autocapture. No autocapture solution eliminates the need to validate event definitions and conversions.
6. Which alternative works best for SaaS marketing attribution?
Usermaven is useful when acquisition sources need to be tied to activation, CRM pipeline, and customer revenue. Teams should check source definitions, identity joins, conversion goals, and attribution models before trusting those reports.
7. Can Fathom or Plausible replace Amplitude?
They can replace Amplitude for organizations that only require website traffic, events, campaign tracking, and basic conversion reporting. They are not like-for-like replacements for deep product behavior, experimentation, and lifecycle analysis.
Updated

Written by
Adeel Khan
Growth Marketing Expert
Adeel Khan is a full-stack SaaS marketer with 10+ years of experience in content marketing, paid advertising, analytics, and conversion rate optimization. He shares practical insights and strategies drawn from hands-on experience, helping B2B SaaS marketers improve performance and make better marketing decisions.
All articles by Adeel →