Commerce continues to thrive in physical spaces such as stores, clinics, bank branches, and hotel lobbies. Each of these environments produces a wealth of signals: check-ins, queue times, purchases, and staff interactions. When captured, connected to the cloud, and enriched with modern analytics, these scattered data points transform into a clear and unified customer view.
Organizations increasingly use advanced systems to manage queues, bookings, and service flows across both digital and physical channels. By linking operational data with online behavior, businesses can gain a comprehensive understanding of the whole customer journey at every stage, rather than isolated fragments.
Building this view isn’t futuristic: it’s practical. It requires mapping every touchpoint, connecting devices and APIs, resolving identities, and prioritizing which signals need real-time action.
Done right, the result is a 360-degree profile that powers faster decisions, sharper insights, and personalization that feels genuinely relevant.
Why a unified customer view matters right now
Customers flit between channels faster than ever. Someone might research an item on a phone, call a branch to check stock, visit in person, and then finish the transaction online. Without stitching those sessions together, the journey looks like unrelated fragments.
What changes when those fragments join up?
Causality emerges. Did a long lobby wait reduce the chance of a follow-up visit? Did a busy Saturday morning correlate with smaller basket sizes? Unified analytics lets you see those links.
Operational blind spots disappear. If floor-level bottlenecks show up alongside web funnel drop-offs, leaders can adjust staffing, floor layout, or digital messaging in meaningful ways.
Personalization becomes reliable. Offers and campaigns stop being based on guesses and start being informed by complete behavior across every channel.
This is not theoretical. A practical illustration of how businesses can bridge physical and digital touchpoints to create a smoother customer journey can be found at Q-nomy, where solutions for enterprise flow and appointment management are designed to cut wait times. Firms that invest in unified, omnichannel data and orchestration capture better conversion and higher customer satisfaction.
What counts as physical-service data
Physical-service data is broader than it sounds. Think beyond just “someone walked in.”
Useful signals include:
Check-ins and appointment records: Data captured at kiosks or reception stations.
Queue metrics: Includes position, average wait time, abandonment rates, and rejoin events.
Footfall counts and occupancy sensors: Track when areas are busiest.
Staff activity logs: Records of who served which guest and the duration of interactions.
Beacon, NFC, or RFID reads: Monitor movement or proximity within a location.
QR scans, loyalty-card swipes, and payment tokens: Link in-store visits to customer profiles. Businesses can further improve offline-to-online attribution by using QR code analytics to measure scan activity, identify high-performing touchpoints, and better understand customer engagement across physical and digital channels.
Kiosk interactions and digital signage impressions: Capture customer intent.
Each of these events is a timestamped data point. The real challenge is turning them into a coherent timeline that can be aligned with web and mobile interactions.
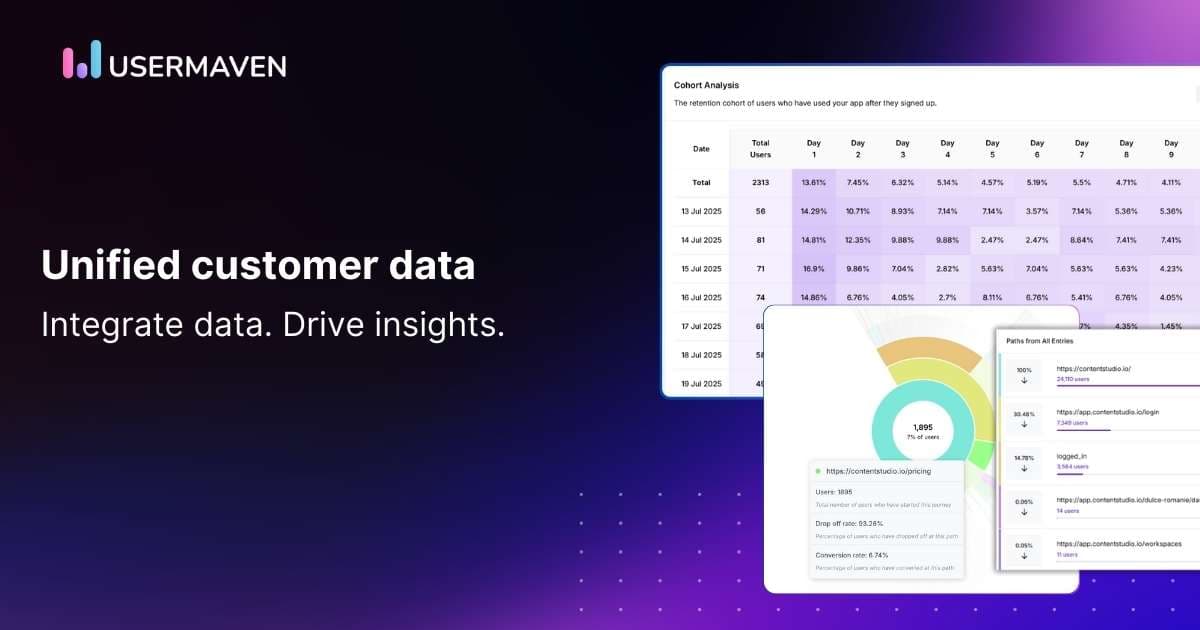
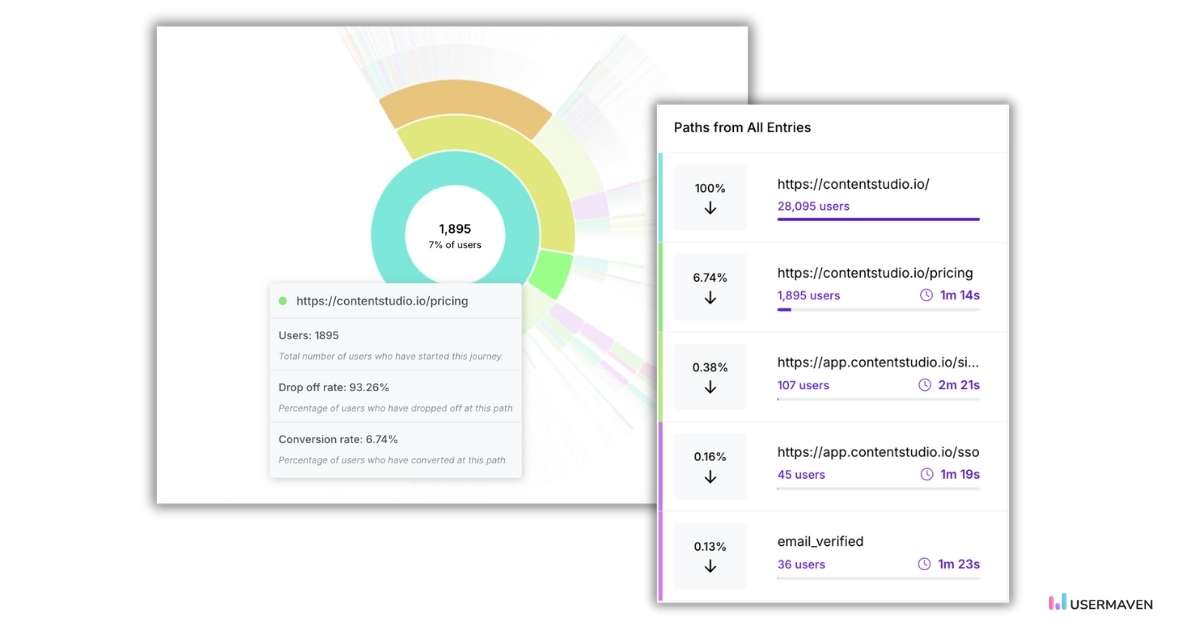
When physical-service data is combined with the digital signals captured by SaaS attribution platforms, businesses can finally see the complete customer journey rather than fragmented snapshots.
When physical-service data is combined with digital signals from product analytics in Usermaven, businesses can finally see the complete customer journey rather than fragmented snapshots.
The technical stack in plain terms
Integrating offline and online data usually follows a repeatable pattern. The main stages include:
Capture layer: Edge devices, such as kiosks, POS terminals, and queue systems, emit events. Modern systems expose APIs or webhooks, while older hardware may need middleware adapters.
Ingestion layer: Events arrive via webhooks, message queues, or batched uploads. High-volume setups often use streaming platforms such as Kafka, while smaller organizations may push data to a secure API endpoint.
Processing & enrichment: Raw events are standardized by normalizing timestamps, mapping device IDs, and enriching records with identifiers like loyalty IDs or hashed phone numbers.
Storage & modeling: Data is stored in a warehouse or lakehouse for historical analysis, while streaming databases or in-memory caches handle low-latency operational queries.
Identity resolution: Offline events are linked to customer records through deterministic matching (email, phone, loyalty card) or probabilistic methods (behavioral fingerprinting). This step must remain auditable and privacy-compliant.
Activation: Enriched profiles feed downstream systems, powering CRM updates, personalized offers, staff alerts, or dynamic routing rules across channels.
Visualization & experimentation:Dashboards, cohort analysis, and A/B tests measure the impact of changes, such as whether shorter wait times improve conversion or satisfaction.
Identity resolution: Balancing practicality and privacy
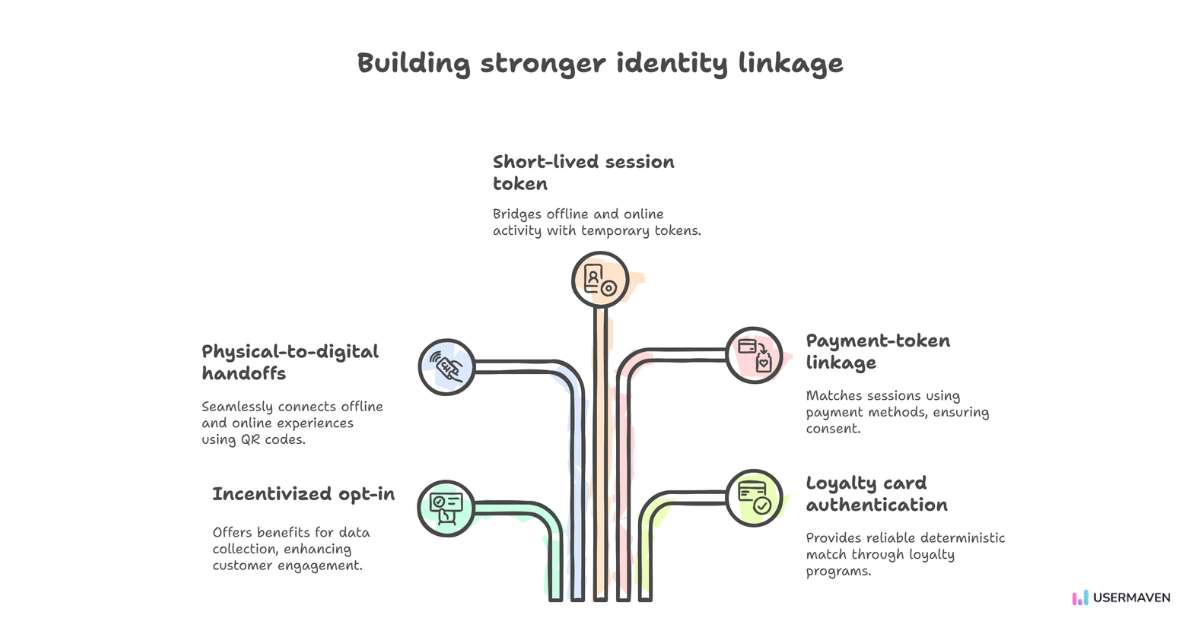
Connecting an in-store visit to a customer profile is one of the most valuable steps in building a 360-degree view, but it is also one of the most challenging. Direct identifiers, such as entering an email, scanning a QR code, or swiping a loyalty card, make the process straightforward. Indirect methods are less precise and require careful handling.
Effective tactics that strengthen identity linkage without compromising trust include:
Incentivized opt-in: Offer a digital receipt, loyalty points, or a small benefit in exchange for an email or phone number at check-in.
Physical-to-digital handoffs: Use QR codes on receipts or screens so a quick scan connects the in-store visit with a device session.
Short-lived session token: Generate kiosk tokens that customers can confirm later through their phone to bridge offline and online activity.
Payment-token linkage: With consent, match in-store and online sessions when the same payment method is used.
Loyalty card or app authentication: Provide the cleanest and most reliable deterministic match between offline and online behavior.
Above all, privacy and compliance must guide every decision. Identifiers should be hashed in transit, consent records stored, data retention minimized, and opt-outs made simple. Regulations like GDPR and CCPA make it clear that consent and purpose must be transparent from the very beginning.
Real-world use cases that drive impact
When offline events are integrated with SaaS-driven analytics, the benefits become tangible and measurable across industries:
Retail: Combining footfall data with POS receipts reveals conversion per visit, not just per session. This insight informs staffing levels, merchandising strategies, and the timing of promotions, and it can also guide how businesses produce and test custom prototypes and end-use parts tailored to evolving demand.
Healthcare: Appointment data and queue metrics highlight where no-shows occur and which reminder strategies are most effective, allowing clinics to reclaim valuable hours for higher-impact care.
Banking: Linking branch interactions to product records shows which experiences lead to new accounts or successful cross-sells. Appointment routing and prioritization help safeguard high-value opportunities.
Hospitality: Long front desk waits that correlate with lower guest spending can be offset by proactive recovery gestures at check-in or timely service nudges during a stay.
Public services: Queue patterns mapped to case types uncover procedural bottlenecks, while digital triage can redirect straightforward requests to faster, more efficient channels.
Together, these examples illustrate a key truth: offline signals paired with digital analytics answer questions that siloed data simply cannot.
Key metrics that drive value
Once offline and online events are consolidated into a central analytics hub, the next step is identifying the right metrics.
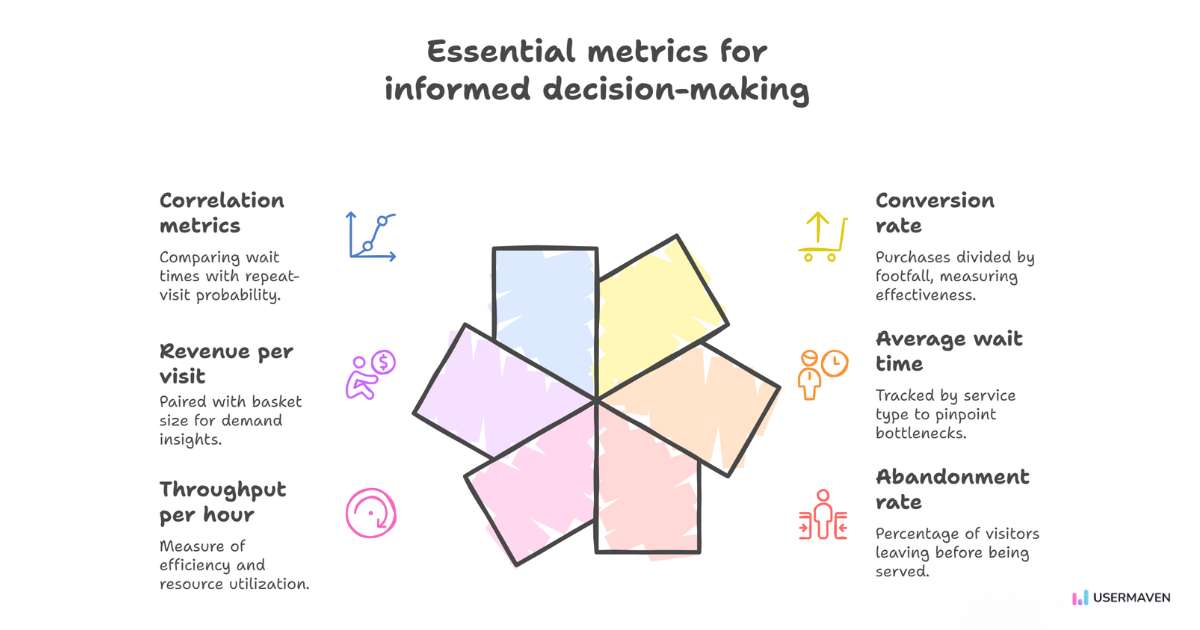
A focused set of these metrics becomes essential for informed decision-making:
True conversion rate: Purchases divided by actual footfall, giving a more accurate measure of effectiveness than session-based conversion.
Average wait time: Tracked by service type and location to pinpoint bottlenecks.
Abandonment rate: The percentage of visitors who leave before being served.
Throughput per staff hour: A measure of efficiency and resource utilization.
Revenue per visit: Paired with average basket size by time of day for demand insights.
Correlation metrics: For example, comparing wait times with repeat-visit probability or Net Promoter Score (NPS).
Dashboards should not only report on these numbers in real time but also highlight emerging trends. Going a step further, real-time alerts, such as triggers for when average wait times exceed acceptable thresholds, help teams fix issues before they escalate into lost revenue or negative experiences.
Real-time vs. batch: Choosing the right approach
Not every insight needs to be delivered instantly. The specific use case should guide the decision to stream or batch data.
Real-time: When immediate action is required, such as opening service lanes, notifying staff of a VIP arrival, or pausing a promotion due to capacity limits.
Batch: Best suited for strategic reviews, like analyzing weekly staffing models, monthly conversion rates, or long-term cohort behavior.
Hybrid: Combines both approaches by streaming real-time data for operational triggers while aggregating data nightly or hourly for detailed strategic analysis.
This balance ensures swift reactions in the moment while supporting strategic decisions with in-depth analysis.
Practical rollout strategy
Successful integration projects transition quickly from mapping the journey to running a pilot, then scale methodically with discipline. Here’s how to do it:
Map the journey: Identify each physical touchpoint and the data it generates.
Prioritize high-value signals: Start with key data points like check-ins and POS receipts to capture the most impactful insights.
Determine data ingestion methods: Use direct webhooks for modern devices, or middleware for legacy hardware.
Create a minimal event model: Define essential data points such as event name, timestamp, device ID, and optional profile identifiers.
Pilot a single location: Keep metrics focused and measurable to assess the impact of the integration.
Define operational responses: Decide who will take action when specific thresholds are triggered.
Train frontline staff: Use short, scenario-based sessions to ensure buy-in and demonstrate quick wins.
Iterate in short cycles: Test, analyze, and refine in cycles of two to six weeks for continuous improvement.
Scale with structure: Standardize integrations, monitor performance, and implement security controls for a smooth rollout.
This iterative approach ensures a focused and effective integration, avoiding the pitfalls of large, unfocused rollouts that miss key objectives.
Common pitfalls in integration and how to avoid them
Integration projects often fail due to familiar challenges. Here’s how to address them proactively:
Poor data quality: Normalize data early in the process and validate it at the edge to ensure accuracy from the start.
Identity drift: Track confidence scores when matches are probabilistic and include them in your data model for transparency and better decision-making.
Latency surprises: Measure the full end-to-end time, from event capture to dashboard reporting, and set realistic Service Level Agreements (SLAs) for performance expectations.
Hardware brittleness: Plan for middleware to support older kiosks and printers, ensuring that legacy hardware integrates smoothly with newer systems.
Frontline pushback: Involve frontline staff early in the design process and highlight immediate operational benefits to secure their buy-in.
Privacy mistakes: Lock down consent flows and retention policies before launching any campaigns to ensure compliance from the start.
Architecture patterns and tools worth considering
Practical architectures often rely on well-established components that work together to create a unified view of the customer:
Event streaming for scale: Kafka or managed streaming services handle high-volume, real-time event flow.
Lightweight middleware for legacy devices: Bridges older hardware by translating proprietary protocols into APIs.
Data warehouse as source of truth: Platforms like Snowflake or BigQuery serve as central repositories for historical data.
Identity graph or CDP to stitch profiles: Resolves fragmented identifiers into unified customer records.
BI and visualization tools: Combine real-time state with long-term trends for deeper analysis and reporting.
Orchestration layer for activation: Triggers CRM updates, SMS notifications, or staff alerts based on data-driven signals.
Choose tools that match your team’s skill set and scale requirements. There’s no need to over-engineer early pilots. Instead, focus on simplicity, testing, and iteration.
Industry insights on integration
Integrating offline and online touchpoints is not just a trend; it’s a key driver of competitive customer experiences. Leading consultancies and thought leaders emphasize that cross-channel orchestration and the resulting 360° customer view are essential for success.
Research from McKinsey highlights how integrated strategies help orchestrate touchpoints across the customer journey, enabling a complete view. Similarly, Harvard Business Review underscores the importance of intelligent experience engines that rely on the 360° view to personalize and automate experiences at scale.
For teams planning and executing technical work, these perspectives provide valuable guidance for creating effective, repeatable integration patterns.
Conclusion
The integration of offline and online touchpoints is essential for creating a comprehensive, 360-degree customer view. This approach empowers businesses to personalize interactions, optimize operations, and enhance customer satisfaction.
As advanced attribution software, Usermaven helps bridge the gap between online and offline data sources, giving teams the insights needed to connect customer touchpoints, improve decision-making, and create seamless, data-driven customer experiences.
Drive business growth with AI-powered analytics
*No credit card required
FAQs
1. How do offline touchpoints contribute to a 360° customer view?
Integrating physical-service events with a SaaS analytics stack turns fragmented data into a comprehensive narrative, providing a unified view of customer interactions.
2. What are the first steps to start integrating offline data?
Begin by mapping three key offline touchpoints, instrumenting a pilot location, and building a dashboard to track essential metrics like footfall, conversion, and wait times.
3. What makes successful integration achievable?
Success relies on disciplined infrastructure, clear identity rules, privacy management, and a willingness to iterate based on simple, actionable metrics.
A SaaS marketing team evaluates six attribution tools over three months and signs a $ 24,000-a-year contract. Eight weeks into implementation, they realize the tool tracks pipeline beautifully but has no idea what happens to a customer after the deal closes. Choosing the wrong attribution tool is expensive twice, once in the contract, once in […]
Every company wants better data. But better data does not come from adding another dashboard, tracking every possible event, or giving the data team a long list of reports to build. That is where many analytics implementation projects start to go wrong. The tool may be powerful. The data may be there. The team may […]
Pricing is where product value turns into a real buying decision. It is also where a lot of good SaaS products start to feel harder to say yes to. That is why SaaS pricing models matter so much. The way you package, structure, and present price shapes how buyers compare options and decide whether your […]