Amplitude analytics is a well-known name in the analytics space, offering a comprehensive suite of tools to track user behavior and drive data-driven decisions. It has a robust feature set, but with that comes complexity and a pricing structure that doesn’t always align with the needs of smaller teams or startups.
For many businesses, navigating through its layers of functionality can feel more challenging than expected. While Amplitude delivers depth, it often leaves teams wishing for a solution that is straightforward, intuitive, and more budget-friendly.
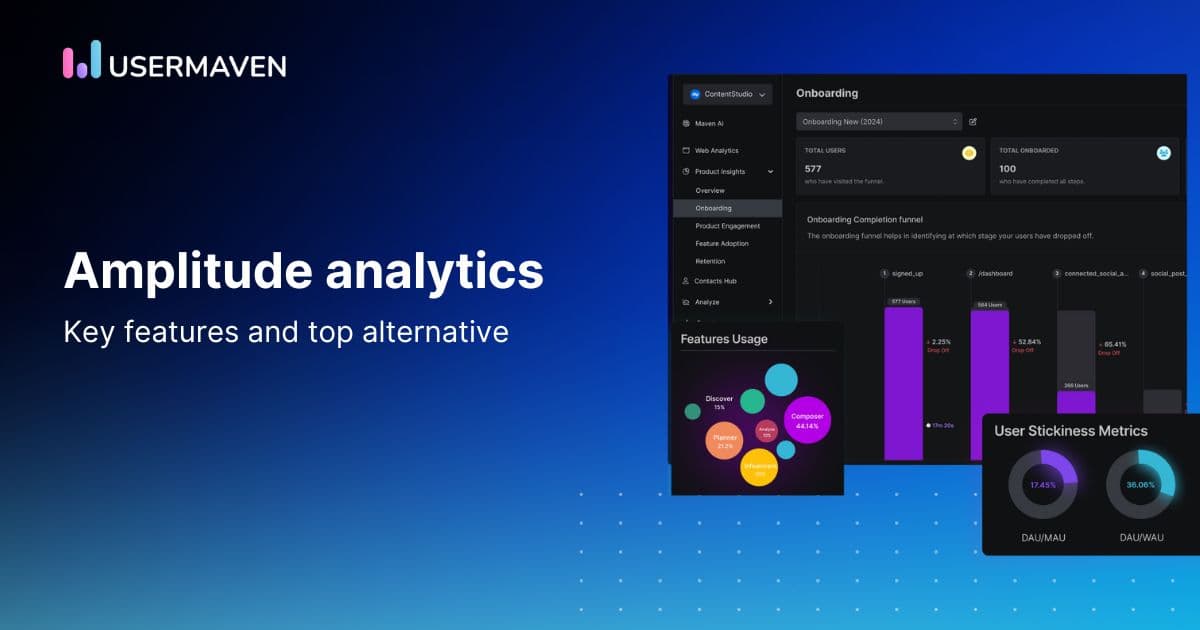
This blog explores the core features of Amplitude analytics, its potential drawbacks, and an alternative tool that prioritizes simplicity without sacrificing value.
Let’s take a closer look at what makes Amplitude analytics unique and why Usermaven might be the alternative you’ve been searching for.
What is Amplitude analytics?
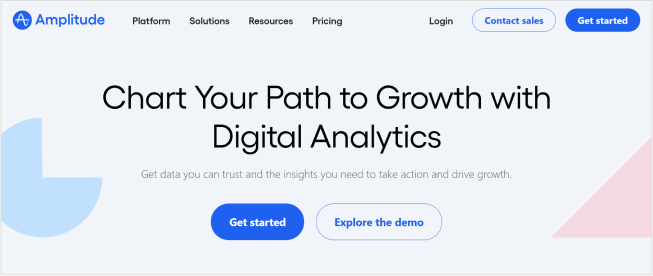
Amplitude analytics is a platform designed to help businesses make sense of user behavior. It provides advanced tools like event tracking, funnel analysis, and retention metrics to support data-driven growth. Companies use it to gain deeper insights into how users interact with their products, enabling them to refine experiences and boost engagement.
Despite its strengths, Amplitude analytics often caters to larger organizations with complex needs. Smaller teams or startups might find it challenging to navigate its extensive features or justify the cost. While the platform excels in depth, it doesn’t always align with the priorities of businesses looking for simplicity and efficiency.
For such teams, Usermaven offers a more accessible approach to analytics – focused, easy to use, and designed to deliver insights without unnecessary complexity.
Key features of Amplitude analytics
Amplitude analytics provides a range of tools to help businesses understand user behavior and make informed decisions. From event tracking to retention analysis, it offers features designed to uncover insights and drive growth. However, its complexity and steep learning curve can make it challenging for smaller teams to fully leverage its capabilities.
Event tracking and detailed user segmentation
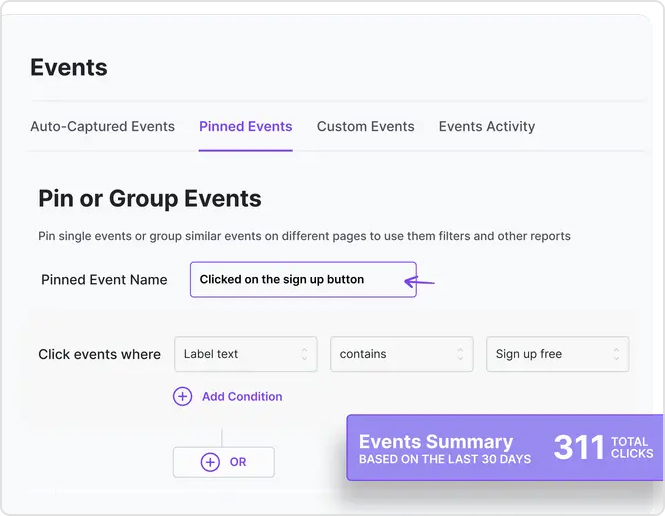
Amplitude analytics allows businesses to track user events and segment them based on behaviors and characteristics. This feature is crucial for understanding how users interact with your product. However, the level of detail and customization available can feel overwhelming for smaller teams or those without dedicated analytics expertise, often requiring significant setup time.
Funnel analysis
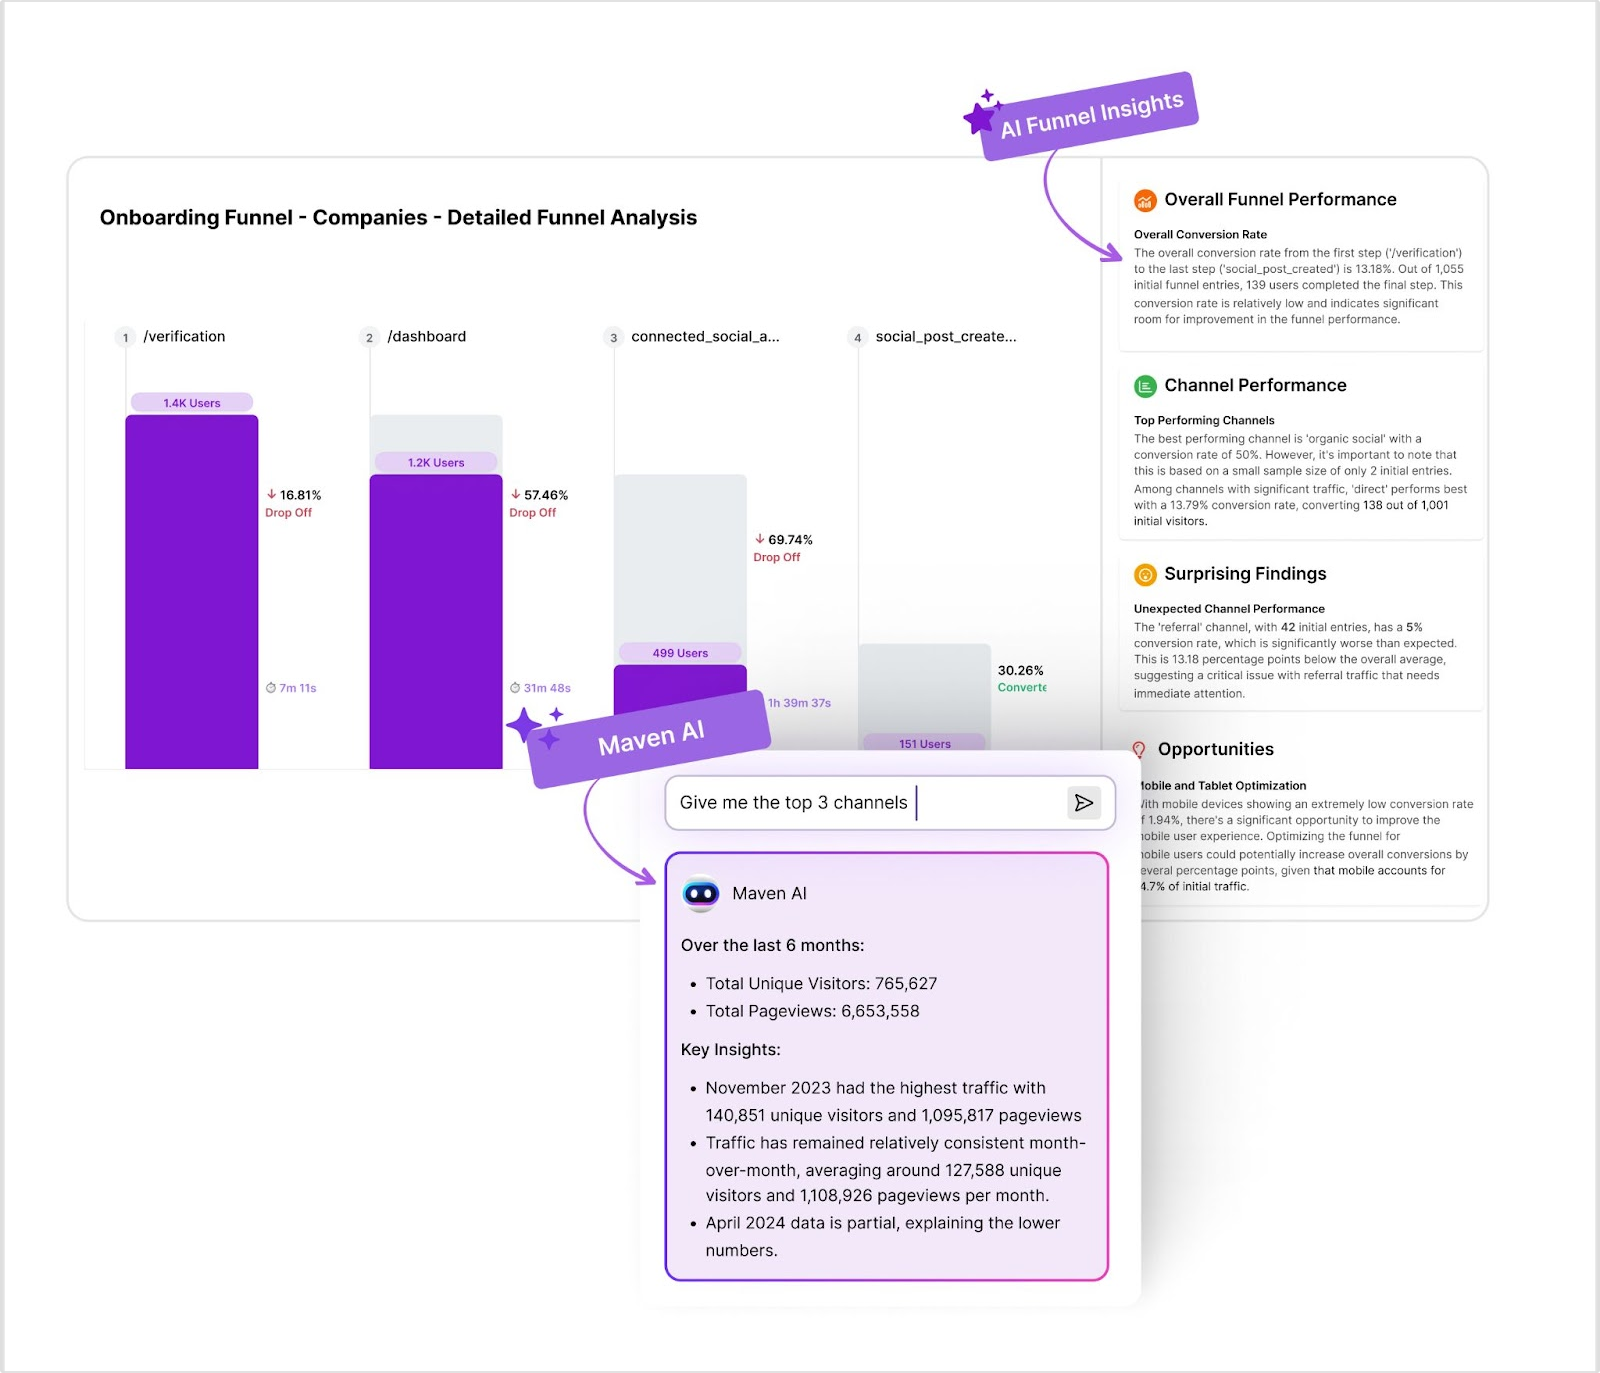
With funnel analysis, amplitude helps map out the steps users take within your product, revealing where drop-offs occur. This can be invaluable for optimizing conversion paths. On the downside, the platform’s complexity may mean spending too much time configuring funnels instead of quickly acting on the insights.
Retention analysis
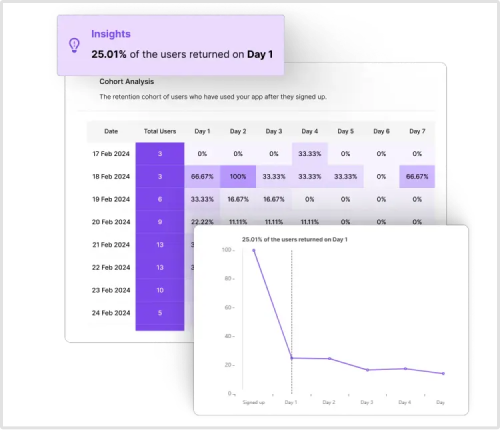
Amplitude’s retention analysis tracks user behavior over time to identify patterns that contribute to user retention. While this is helpful for spotting trends, extracting actionable insights often requires a steep learning curve. Smaller teams might struggle to translate these findings into clear strategies without additional resources.
Behavioral cohorts
Behavioral cohorts allow businesses to group users based on shared actions, such as signing up or completing a purchase. This can help refine targeting and personalization. However, setting up cohorts in amplitude can be tricky, especially for non-technical teams, and can slow down execution when quick decisions are needed.
Advanced data visualizations that require expertise
Amplitude offers a wide variety of visualizations to help teams interpret their data, from complex charts to interactive graphs. While these tools are impressive, they can feel daunting for teams unfamiliar with advanced analytics. Interpreting and acting on these visualizations often requires experienced data analysts.
Power up your SaaS
with perfect product analytics
Seamless integrations with a complex setup
Amplitude integrates with tools like Salesforce, segment, and others, making it easier to combine data from multiple sources. While great for large enterprises, smaller teams may find the integration process time-consuming and overly technical. The setup can sometimes feel more complex than the benefits it delivers.
Amplitude analytics offers powerful features but often requires significant time and expertise to fully utilize, making it less suitable for businesses seeking simplicity and speed. For a more accessible approach, tools like Usermaven provide actionable insights without the complexity.
Pros and cons of using Amplitude analytics
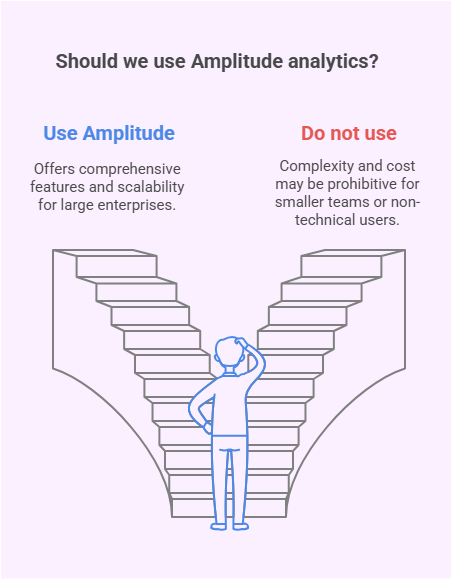
Amplitude analytics is a robust tool packed with features for tracking and analyzing user behavior. While it’s ideal for large enterprises and data-driven teams, its complexity, high costs, and steep learning curve can make it less practical for smaller teams or non-technical users. Here’s a closer look at its advantages and drawbacks.
Pros
- Comprehensive features for data-driven teams
Amplitude analytics provides a wide range of advanced features such as event tracking, behavioral cohorts, funnel analysis, and retention metrics. These tools are ideal for businesses that rely heavily on data to drive their decision-making processes. - Scalability for large enterprises
Amplitude is designed to handle the needs of large organizations, offering robust integrations and the ability to analyze vast amounts of data across multiple platforms. This scalability makes it a preferred choice for enterprises with complex analytics requirements.
Cons
- Complexity for smaller teams or startups
While its features are extensive, Amplitude’s complexity can pose a challenge for smaller teams or businesses without dedicated analytics experts. The platform often requires significant time and effort to be set up and fully utilized. - Expensive pricing model
Amplitude’s pricing is on the higher end, making it less accessible for startups and small businesses operating with limited budgets. Many teams struggle to justify the cost, especially when they don’t need all the advanced features the platform offers. - Overwhelming features for non-technical users
Amplitude’s comprehensive toolset can feel overwhelming for teams that lack technical expertise. Non-technical users often find it difficult to navigate the platform and extract actionable insights without extensive training or support.
Power up your SaaS
with perfect product analytics
While Amplitude analytics offers powerful features for data-driven organizations, its complexity and cost make it less suitable for smaller businesses or teams seeking simplicity. Alternatives like Usermaven provide similar value with a more user-friendly approach and budget-friendly pricing.
Why Usermaven is the best alternative to Amplitude
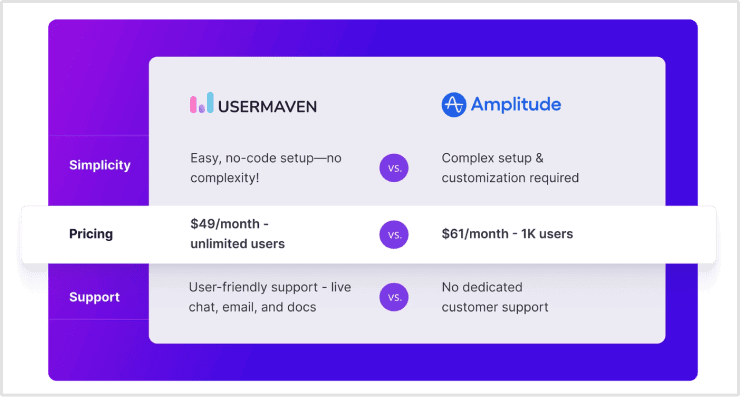
Usermaven offers a streamlined analytics experience tailored to startups and small businesses. Its simplicity, actionable insights, affordability, and dedicated support make it an ideal choice for teams that find Amplitude’s complexity and cost overwhelming.
Ease of setup and use
Usermaven’s intuitive design allows teams to get started with minimal effort. The platform eliminates the need for technical expertise, making it accessible to teams of all sizes. Unlike Amplitude, which often requires extensive setup and training, Usermaven ensures that users can focus on gaining insights rather than learning the tool.
Actionable insights
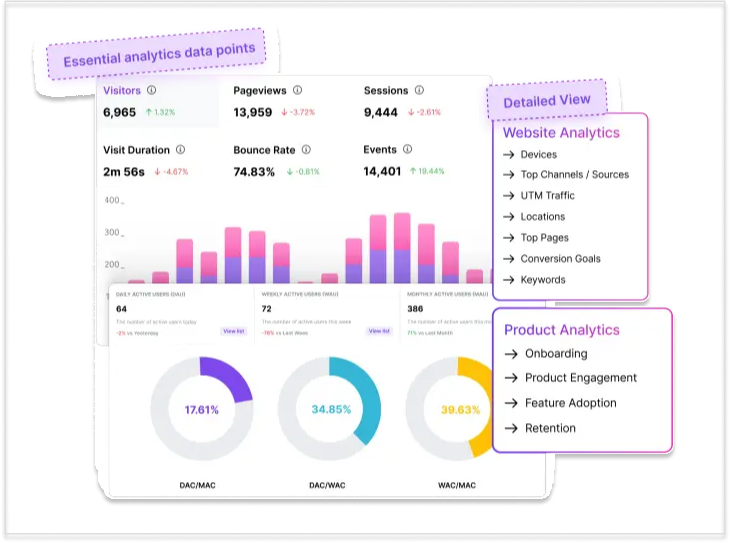
Usermaven prioritizes clarity by presenting key metrics and trends in a straightforward way. This ensures that teams can quickly identify what’s working and what needs improvement. Unlike Amplitude, which can overwhelm users with data, Usermaven focuses on delivering insights that teams can act on immediately.
Affordable pricing
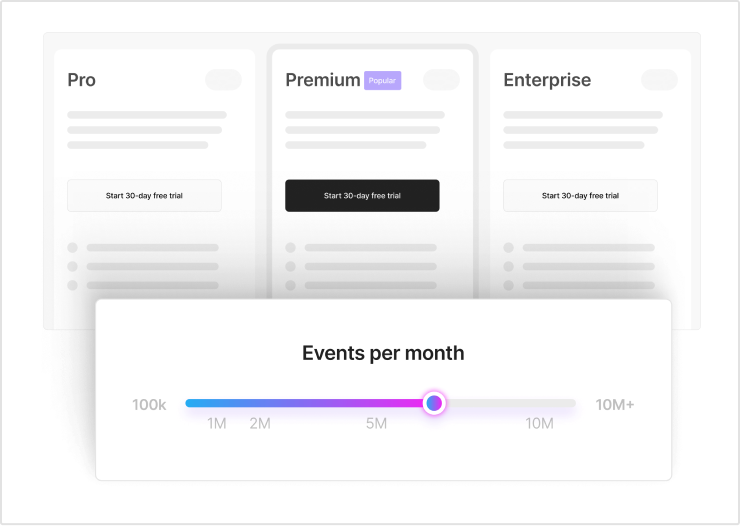
With a pricing model tailored for smaller budgets, Usermaven provides powerful analytics at a fraction of the Amplitude pricing. This makes it an excellent option for startups and growing businesses that need data-driven insights without breaking the bank.
Customer support
Usermaven offers exceptional customer support, ensuring that users get help when they need it. From onboarding to troubleshooting, the support team is focused on helping users succeed. In contrast to the more generalized support offered by Amplitude, Usermaven’s personalized approach creates a smoother experience for its users.
Usermaven delivers product analytics, funnels, automated event tracking, and as an advanced attribution software in one simple, affordable, and user-friendly platform, making it a strong alternative to Amplitude for businesses of all sizes.
Usermaven vs. Amplitude: A feature comparison
When comparing Usermaven and Amplitude, it’s clear that both platforms aim to provide actionable insights, but they cater to different audiences. Usermaven focuses on simplicity and accessibility, while Amplitude targets larger enterprises with complex needs. Below is a quick comparison of their key features:
| Feature | Usermaven | Amplitude |
| Setup | Effortless setup with no-code event tracking, ideal for non-technical users | Complex setup, more suited for developers |
| Integration | Easy integration with critical tools and platforms | Requires additional setup for some integrations |
| Support | Dedicated customer support team for personalized assistance | Generalized support; lacks smooth, personalized assistance |
| Ease of use | Intuitive interface, minimal learning curve | Complex, especially for beginners |
| Event tracking | Automated, no-code event tracking for easy setup and immediate insights | Manual event definition with code required for explicit tracking |
| Funnels | Highly customizable AI-powered funnels with in-depth, step-by-step analysis | Limited customization; ideal for complex user journeys but lacks AI insights |
| Attribution | Advanced AI-powered multi-touch models | Offers basic multi-touch attribution; no AI-powered insights |
| Feature adoption | In-depth analytics on feature adoption to identify users’ favorite features | No dedicated tool for feature adoption |
| Privacy | GDPR and CCPA compliant; provides cookieless tracking | GDPR and CCPA compliant but relies on cookies for data |
| Ad-blocker bypassing | Works seamlessly even when ad blockers are enabled | Does not work when ad blockers are enabled |
| Pricing | Pocket-friendly, generally more affordable | Can be more expensive, especially for large-scale usage |
| Integration with GSC | Offers seamless integration with GSC to track the organic position of keywords | Requires additional and complex integration setup to achieve similar functionality |
| Company-level reporting | Built-in, easy to use | Lacks company-level reporting |
| Data accuracy | Provides accurate real-time data; no data sampling | Uses machine learning for data sampling; lacks real-time accuracy |
| Slipping away users | Direct report available |
Conclusion
Amplitude analytics offers a wide range of features, but its complexity and high cost make it better suited for large enterprises with extensive analytics needs and dedicated resources. For many smaller teams and startups, Amplitude analytics can feel like using a sledgehammer to crack a nut – powerful but unnecessarily complicated.
Usermaven, on the other hand, stands out as a straightforward, budget-friendly alternative that doesn’t compromise on delivering actionable insights. Its intuitive interface, quick setup, and focused approach make it the perfect fit for teams that want clarity and efficiency without frustration.
Power up your SaaS
with perfect product analytics
FAQs about Amplitude analytics
1. Is Amplitude analytics easy to set up for small businesses?
Not entirely – its setup can feel overwhelming without a dedicated team or technical expertise.
2. Does Amplitude offer affordable pricing?
For small to mid-sized businesses, the pricing can quickly escalate as data volume grows.
3. Can Amplitude be used without engineering support?
Not effectively – many features require custom event tracking and developer assistance.
4. Is Amplitude’s learning curve manageable?
It’s steep; non-technical users may struggle to make the most out of its complex interface.
5. Does Amplitude provide personalized customer support?
Only at higher pricing tiers; basic plans often face slower response times.
6. Is Amplitude lightweight and fast?
No, its heavy features can slow down processes, especially for smaller teams.
7. Are all Amplitude features relevant for every user?
Not really – many advanced features may feel excessive or unnecessary for smaller projects.
8. Is data privacy straightforward with Amplitude?
Managing data compliance can be tricky and requires extra configurations.
9. Does Amplitude integrate seamlessly with all tools?
Updated

Written by
Adeel Khan
Growth Marketing Expert
Adeel Khan is a full-stack SaaS marketer with 10+ years of experience in content marketing, paid advertising, analytics, and conversion rate optimization. He shares practical insights and strategies drawn from hands-on experience, helping B2B SaaS marketers improve performance and make better marketing decisions.
All articles by Adeel →