Marketing teams rarely lack dashboards. They lack a dependable explanation for what changed, which campaigns contributed to valuable customers, and where to investigate next.
AI marketing analytics helps turn connected marketing data into questions, comparisons, and evidence-backed findings without requiring every marketer to build a report from scratch.

The advantage is not that artificial intelligence can magically repair missing tracking or choose the perfect budget. It is that analysts can investigate acquisition, conversion, and revenue more systematically. With reliable marketing attribution software and clearly defined outcomes, AI-assisted analysis can connect the performance story to business results rather than stopping at clicks.
This guide explains what AI marketing analytics means, where it is useful, how to implement it, and how to evaluate six different tools. It includes practical questions and quality checks you can adapt to your own marketing data.
Key takeaways
- Start with trustworthy data: AI analysis inherits missing events, mismatched identities, and inconsistent campaign names from its sources.
- Use AI to investigate: Natural-language analysis can explain metric changes and surface follow-up questions; it cannot establish causality from a dashboard alone.
- Connect marketing to outcomes: Compare leads, product activation, pipeline, and attributed revenue alongside traffic and spend.
- Choose the right workflow: Conversational assistants answer questions, while analytics agents can repeatedly investigate a defined objective on a schedule.
- Keep people accountable: Validate definitions and evidence before changing budgets, reporting revenue, or acting on a recommendation.
What is AI marketing analytics?
AI marketing analytics is the use of AI-enabled software to analyze marketing performance data, identify patterns, answer questions, generate reports, or assist with decisions. The data may include channel spend, website activity, campaign interactions, lead status, product events, customer purchases, and CRM revenue.
For example, instead of manually exporting four campaign reports, a marketer might ask: “Which sources generated the most demo bookings last month, and which gained or lost share compared with the previous month?” A connected analytics system can retrieve relevant measures and show the comparison. The marketer still needs to examine tracking coverage and the definition of a booked demo.
AI marketing analytics is not the same as AI-generated ad copy or AI search traffic analysis. The subject here is using AI to analyze marketing data and business outcomes. For a broader foundation in measurement terminology, marketing analytics explains the underlying metrics and reporting approaches.
Descriptive, diagnostic, predictive, and agentic analysis
These terms describe different jobs, not a universal progression toward greater accuracy:
| Approach | Question it addresses | Example output |
|---|---|---|
| Descriptive | What happened? | Paid search conversions declined compared with last month |
| Diagnostic | What may explain it? | A landing-page step or campaign mix changed during the decline |
| Predictive | What may happen? | An estimated likelihood of renewal, subject to model validation |
| Prescriptive | What could we do? | Test an onboarding change or revise campaign targeting |
| Agentic | What should be checked repeatedly? | A recurring investigation of acquisition and funnel changes |
Some products only summarize existing charts. Others can query connected datasets, create dashboards, or run autonomous read-only investigations. Do not assume a product performs predictive modeling merely because it has an AI chat interface.
Traditional vs. AI marketing analytics
Traditional analytics and AI-powered analytics can operate on the same tracking data. Their difference is often how a marketer explores that data and how much manual reporting work the system handles.
| Area | Traditional reporting workflow | AI-assisted analytics workflow |
|---|---|---|
| Starting point | Open a dashboard or build a report | Ask a question or assign an analysis objective |
| Exploration | Manually select dimensions, filters, and comparisons | System can retrieve relevant measures and suggest follow-ups |
| Reporting | Build charts and write commentary | Generate draft charts, summaries, or dashboards |
| Ongoing monitoring | Check a fixed report or alert | An agent may investigate multiple related changes on a schedule |
| Evidence quality | Depends on tracking and metric definitions | Still depends on the same tracking and definitions |
| Decision authority | Human evaluates and acts | Human should still verify and approve material decisions |
AI does not replace metric governance. A mislabeled qualified lead remains mislabeled whether a dashboard, SQL query, or language model displays it. Likewise, an attribution model estimates credit under its own rules; it does not prove incremental effect.
How AI marketing analytics works
Useful AI analysis follows a sequence: collect → reconcile → investigate → validate → communicate → act. The specific architecture depends on whether the product includes tracking and attribution or sits above a data warehouse and reporting stack.
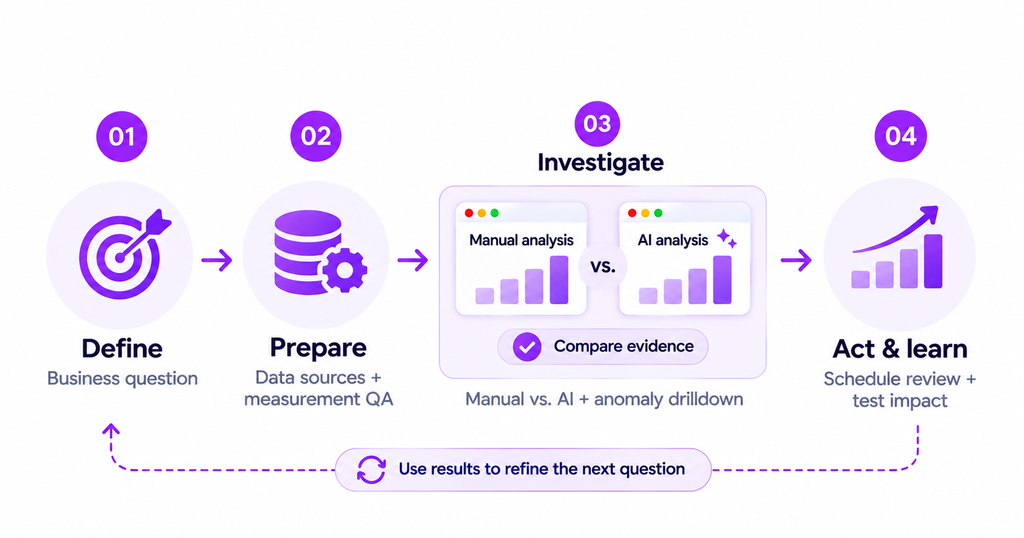
1. Collect data from the relevant systems
Bring together the inputs necessary for the question: ad-platform spend, analytics events, CRM lifecycle stages, email activity, subscriptions, or product usage. A question about trial activation requires product events; a question about sales pipeline requires trustworthy CRM stage and opportunity data.
Collecting everything is not the goal. The goal is having the right entities, event definitions, timestamps, and permitted access for the analysis.
2. Define shared metrics and customer identity
Agree on definitions for visitors, leads, activated users, qualified opportunities, conversions, and revenue. Decide whether a report is user-level or account-level and whether subscription revenue is gross, net, recognized, or collected.
If systems use different campaign names, time zones, or customer identifiers, reconcile those differences before asking AI to explain the numbers. Incomplete customer journey analytics can hide touchpoints rather than reveal them.
3. Ask a bounded question and compare periods
A precise prompt includes the business metric, comparison period, segment, and level of detail. “Why are sales down?” is too open-ended. “Compare demo-to-opportunity conversion for US paid-search leads over the last 30 days versus the preceding 30 days” gives a clearer starting point.
The system should show the underlying metric values and dimensions so a person can verify them. Treat any proposed explanation as a hypothesis until you inspect the evidence.
4. Validate findings before taking action
Check data freshness, sample sizes, tracking changes, attribution windows, and whether an event was counted twice. Confirm the comparison periods are equivalent and distinguish delayed conversions from actual performance declines.
If a channel appears to have high attributed revenue, inspect the model used to assign credit. Reported contribution is not the same as causal incrementality.
5. Turn useful analysis into a reusable report
Save the questions and visualizations that support decisions. Assign owners for alerts, establish a review cadence, and record whether the proposed action was implemented and tested. Analytics dashboards are more valuable when their charts answer agreed business questions rather than simply display every available metric.
See Usermaven in action
Book a free demo and discover how powerful analytics can grow your business.
Seven practical AI marketing analytics use cases
Each use case below specifies the question, required data, analytical output, and decision it could inform. Examples are workflows, not fabricated outcomes or results from a customer account.
1. Investigate changes in campaign performance
Question: Which campaigns improved or declined after the last budget or creative change?
Use spend, impressions, clicks, conversion goals, and comparable date ranges. AI can compare performance across campaigns, isolate unusually large shifts, and suggest related checks such as tracking changes or landing-page conversion rates.
Potential decision: Investigate a specific campaign’s creative, targeting, or measurement before reallocating funds. Do not treat a coincident performance change as proof of cause. A more detailed campaign analytics process can establish consistent definitions for the review.
2. Detect anomalies and investigate what changed
Question: Why did qualified leads or signups fall this week?
Connect conversion events, acquisition sources, page performance, and, where appropriate, CRM stages. An AI system may notice that one source lost traffic while another maintained visits but produced fewer conversions.
Potential decision: Check whether there is a tracking outage, campaign mix change, seasonality, or genuine funnel problem. Alerts should initiate investigation, not automatically establish the explanation.
3. Compare acquisition quality, not just acquisition volume
Question: Which channels bring customers who reach meaningful outcomes?
Use the initial acquisition source together with downstream trial activation, opportunity creation, purchase, or renewal data. An AI-assisted analysis can compare channel cohorts at similar lifecycle ages and identify where qualified conversions differ from raw leads.
Potential decision: Refine targeting or the follow-up experience for a segment. If identity matching is incomplete, explain how many outcomes remain unattributed rather than assigning false precision.
4. Diagnose conversion funnel drop-offs
Question: At which stage do otherwise eligible users stop progressing?
Define an ordered path such as landing page → signup → onboarding completed → first meaningful product action. Compare the steps by source, device, or segment, using consistent eligibility rules. A conversion funnel analytics software workflow can help marketers see these differences.
Potential decision: Test a more relevant landing page or onboarding change. A funnel correlation does not tell us whether the change will cause improvement; use an experiment or suitable comparison when feasible.
5. Analyze marketing attribution across touchpoints
Question: Which sources are credited for conversions and revenue under different models?
Use recorded journey touchpoints, conversion events, connected revenue, and a clearly stated attribution model. AI can make the model’s results easier to explore and help compare first-touch, last-touch, and multi-touch perspectives.
Potential decision: Investigate channels that contribute early in the journey but rarely receive last-click credit. Keep model assumptions transparent. The specialized AI-driven marketing attribution topic explores this method in more depth.
6. Understand customer engagement, retention, and value
Question: Do customers acquired from different sources activate and return at different rates?
Combine acquisition records with tracked product events, subscription outcomes, and retention cohorts. The analysis can compare users at similar points in their lifecycle and flag differences worth investigating.
Potential decision: Review onboarding or customer success priorities. For SaaS teams, product analytics software supplies the behavioral layer that traffic-only dashboards may miss. Avoid calling a descriptive segment a predicted churn probability.
7. Automate recurring marketing reporting and investigation
Question: What changed across channels, conversions, and customer behavior since the previous reporting period?
Specify the metrics and schedule, then have an AI analytics workflow assemble a report and flag exceptions. Reports should disclose the comparison period, filter conditions, and whether important data sources are missing.
Potential decision: Focus analyst time on the exceptions that matter. Recurring insight generation is not identical to scheduled delivery of a fixed dashboard, and neither should automatically change campaigns without appropriate controls.
How to implement AI marketing analytics step by step
Before buying another AI tool, pilot one decision that currently takes too long or requires too many disconnected reports. The workflow below works for a B2B SaaS growth team, an agency, or a performance marketer with some adaptation.
Step 1. Select one commercial question
A useful pilot might be: “Which channels generated trial accounts that activated during the last quarter?” Define the eligible accounts, activation event, period, and what decision the answer might change.
Step 2. Map the data required
List the acquisition source, user or account identifier, relevant event, conversion outcome, and time window. Identify whether sources connect directly to the tool or require a warehouse or integration.
Step 3. Check measurement health
Verify campaign naming, event duplication, consent handling, identity stitching, CRM mapping, source freshness, and data permissions. If a field is unavailable, document the limitation and narrow the pilot question instead of inventing an estimate.
Step 4. Run an initial analysis manually and with AI
Create a small trusted comparison to use as the baseline. Then ask the tool to produce the same breakdown and cite the source dimensions or records. Investigate any mismatch before scaling access or automating reporting.
Step 5. Follow up on the anomaly
Ask the system to split the result by the dimensions most likely to matter: channel, campaign, device, segment, landing page, or stage. Examine absolute counts alongside rates and check statistical uncertainty in small groups.
Step 6. Save the result and schedule review
Build a repeatable dashboard or recurring investigation that focuses on the agreed question. Give the review a clear owner and an escalation path for missing data or unexpected changes.
Step 7. Test the resulting business decision
If the analysis leads to a campaign or funnel change, record the hypothesis, intervention, and success metric. Use a controlled test where practical. AI may accelerate learning, but it cannot substitute for evaluating the effect of the action.
Example: An AI marketing analytics dashboard for a SaaS team
Rather than showing invented numbers, the following is a suggested specification for an acquisition-quality dashboard. A team could build it using its actual tracked and connected data.
| Dashboard element | Required data | Decision it supports |
|---|---|---|
| Channel acquisition | Visitors or leads by source and period | Identify mix shifts |
| Spend and conversions | Campaign spend, goal completions | Investigate efficiency changes |
| Activation funnel | Signup and meaningful product events | Find friction after acquisition |
| Qualified pipeline | CRM stages and associated accounts | Compare lead quality |
| Attribution by model | Customer touchpoints and selected conversion goal | Examine credit distribution |
| Retention cohort | Signup cohorts and later activity | Evaluate downstream customer quality |
Suggested natural-language questions include: “Compare qualified opportunities from paid search and organic search this quarter”; “Show the largest funnel drop-off by acquisition source”; and “Which campaigns lost attributed revenue share after last month’s change?”
Keep the reporting grain consistent. A company-level opportunity cannot be compared directly with a user-level signup without explaining the conversion from users to accounts. If multiple people from one account interact with campaigns, avoid counting them as multiple closed-won customers.
Six AI marketing analytics tools worth evaluating
These platforms have different roles in a marketing stack. The following comparison is based on vendor documentation and available public descriptions, not a controlled head-to-head test of analytics accuracy.
| Tool | Best fit | Main AI analytics strength | What to consider |
|---|---|---|---|
| Usermaven | SaaS and B2B attribution teams | Conversational and recurring analysis connected to attribution and behavior | Requires correctly configured conversion and integration data |
| Supermetrics | Teams consolidating marketing sources | Governed marketing data and AI-assisted reporting | Marketing-to-revenue logic depends on connected data and setup |
| Whatagraph | Agencies and multi-client teams | AI agents for cross-channel reports and recurring checks | Evaluate agent availability, permissions, and total plan cost |
| Improvado | Enterprise marketing data operations | AI analysis over standardized pipelines and governance | More complex implementation and procurement scope |
| Triple Whale | Ecommerce and DTC | Moby AI analysis in store-centric attribution views | Less tailored to B2B product adoption and CRM pipelines |
| Google Cloud | Data teams building custom systems | BigQuery, ML and advanced audience modeling | Requires technical ownership and ongoing data engineering |
1. Usermaven
Usermaven is marketing attribution software with website and product analytics capabilities, built to help teams connect acquisition activity with recorded customer behavior, conversions, and revenue. Its Maven AI assistant answers natural-language questions, generates reports, and creates dashboards from connected workspace data.
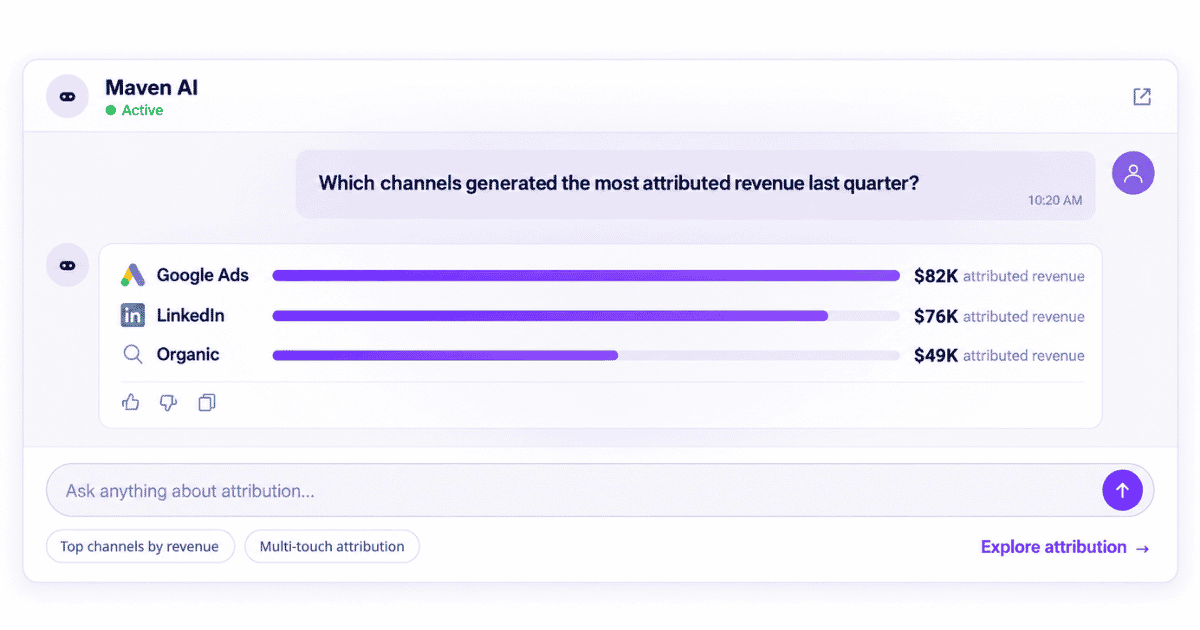
Key capabilities: Multi-touch and paid ads attribution; funnels and retention; customer journeys; Maven AI conversational analysis; Maven AI Agents; and analytics dashboards.
When it is best: B2B SaaS and growth teams that want AI-assisted analysis of marketing performance alongside product engagement and downstream customer outcomes, rather than a separate generic reporting layer.
What to consider: The quality of the conclusions depends on configured conversion goals, connected systems, data health, and attribution settings. Usermaven should not be described as automatically proving incrementality or providing every type of predictive model.
2. Supermetrics
Supermetrics specializes in connecting and preparing marketing data for reporting and AI-assisted workflows. For agencies comparing data connectors with ready-made analytics, client reporting tools vary in how they collect, analyze, and present marketing data.
Best for: Marketing operations teams that already know which data sources, dashboards, and warehouses they need but want more efficient data access and analysis. Verify the AI tools and connectors available in the proposed subscription.
What to consider: Data availability and standardization improve the reporting foundation, but organizations may still need to join CRM outcomes or product events to answer revenue-quality questions.
3. Whatagraph
Whatagraph focuses on cross-channel marketing reporting, especially for agencies and teams managing multiple brands. Its IQ Agents are described as supporting reporting, data-source checks, and repeatable workflows over connected metrics.
Best for: Agencies with recurring client reporting and a need to combine performance data from multiple marketing platforms.
What to consider: Confirm which agent features are generally available, which changes require approval, and how access and pricing work for the number of client accounts involved.
4. Improvado
Improvado provides an enterprise-focused marketing data pipeline with transformation, governance, dashboards, and an AI Agent that can analyze data and generate reports. The platform is designed for organizations with complex marketing data and analytics operations. Its warehouse-oriented approach is also considered alongside other enterprise marketing attribution platforms.
Best for: Larger marketing teams and agencies that need centralized definitions, cross-platform data governance, and AI analysis on top of standardized datasets.
What to consider: Implementation scope, required integrations, security reviews, and data ownership matter as much as the quality of the conversational interface.
5. Triple Whale
Triple Whale emphasizes ecommerce analytics and attribution. Its Moby AI experience supports analysis and investigation within store-focused reporting workflows, including Summary and Attribution views. Comparing Triple Whale and Usermaven highlights differences between ecommerce-focused reporting and broader customer journey measurement.
Best for: Ecommerce brands analyzing advertising, customer purchasing, and store performance together.
What to consider: Its ecommerce emphasis differs from the B2B SaaS requirements of pipeline stages, qualified opportunities, and product-led activation metrics.
6. Google Cloud
Google Cloud provides infrastructure for connected marketing analytics, BigQuery-based reporting, machine-learning models, and audience analysis. It is less a ready-made marketing attribution app and more a platform for teams building custom data solutions.
Best for: Data teams with technical resources and specific modeling, integration, or governance requirements that off-the-shelf analytics products do not meet.
What to consider: Budget for engineering, validation, model maintenance, cloud costs, and ongoing ownership. A custom system can be flexible without being simple or inexpensive.
How Usermaven supports AI marketing analytics
Usermaven’s advantage is the connection between its underlying analytics and the questions an AI assistant can answer. It combines marketing attribution with tracked website and product events, funnels, user journeys, retention, and connected CRM or revenue outcomes where configured.
Ask Maven AI about acquisition and customer behavior
Marketers can ask questions about channel performance, campaign conversions, journeys, funnels, or customer segments in plain language. Maven AI can create charts and analyses without requiring users to construct every report manually.
For example, a SaaS marketer could ask for a comparison of trial signups and activation across acquisition sources. The interpretation still depends on the team’s definition of activation, connected events, and source attribution. Relevant results can be saved into reusable dashboards rather than remaining isolated chat answers.
Automate performance monitoring with Maven AI Agents
Maven AI Agents extend the conversational assistant into recurring, autonomous analysis. Instead of waiting for a marketer to remember to ask what changed, an agent can be given an investigation objective, a schedule, and delivery settings. It then examines permitted workspace data and reports its findings, including supporting evidence and suggested follow-up questions.
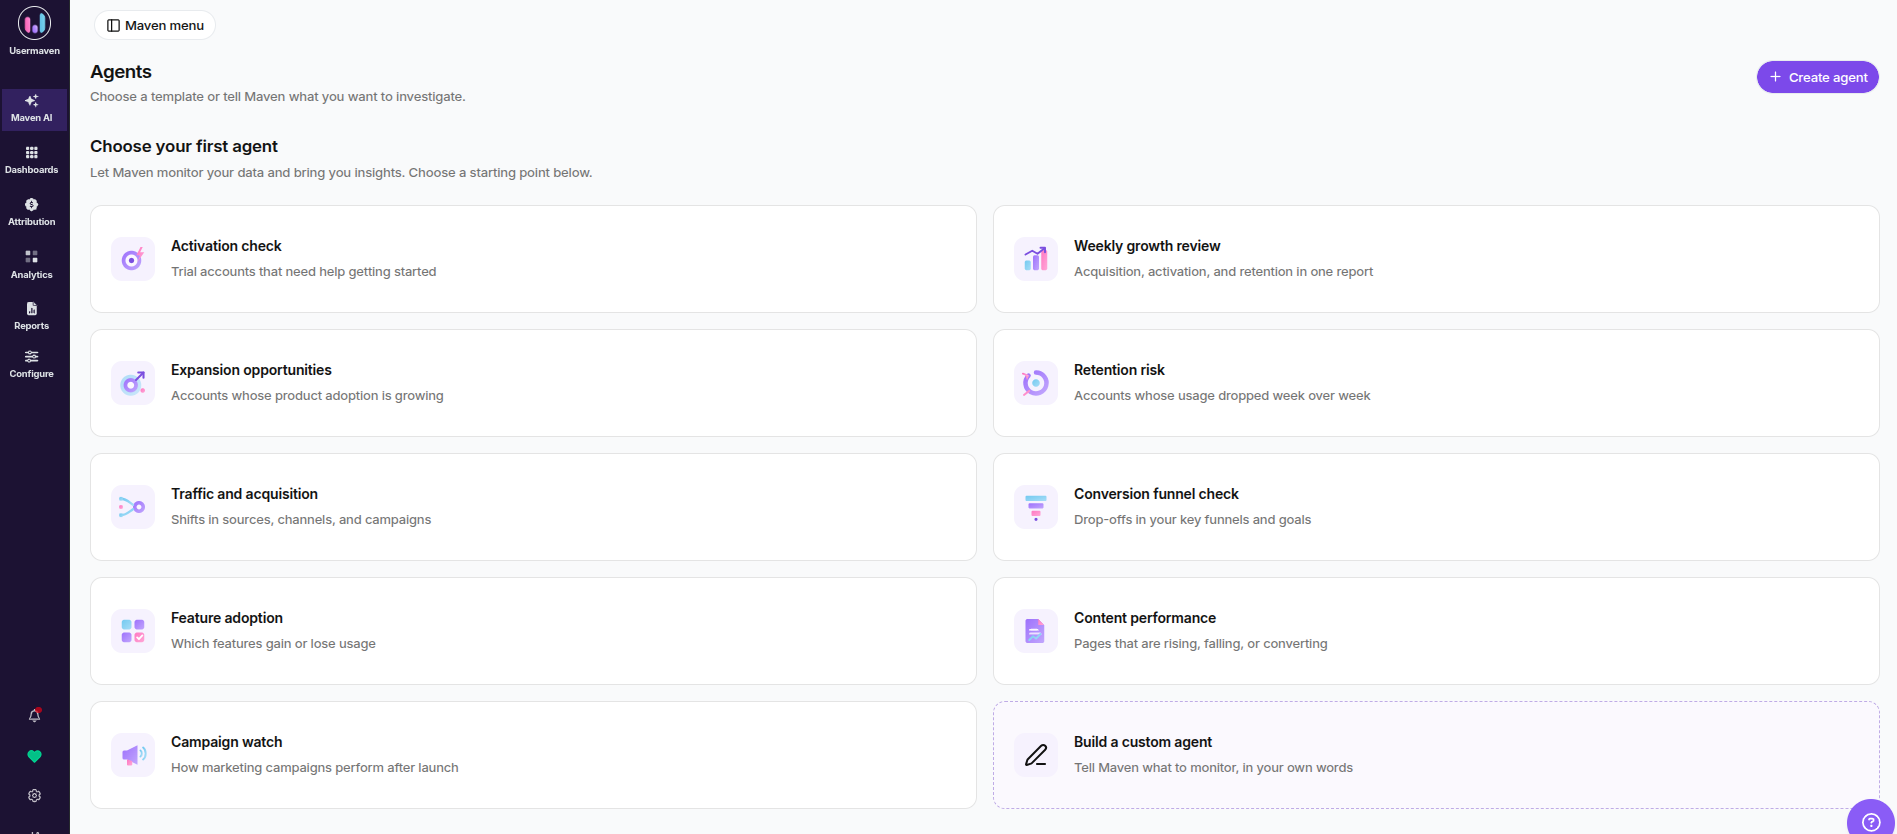
For campaign monitoring, an agent might watch acquisition sources and detect a sudden shift after a launch. It could check related conversion goals and investigate whether the difference is concentrated in a channel, campaign, or landing page.
For a SaaS team, another agent could monitor conversion funnel drop-offs, account engagement, or feature adoption to identify behavior changes that deserve human review.
The documented templates cover traffic and acquisition, funnel checks, campaign performance, retention risk, feature adoption, and content performance. Findings appear in the Insights area and individual run reports, with options for scheduled delivery and sharing. The agent can choose which read-only analytics checks to pursue within the assigned objective; it is not merely replaying one fixed report.
That distinction matters. Scheduled Reports deliver predefined reporting outputs on a cadence, while Maven AI Agents investigate a recurring question using analytics tools and report the evidence they find. Neither should be described as automatically rewriting campaigns or changing advertising budgets.
Validate results before making a budget decision
Usermaven’s Measurement Trust Center provides checks across collection, identity, integrations, delivery, and reliability. It helps users identify gaps that could affect analysis before treating an AI-generated summary as dependable.
An attribution result should also state the selected model, conversion goal, and period. The October 2026 product update added the ability to inspect attribution-model context in Maven AI and save generated charts and reports to dashboards. This makes it easier to review findings with marketing and revenue stakeholders.
For a team connecting acquisition channels with conversions and revenue, book a Usermaven demo to review the events, integrations, and attribution questions relevant to your business.
How to evaluate AI analytics results and avoid common errors
AI can be fluent and still be wrong. Before using a generated report to change spending, ask these questions:
- Is the source complete?: Are the necessary campaigns, events, accounts, and CRM stages connected and up to date?
- Are metrics defined consistently?: Does “conversion” mean a signup, demo booking, qualified opportunity, or paid customer?
- Are comparisons fair?: Were equivalent periods, populations, currencies, and attribution windows used?
- Can the finding be reproduced?: Can a reviewer inspect the chart, source values, filters, and model assumptions?
- Are there enough observations?: Is an apparent percentage movement driven by a few conversions?
- Is the claim descriptive or causal?: Does it show an association, an attribution-model result, a forecast, or evidence from an experiment?
- Is the action permitted?: Does the tool have read-only access, approved write actions, or a separate review requirement?
A report about declining ROAS may reflect tracking changes, attribution windows, refunds, or delayed CRM conversions, not necessarily worse advertising. AI can prioritize which explanations to investigate, but the analyst is responsible for confirming them.
Privacy matters too. Only connect systems and customer fields that are appropriate for the use case. Review permissions, retention, and vendor data-processing terms before exposing customer-level records to an analytics or AI tool.
How to choose the right AI marketing analytics solution
There is no single best product for every team. Match the software to your data foundation and the decision you need to make.
| Team or need | Prioritize | Likely fit to assess |
|---|---|---|
| B2B SaaS growth | Acquisition-to-product and revenue analysis | Usermaven |
| Multi-client marketing agency | Cross-channel reporting and recurring client workflows | Whatagraph, Supermetrics |
| Enterprise marketing operations | Standardization, governance, complex source integration | Improvado, Google Cloud |
| Ecommerce or DTC | Store, product, customer and ad performance | Triple Whale |
| Internal data science team | Custom models with warehouse ownership | Google Cloud |
During evaluation, request a demonstration using your own business question, not only a polished sample dashboard. Ask the vendor to show the data source, filters, attribution method, output reproducibility, and what happens when a required integration is missing.
Also establish the total cost of access, connected platforms, implementation, data retention, users, AI usage, and support. A tool with a convincing chat interface is not automatically the right reporting foundation.
Final thoughts
AI marketing analytics is most valuable when it shortens the distance between a trustworthy marketing question and an evidence-based decision. The strongest workflow connects accurate tracking, consistent customer outcomes, AI-assisted investigation, and human validation.
Start with one recurring question, such as which acquisition channels produce activated or qualified customers. Validate the answer, save the useful reporting view, and expand only when the team can trust the underlying data. AI can make the work faster, but measurement quality determines whether the result is worth acting on.
FAQs
How is AI used in marketing analytics?
AI can help retrieve connected marketing data, compare periods, detect changes, answer natural-language questions, build charts, and prepare recurring reports. Some tools also provide forecasting or autonomous investigations. The available functions depend on the product and data configured.
What is the difference between AI marketing analytics and marketing automation?
Analytics focuses on understanding performance and supporting decisions. Marketing automation executes activities such as sending emails, updating audiences, or triggering workflows. A product may offer both, but an AI-generated recommendation is not the same as a completed campaign action.
What are the most useful AI marketing analytics metrics?
Start with metrics linked to the objective: campaign spend, qualified conversions, conversion rates, customer acquisition cost, attributed revenue, activation, retention, and pipeline. Define the calculation and its eligible population before comparing results.
Can AI marketing analytics predict ROI?
Some systems can build forecasts when suitable historical data, clear targets, and validated models are available. A forecast is an estimate, not a guaranteed future result. AI summaries of past ROAS should not be described as predictive modeling.
Can AI marketing analytics replace Google Analytics 4?
Not necessarily. GA4 collects and reports important website or app interactions, while AI analytics tools may sit above GA4 or collect their own measurement data. The right setup depends on required channels, conversion goals, identity matching, attribution, and product behavior.
How can marketers verify an AI-generated insight?
Inspect the source data, filters, time window, metric definitions, and relevant comparison. Reproduce important figures in the underlying dashboard or analytics query, then check alternative explanations before acting.

Written by
Adeel Khan
Growth Marketing Expert
Adeel Khan is a full-stack SaaS marketer with 10+ years of experience in content marketing, paid advertising, analytics, and conversion rate optimization. He shares practical insights and strategies drawn from hands-on experience, helping B2B SaaS marketers improve performance and make better marketing decisions.
All articles by Adeel →