Usermaven highlights 2025: A year in review
Dec 30, 2025
4 mins read
Written by Esha Shabbir
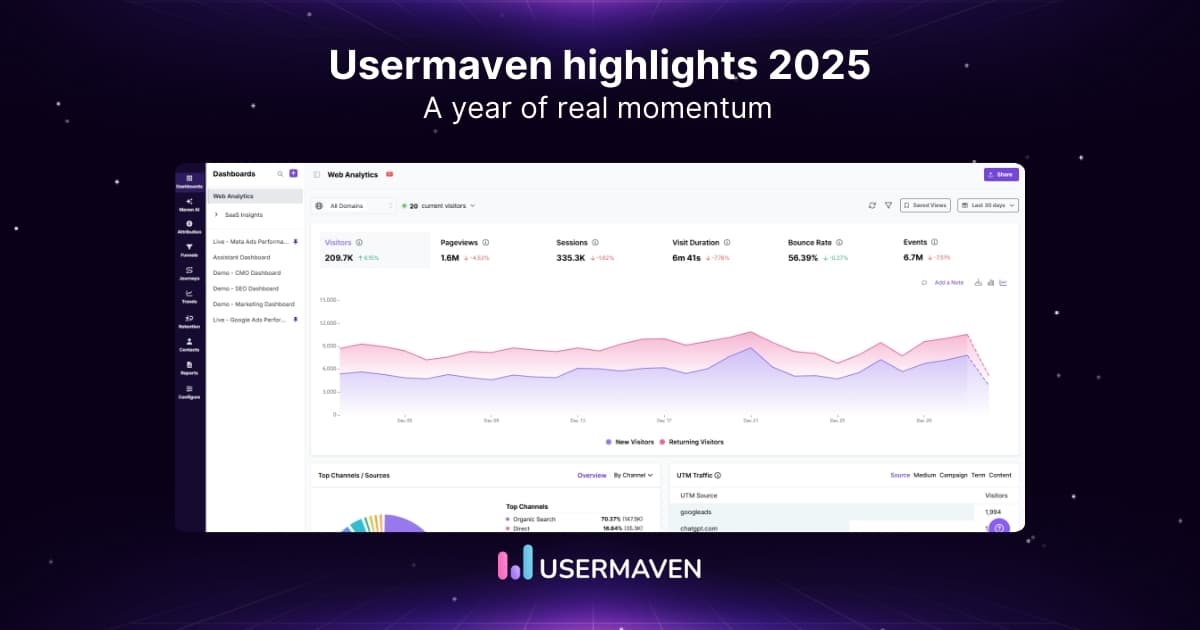
At Usermaven, we spent 2025 doing one thing exceptionally well: listening closely to our users and fixing what actually mattered.
Every quarter came with something new. We shipped features, fixed gaps, and made changes that genuinely improved how our customers use Usermaven.
And the best part? We did it together. You told us what you needed, and we delivered.
This isn’t just a recap. It’s a journey. One that’s setting the stage for even bigger things.
Ready to see how far we’ve come? Let’s dive in.
Q1: Upgraded dashboards + better integrations and ad insights
We kicked off 2025 with purposeful changes to make your experience more efficient and better tailored to your needs.
From powerful new dashboard capabilities to seamless integrations, Q1 was all about giving you more control, more insights, and a smoother workflow.
Dashboards
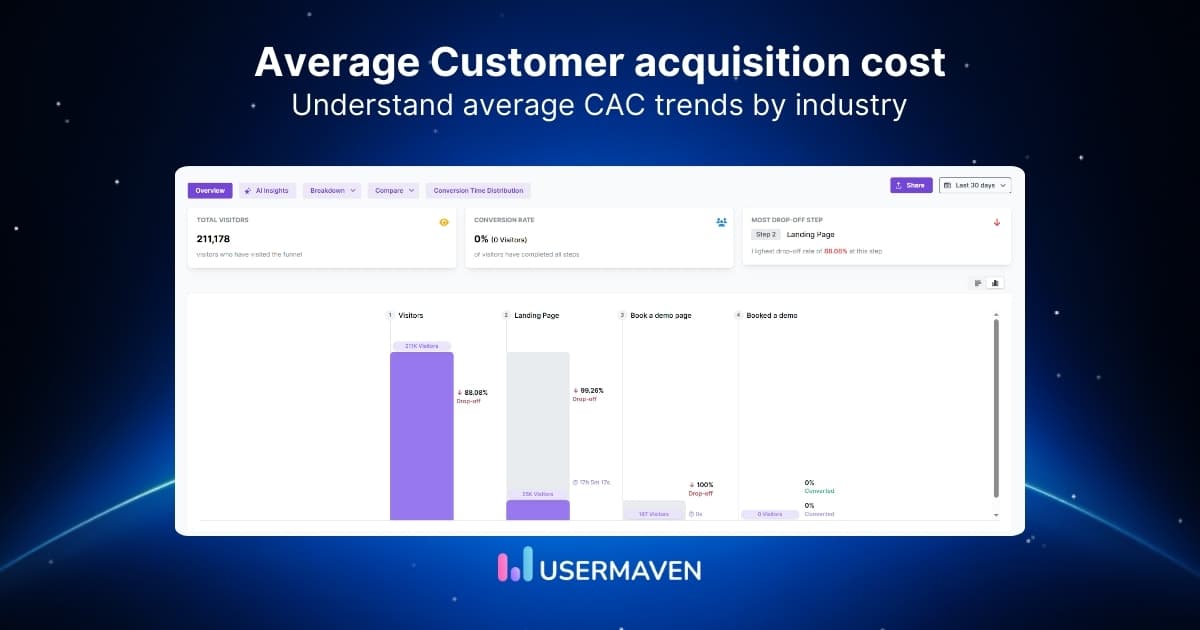
Q1 marked a major milestone with the launch of our new dashboards feature. You can create custom views of all your key metrics in one place. No more hopping between screens or tools to track what matters most.
Whether it’s funnels, attribution, or journeys, everything you need is now integrated into one streamlined dashboard. And the best part? You can now easily track, analyze, and share your data with your team, all without missing a beat.
Slack and Google Ads integrations
We also made it easier to integrate your analytics with the tools you use every day. With our Slack integration, your team can access data directly within your workflow, keeping collaboration and decision-making frictionless.
On top of that, the Google Ads integration brings deeper visibility into your campaigns, allowing you to optimize your ad spend more efficiently.
Facebook paid ads attribution
We launched Facebook paid ads attribution, giving you precise control over your Facebook ad performance. You can easily measure ROI and optimize your campaigns by understanding exactly how each dollar spent contributes to your business goals.
Pre-built dashboards for WooCommerce & Google Search Performance
And to make things even more accessible, we introduced pre-built dashboards for WooCommerce and Google Search Performance. These ready-to-use dashboards give you instant insights, so you can get started with powerful analytics right away (no setup required!).
Q2: Ad platform integrations with cleaner visuals
Q2 was all about making your data more accessible and more useful the moment you see it. We rolled out new integrations and visual upgrades designed to help you find the signal faster, spot changes sooner, and act with more confidence.
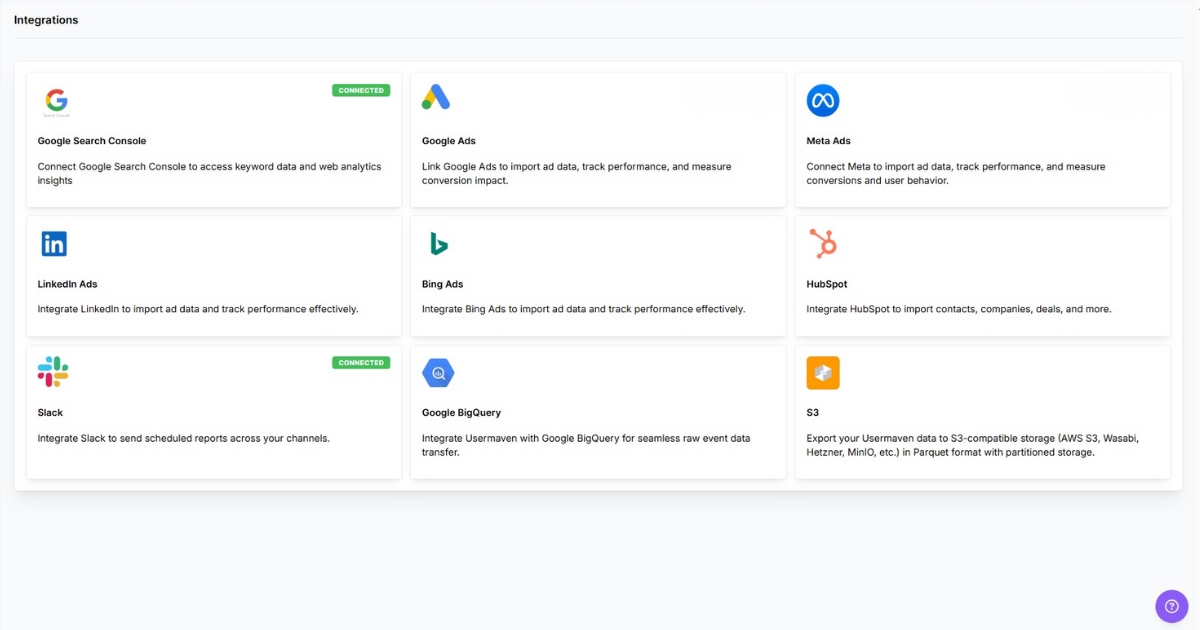
LinkedIn & Bing integrations
In Q2, we expanded our ad integrations. LinkedIn Ads and Bing Ads are now fully integrated into Usermaven, giving you more control over your campaigns. Alongside these integrations, we also added the ability to analyze Google Ads parameters, so you can dive deeper into campaign performance and make smarter decisions with even more granular data.
Pulse/Gauge views
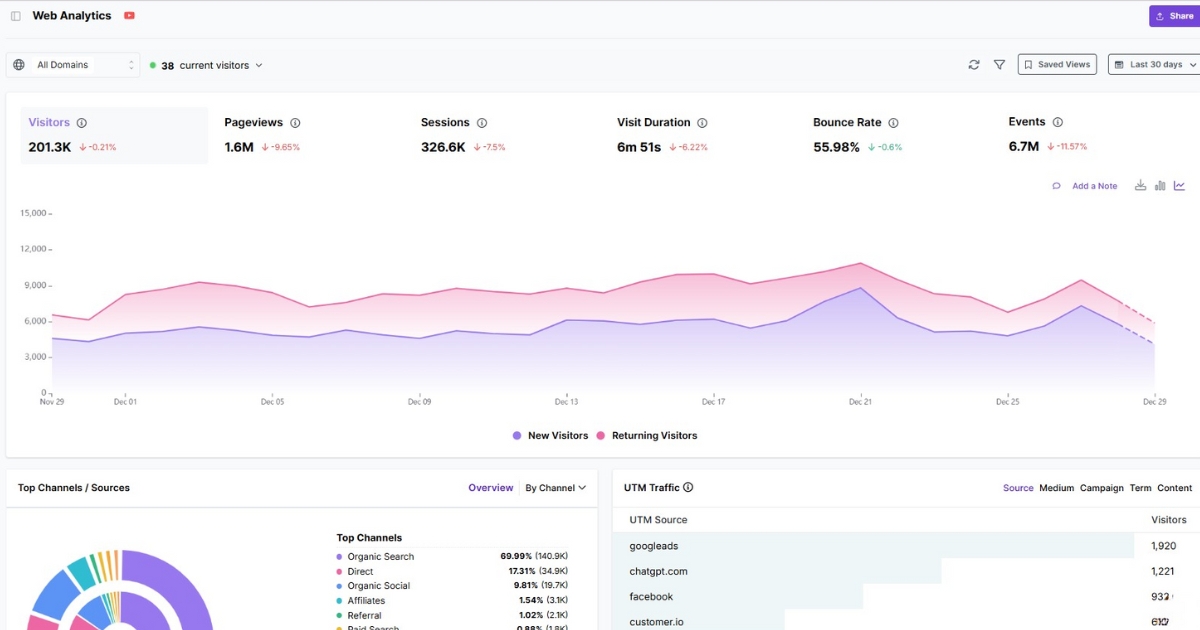
This quarter, we refreshed the SaaS Insights section with a cleaner, more intuitive layout, so what you need is quicker to locate and simpler to navigate.
We also improved how your data reads at a glance. Pulse and Gauge views help you see progress instantly. Whether you’re tracking key metrics or watching trends unfold in real time, these views help you move from insight to action faster.
More accessible dashboards
Dashboards now adapt more smoothly across devices so that you can check them on the go without layout issues. And sharing them with your team? A breeze. We’ve made it simple to share your dashboards, ensuring everyone is on the same page, no matter where they’re working from.
Q3: White label, HubSpot, first-party conversions, and more
In Q3, Usermaven pushed boundaries and added the tools you need to work smarter. We introduced new ways to visualize your data and ensure your platform is secure and scalable.
Enhanced data visualization
We introduced the Sankey view in user journeys to give you a more intuitive way to visualize user flows. You can now clearly track how users move through your app, making it simpler to see what’s working and where things break down.
Additionally, we completely redesigned the Trend Builder UI, making it faster to build charts and uncover insights. Now, you can dive deeper with fewer clicks, all while seeing more context along the way.
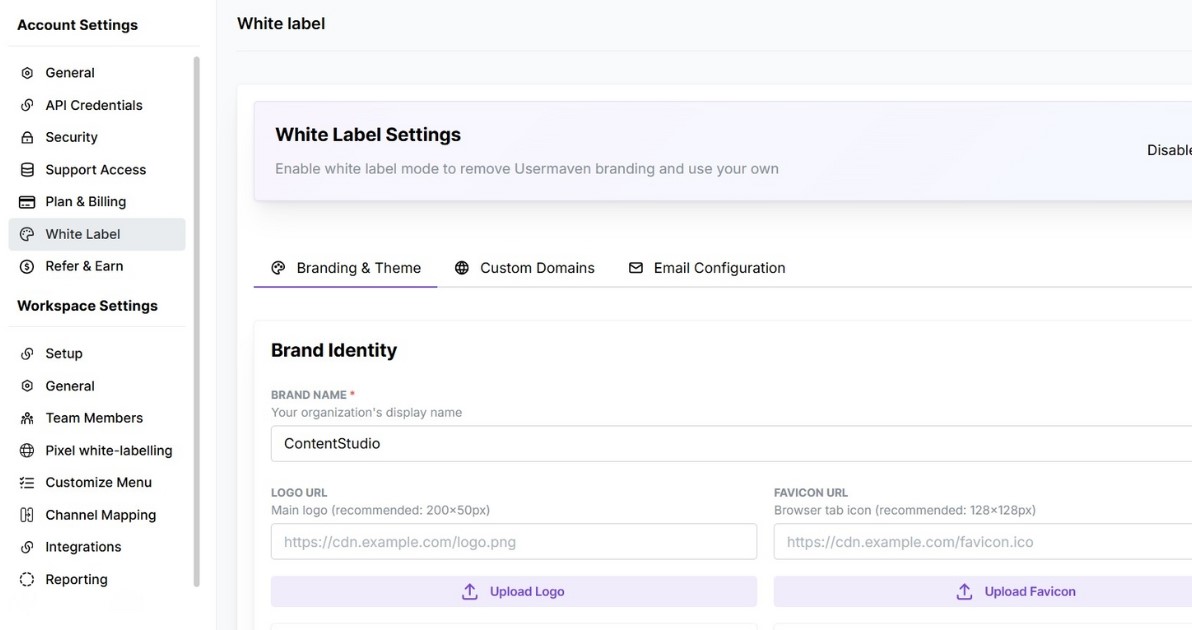
White label analytics
Customization got a major boost this quarter with white label analytics. Now, you can fully customize your Usermaven experience to match your brand’s look and feel, ensuring a seamless, branded experience for your team and customers alike.
HubSpot integration
We focused on bringing your CRM and product analytics closer together by rolling out the HubSpot integration. You can now bring HubSpot data and Usermaven product insights together in one place, giving you a more holistic view of your customer journey and interactions. This helps you align sales and marketing efforts with what’s actually happening in the product.
Advanced conversion tracking and AI-powered insights
We introduced the ability to send first-party conversions to Google Ads, helping you track and optimize your campaigns with more precise, actionable data.
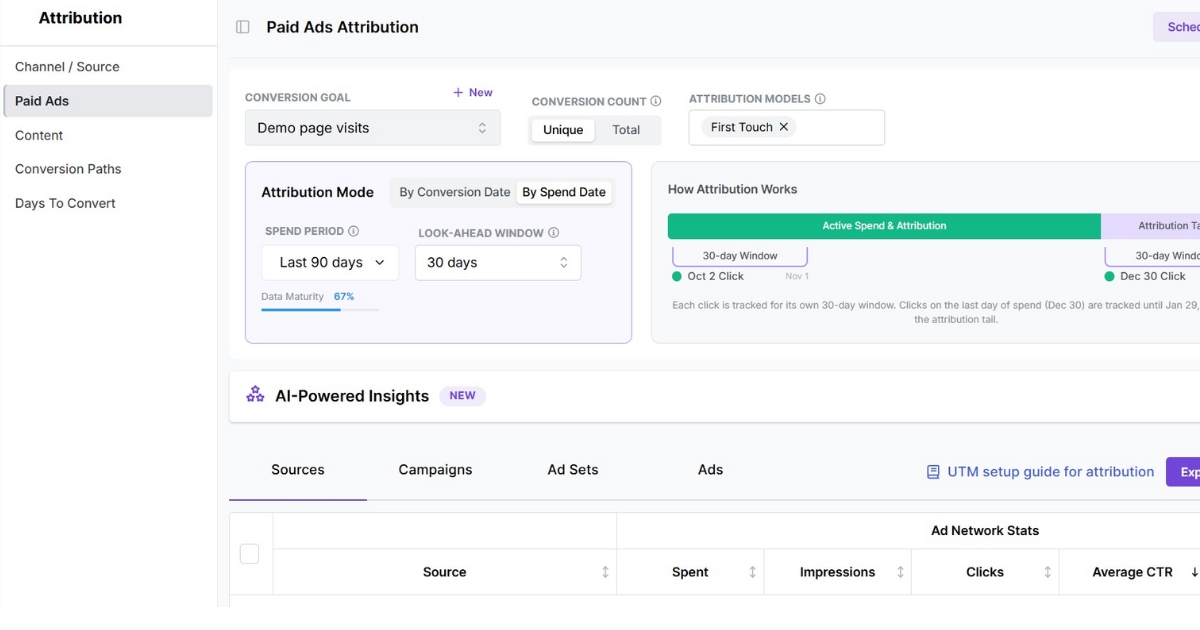
On top of that, we added AI-powered insights in paid ads attribution, so you can automatically uncover hidden patterns and trends in your ad performance. These AI-driven recommendations take the guesswork out of optimizing your ad spend, empowering you to make smarter decisions faster.
Security & scalability
Security took a big leap forward with the introduction of Two-Factor Authentication (2FA), helping keep your account secure. On the scalability side, we launched Usermaven’s new REST API, giving teams more control when managing contacts and workspaces at scale. Whether you’re working with more data or a growing team, these tools are built to keep up.
Q4: Smarter attribution modes, new reporting options, and S3 export
Q4 was our chance to polish the tools you love and add a few surprises along the way. With these updates, you’re all set to tackle the year ahead with even more confidence and control.
Advanced attribution insights
We spent a lot of time improving how attribution works in practice. For starters, you can now add paid ads attribution insights directly to your dashboards, giving you a single place to see all your channel performance data. No more switching tabs.
We also extended the attribution lookback window to 365 days, giving you a full year of context instead of a narrow slice. And with the new spend-period attribution mode, plus a look-ahead option, you get a much clearer picture of how your spend performed, even after the campaign ends.
Enhanced reporting
In Q4, reporting got a lot more flexible. We introduced new customer journey, attribution, and trend reports so you can choose the view that best fits the question you’re trying to answer. That means quicker answers when you’re trying to understand how users move, what ad spend actually influenced, and which patterns are worth acting on.
Improved retention for better access and insights
We rolled out an upgraded Retention experience that’s now easier to access and more insightful. Available directly in the main menu, this update gives you better visibility into user retention and allows you to engage more effectively with your most valuable customers.
No more digging through multiple sections to see the data that matters most.
S3 export for easy data access
To round out the year, we launched S3 export integration. You can now send your Usermaven data directly to your own S3 bucket, making long-term storage, custom analysis, and downstream workflows much more manageable.
And that’s a wrap on 2025!
2025 was a year of real progress at Usermaven. Not just in what we shipped, but in how we built, guided by your feedback, your questions, and the challenges you brought to us. Every improvement and every new feature was shaped by how you actually use Usermaven in your workflow.
We’re proud of how far we’ve come. But we’re even more excited about what’s ahead. 2026 is already taking shape, and it’s focused on going deeper, building smarter, and making Usermaven even more valuable for you.
So, thank you for being part of this journey. We can’t wait to see where we go next, together!
See Usermaven in action
Book a free demo and discover how powerful analytics can grow your business.
*No credit card required
Try for free
Grow your business faster with:
- AI-powered analytics & attribution
- No-code event tracking
- Privacy-friendly setup