Mixpanel is a popular choice for product analytics, and it’s easy to see why teams consider it early.
Mixpanel has a free tier, a Growth plan with usage-based billing, and a custom Enterprise option. The cost depends on how many events your product generates and the features your team needs.
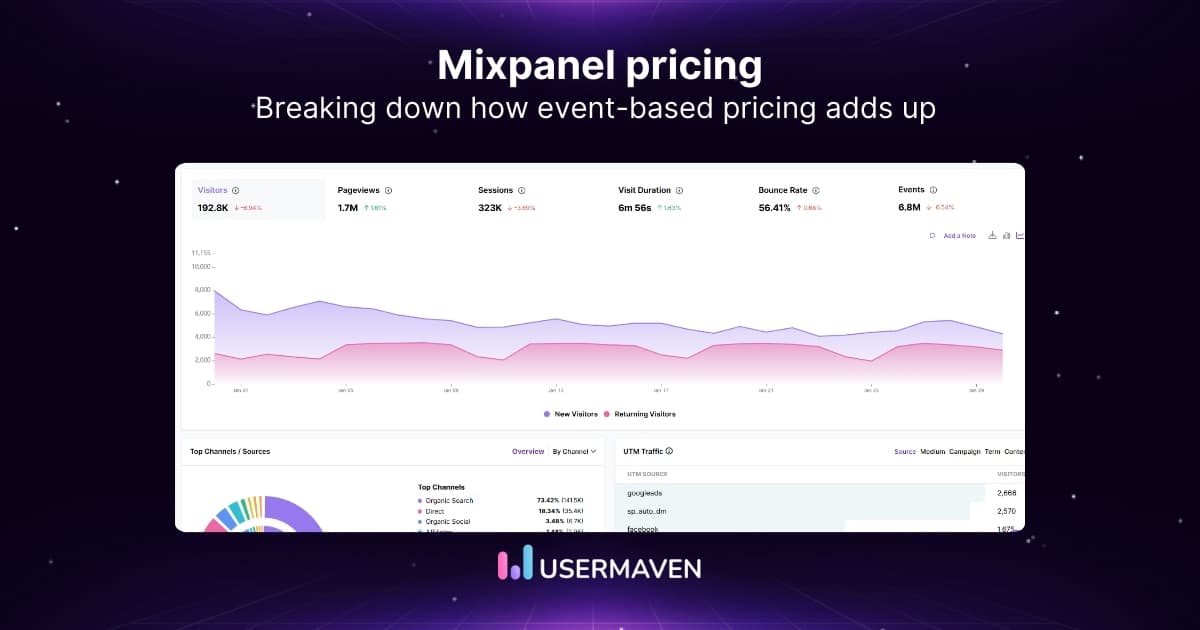
For the real cost, look beyond the plan name. Event allowances, saved reports, session replay, experiments, and optional services can change what a team pays.
In this guide, we’ll break down how Mixpanel pricing works, what typically influences the total cost, and when a Mixpanel alternative may be a better fit.
What is Mixpanel?
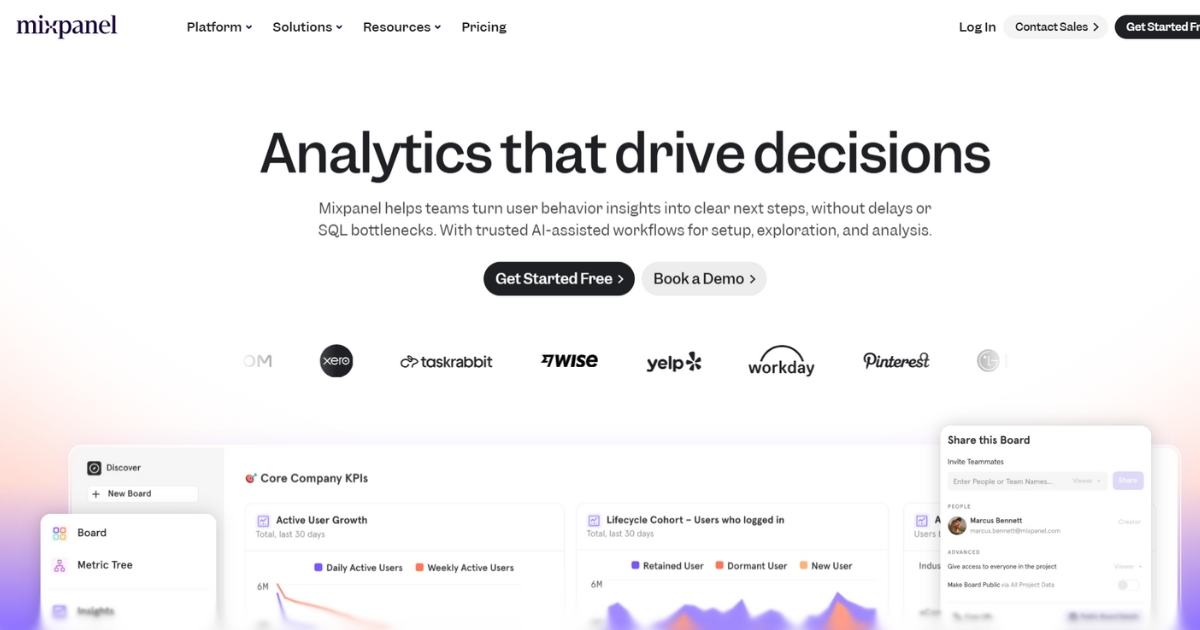
Mixpanel is a product analytics platform that helps teams understand how people use their website or app.
It tracks user actions, turns them into reports, and makes it easier to spot what drives activation, conversion, and retention.
Key features
- Event tracking: Track key user actions over time
- Segmentation: Compare behavior across user groups
- Funnels: See where users drop off in key flows
- User journeys: Visualize paths users take through the product
- Session replays: Watch real sessions to understand friction
Mixpanel is one route, but it’s not the only one. If you’re mainly trying to move beyond pageviews and get clearer conversion reporting, GA4 alternatives are often part of the same shortlist.
How does Mixpanel pricing work?
Mixpanel currently lists Free, Growth, and Enterprise. Free supports up to 1 million events per month. Growth starts at $0, then scales with event volume; Enterprise uses a tailored agreement.
The figures below reflect Mixpanel’s official pricing page. Limits and add-ons can change, so verify the calculator before selecting a plan.
| Plan | Price shown | Event allowance | Notable features |
|---|---|---|---|
| Free | $0/month | Up to 1M events/month | Unlimited seats, funnels, retention, 10K monthly replays, basic experiments and feature flags |
| Growth | Starts at $0; paid usage beyond free allowance | First 1M events free; up to 20M/month | Unlimited saved reports, behavioral cohorts, larger experiment/flag allowances |
| Enterprise | Custom pricing | Up to 1T events/month on the published plan table | Advanced governance, data quality, security, dedicated support |
Free plan
Mixpanel Free is genuinely free, with no credit card required. It includes 1 million events per month, unlimited seats, and a starting set of product analytics tools.
- Analysis: Funnels, retention, flows, and insight reports
- Session replay: Up to 10,000 replays per month
- Experimentation: Up to 1,000 monthly experiment users and 10 active feature flags
- Reporting: Five saved reports per seat
- AI: Mixpanel Agent and MCP are listed in Mixpanel’s analysis capabilities
Free can be useful for early product teams and pilots. The main constraints are the event allowance, saved-report limits, and advanced features that require a higher plan.
Growth plan
Growth starts at $0 because its first million monthly events are free. Beyond that, the cost changes with selected event volume, up to the published 20-million-event monthly tier.
- Unlimited saved reports, metrics, and behavioral cohorts
- Custom and borrowed properties for deeper analysis
- Up to 50 active feature flags; 5,000 monthly experiment users included
- Monitoring and alerts, including a five-alert limit per project
- Expanded data and analysis capabilities; add-ons may carry separate charges
Growth is the main usage-based plan for teams extending their tracking. Budget against realistic monthly event volumes, not just the $0 entry point.
Mixpanel pricing calculator
The Growth pricing calculator lets buyers select monthly event volume and compare monthly with annual billing.
For example, the current 1.5-million-event slider view displays $140/month on monthly billing or $120/month as an annual-billing equivalent. This is an example, not a fixed Growth price.
Enterprise plan
Enterprise is for organizations needing higher contracted event volumes, stronger governance, and dedicated support. Mixpanel does not publish a fixed Enterprise monthly price.
- Up to 1 trillion monthly events listed on the plan comparison
- Advanced governance, verified data, monitoring, and access controls
- Custom experiment, replay, and feature-flag allowances
- Data retention and security options for complex organizations
- Dedicated success team, priority support, and custom contract terms
A sales conversation is needed to confirm the subscription, implementation, add-ons, and service terms. Enterprise should be evaluated against the requirements the team actually needs.
Pros and cons of using Mixpanel
Mixpanel can be a strong fit if you know exactly what you want to measure and you have the appetite to maintain an event-heavy setup. Here’s the quick trade-off view.
Pros
- Event analytics: Great for digging into user behavior with funnels, retention, and breakdowns.
- Real-time reporting: Useful when you need to spot changes quickly after a launch or experiment.
- Flexible reporting and dashboards: Plenty of ways to slice data and build views for different questions.
Cons
- Steep learning curve: It takes time to set up well and interpret reports correctly, especially for non-analytics teams.
- Costs can rise fast: Pricing is tied to event volume, so spend can increase as tracking becomes more detailed.
- Setup often needs engineering time: Instrumentation, governance, and data hygiene usually require technical support.
- Enterprise pricing is sales-led: Harder to estimate total cost upfront once you move beyond self-serve plans.
- Different feature allowances: Session replay, experiments, alerts, and governance capabilities vary by plan or add-on.
If your priority is connecting campaigns and CRM revenue with product behavior, compare Mixpanel alternatives by measurement scope as well as cost.
What do users say about Mixpanel?
When you’re evaluating a tool like Mixpanel, the most useful signal is what teams say after the setup is done and dashboards are part of the weekly routine.
That’s where the real trade-offs show up, and where Mixpanel reviews are especially useful.
Overall, users give Mixpanel credit for depth and flexibility. Many reviews mention that it can turn raw event data into meaningful product insights once you’re up and running.
But the same feedback also points to two recurring friction points: it can take time to feel confident using the deeper features, and pricing tends to rise as you track more.
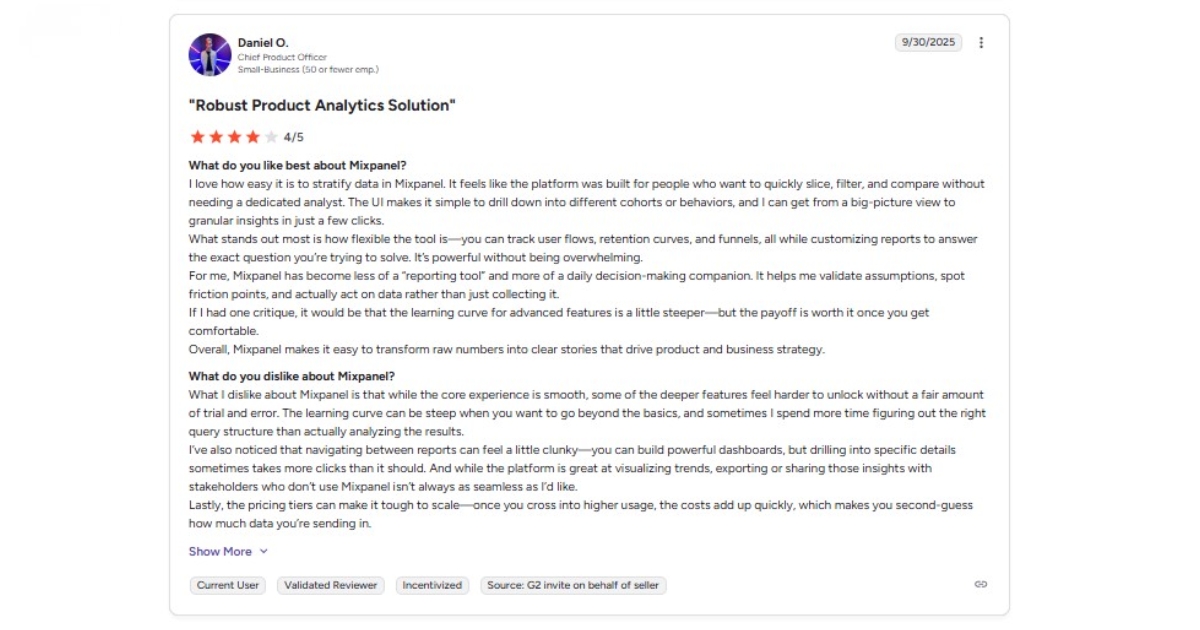
In one review, the user notes that once they move past the basics, getting the exact view they want takes trial and error.
In the same review, they mention that costs add up at higher usage, which can make teams more cautious about what they track.
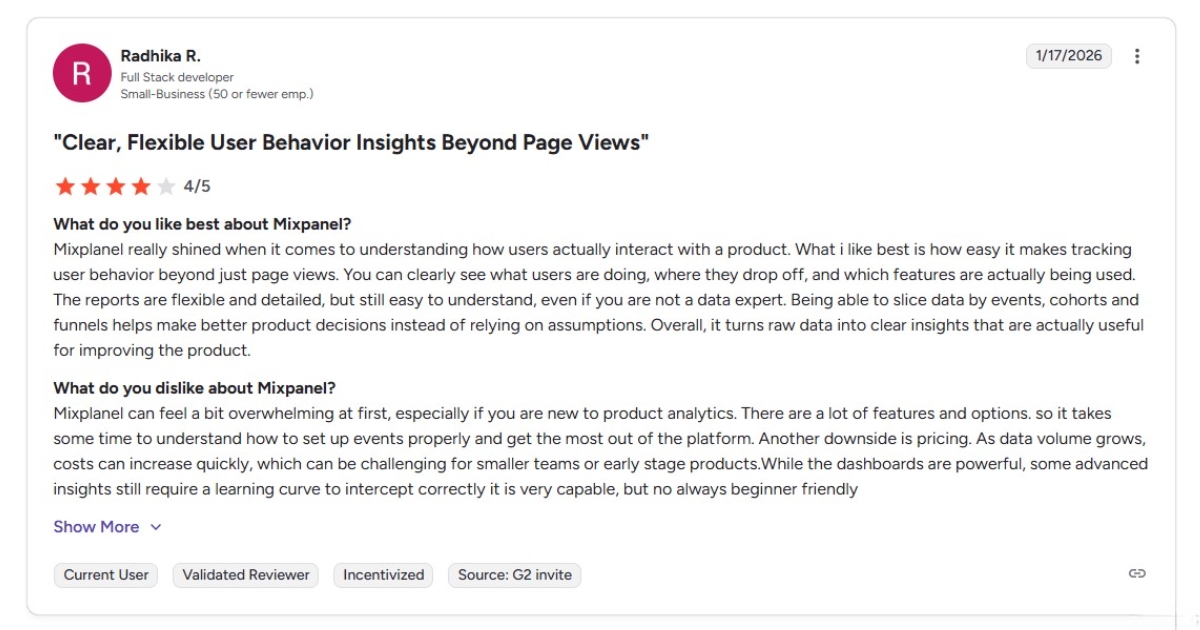
Another review shares a similar experience. Mixpanel can feel overwhelming early on, and as data volume grows, the price becomes harder to justify.
The takeaway is simple. Mixpanel can be powerful, but teams should plan for a ramp-up period and a cost curve that becomes more noticeable as tracking expands.
If you’re mainly evaluating product analytics tools beyond Mixpanel, you can check out our June analytics alternatives guide for a few other options teams consider.
Where Usermaven differs from Mixpanel
Usermaven brings marketing attribution, website analytics, product behavior, and CRM revenue into one measurement workflow.
Mixpanel is especially strong at product events, funnels, retention, experiments, and session replay. Usermaven is a better fit when teams also need to connect channels and campaigns to pipeline and revenue.
What makes Usermaven stand out
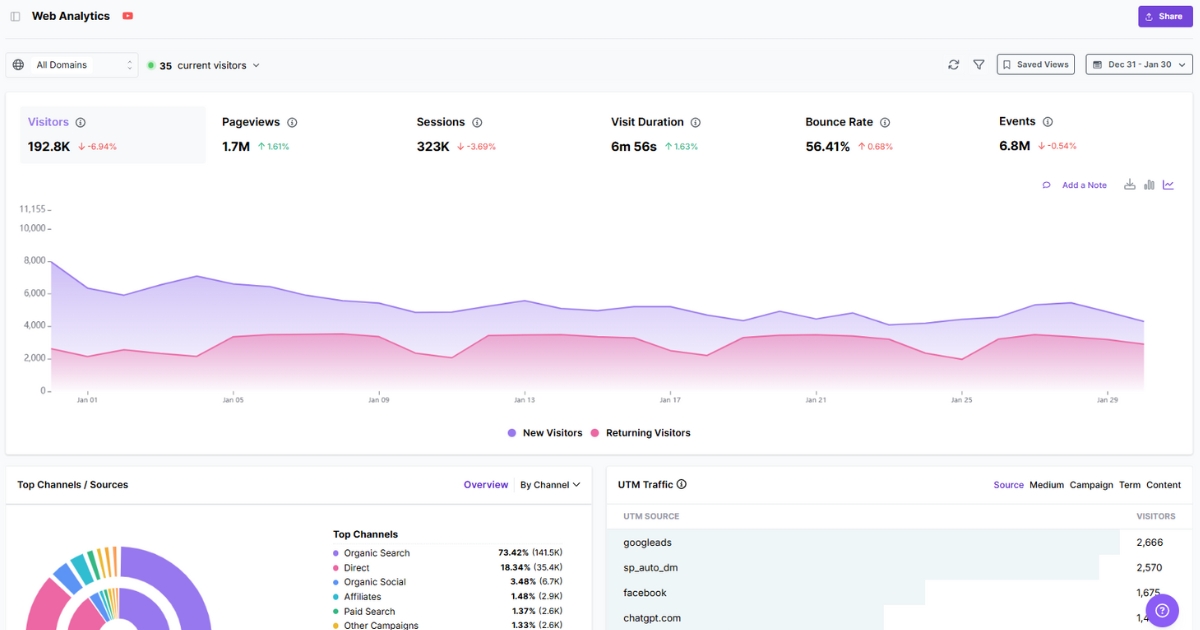
Automatic event tracking helps teams monitor key activity without manually tagging every action. Funnels, journeys, cohorts, and segments show what happens between acquisition and retention.
- Website analytics: Understand traffic sources, page engagement, and conversion goals.
- Product analytics: Measure adoption, feature usage, activation, and retention.
- Funnels and user journeys: See drop-offs and the steps that precede a conversion.
- Dashboards and segments: Compare performance for different teams and audiences.
- Marketing attribution: Connect paid, organic, and other touchpoints with leads and revenue.
- Maven AI, Agents, and MCP: Ask questions, schedule investigations, and use authorized data with AI tools.
Business and Enterprise plans
Usermaven now offers Business and Enterprise. Business includes marketing attribution, funnels, customer journeys, retention, dashboards, CRM integrations, Maven AI, and MCP.
Enterprise adds custom integrations, data warehouse export, security controls, flexible hosting, and dedicated support. Neither plan displays a fixed numerical price on the pricing page.
The best way to assess fit is to walk through the attribution and analytics workflows the team needs during a demo.
Maven AI Agents and MCP
Maven AI can answer questions about reporting. Maven AI Agents also run scheduled analyses, helping teams spot changes in feature adoption, funnel drop-offs, and retention.
MCP connects approved Usermaven analytics data to compatible external AI tools. Mixpanel also provides Mixpanel Agent and MCP, so the important difference is the reporting context each platform connects.
Customer example: PostNitro
The PostNitro case study shows how product behavior analysis informed a new demo experience. About 70% of users who engaged with that demo signed up.
That is a practical example of using activation data to change a customer journey, rather than reporting product events in isolation.
See Usermaven in action
Book a free demo and discover how powerful analytics can grow your business.
Teams comparing product analytics platforms can also read the Amplitude pricing guide.
Usermaven vs. Mixpanel pricing
Mixpanel has a permanent Free tier, a volume-based Growth plan, and a custom Enterprise option. Usermaven provides Business and Enterprise plans with a demo-led buying process.
That means there is no verified like-for-like starting-price comparison. The right decision depends on product analytics depth, attribution needs, integration work, and the intended AI workflows.
| What to compare | Mixpanel | Usermaven |
|---|---|---|
| Plans | Free, Growth, Enterprise | Business, Enterprise |
| Published starting price | Free: $0; Growth starts at $0 | No fixed numerical prices displayed |
| How pricing works | Event volume for Growth; tailored Enterprise contracts | Evaluate Business or Enterprise through a demo |
| Main focus | Product analytics, experimentation, engagement and retention | Attribution connecting acquisition, behavior, CRM, and revenue |
| Marketing attribution | Campaign reporting and multi-touch attribution are listed | Multi-touch, paid ads, custom models, CRM/deal attribution |
| Product analytics | Advanced funnels, flows, cohorts, session replay | Funnels, journeys, feature adoption, retention, segments |
| Experimentation | Native experiments and feature flags | Not positioned as a native experimentation suite |
| AI and MCP | Mixpanel Agent and MCP server | Maven AI, scheduled Agents, MCP connectors |
| Reporting | Product metrics, saved reports, monitoring | Attribution, revenue, behavioral analytics, reports and alerts |
| Enterprise controls | Security, governance and custom data allowances | Custom integrations, private cloud/on-premise, SSO, audit logs |
| Best fit | Deep product research and testing | Growth teams connecting marketing to revenue and retention |
How event volume affects Mixpanel costs
A single session can create several events: pageviews, clicks, searches, signups, and product actions. Estimate average events per active user and multiply by monthly users to set a realistic baseline.
Mixpanel’s first million monthly events are free on Growth, but tracking beyond that allowance changes the bill. Compare actual usage scenarios in its calculator.
When Usermaven adds more value
Usermaven becomes particularly relevant when product usage needs to be connected to the ads, content, and campaigns that acquired each customer.
CRM revenue attribution and conversion sync help marketing teams assess downstream value. Product analytics, cohorts, and Agents help track what happens after acquisition.
Mixpanel remains a strong choice for native experimentation and detailed behavioral analysis. Neither platform should be called cheaper without comparing real requirements.
To sum it up
Mixpanel offers a useful free starting point and rich product analytics. Paid costs depend on event volume, plan limits, and any additional services a team needs.
Usermaven is worth evaluating when acquisition, CRM outcomes, product behavior, and revenue attribution need one connected view. Its Business and Enterprise plans also provide AI-powered analysis.
To explore those workflows with your own measurement goals, book a Usermaven demo.
FAQs about Mixpanel pricing
1. Is Mixpanel pricing affordable for small businesses?
Mixpanel Free costs $0 and includes up to 1 million events per month. Growth also starts at $0, with paid usage above the included allowance. Total cost depends on events, features, and support needs.
2. How does the Mixpanel pricing model work?
Mixpanel offers Free, Growth, and Enterprise. Free includes 1 million events monthly. Growth uses event-volume pricing beyond its first 1 million free events, while Enterprise pricing is arranged directly with Mixpanel.
3. What is the Mixpanel pricing calculator, and how do I use it?
Use Mixpanel’s Growth calculator to choose your expected monthly event count and compare monthly and annual billing. Estimate events per user multiplied by monthly active users, then select the closest event tier.
4. How much do businesses spend on Mixpanel?
Spending varies with tracked monthly events, the chosen plan, and add-ons. The Growth calculator currently shows $140 per month at 1.5 million events on monthly billing, but that is one usage example rather than a universal price.
5. Is Usermaven a good Mixpanel alternative?
Usermaven is a strong option when teams need marketing attribution, CRM revenue visibility, product analytics, funnels, customer journeys, Maven AI, Agents, and MCP together. It offers Business and Enterprise plans, with demos available to discuss requirements.
Updated

Written by
Ryan Mitchell
Marketing Analytics Strategist
Ryan Mitchell is a marketing analytics strategist specializing in campaign measurement, customer journeys, and marketing performance. He writes about analytics, reporting, and data-driven marketing strategies, helping SaaS and B2B teams measure what matters across every stage of the customer journey.
All articles by Ryan →