A client’s Google Ads account reports 120 conversions. Meta claims another 85. The CRM shows only 70 qualified leads. What should the agency tell the client?
Agency analytics turns fragmented campaign and customer data into evidence that supports a decision. It connects channels, user behavior, conversion quality, and revenue instead of presenting a collection of screenshots.
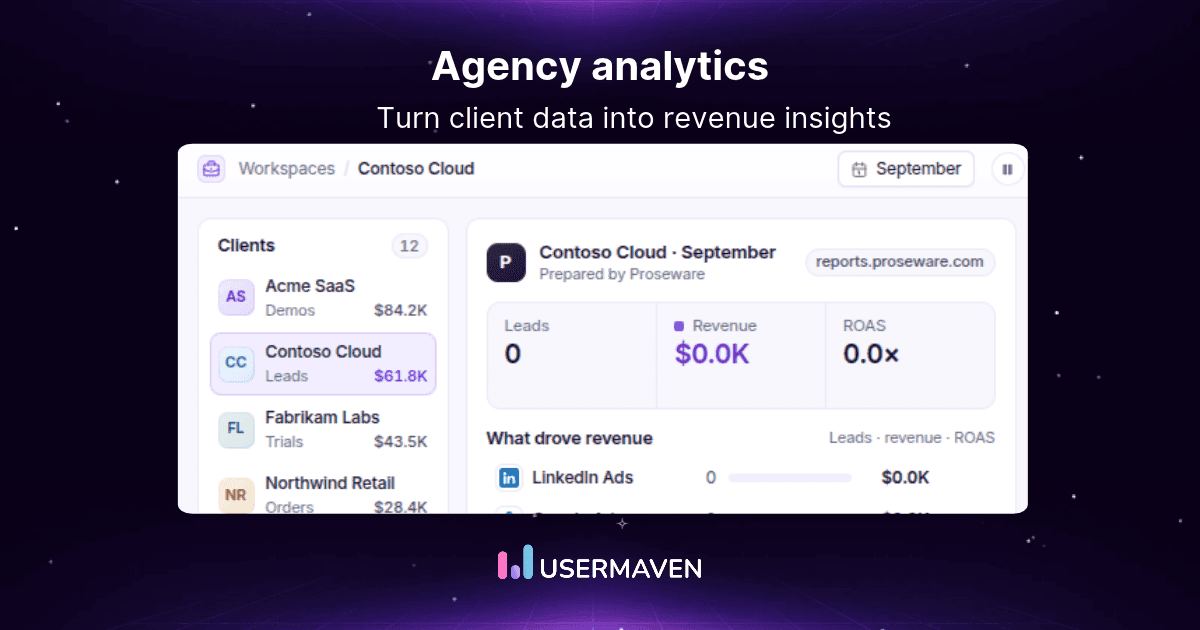
An effective marketing attribution software approach helps agencies connect reported performance with verified business outcomes. This guide explains the measurement framework, client KPIs, reporting process, and the tools that support it.
Key takeaways
- Start with client outcomes: Agree on qualified conversions, pipeline, revenue, and measurement ownership before designing a dashboard.
- Do not add platform conversions: Google Ads and Meta can claim credit for the same result. Reconcile against verified records.
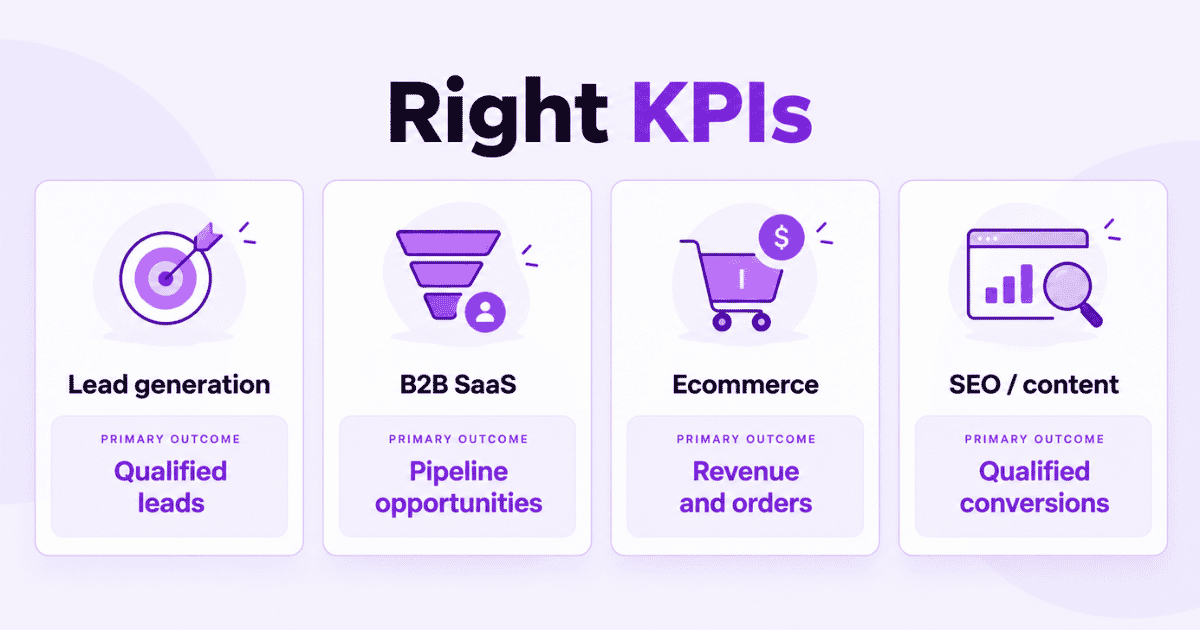
- Fit KPIs to the business: Ecommerce, lead generation, B2B SaaS, and SEO engagements require different evidence.
- Standardize the checks: Use one onboarding and data-quality audit across clients while keeping each client’s goals distinct.
- Report decisions, not screenshots: Show what changed, how confident the team is, and what it will test next.
Agency analytics at a glance
| Layer | Question to answer | Typical evidence |
|---|---|---|
| Acquisition | Where did demand start? | Tagged campaigns, spend, sessions |
| Behavior | What happened after the click? | Landing-page actions, paths, drop-offs |
| Conversion | Which outcome was completed? | Deduplicated forms, purchases, bookings |
| Attribution | Which eligible touchpoints receive credit? | Model, window, channel path |
| Revenue | What business value followed? | CRM stages, orders, closed-won value |
| Reliability | Can the client trust the inputs? | Tag health, match rates, reconciliation |
Unlock insights that drive growth
What is agency analytics?
Agency analytics is the process of collecting, validating, analyzing, and reporting marketing performance across one or more client accounts. It connects campaign activity with the business outcomes defined for each client.
Website analytics explains what visitors do on a site. Agency analytics adds cross-channel measurement, client-specific KPIs, attribution assumptions, data quality, and the responsibility to explain results to a paying client.
Reporting states what happened. Analytics investigates why it happened, what remains uncertain, and which action is justified. A dashboard is the delivery surface, not the measurement strategy.
Agency analytics is also a general business practice. It should not be confused with the software vendor called AgencyAnalytics, which dominates many searches for this exact phrase.
Why agency data rarely agrees
A platform conversion is usually a claim made under that platform’s rules. It may reflect a view-through interaction, a click, a modeled outcome, or a different counting window from the client’s CRM.
Disagreement is not automatically an error. The first task is to establish which population, event, time zone, and attribution rule each number represents.
Four questions to resolve before a client call
- What happened? Distinguish a click, a form submission, a qualified lead, a purchase, and collected revenue.
- Who is counted? Identify unique people, sessions, leads, orders, or opportunities as the denominator.
- When is it counted? Compare click date, conversion date, sale date, lookback window, and account time zone.
- Who receives credit? Document first-touch, last-touch, multi-touch, and platform-specific credit rules.
If paid-channel totals exceed verified conversions, investigate overlap before adjusting spend. A structured data discrepancy review is more useful than declaring one dashboard wrong.
Agencies should also test whether off-site bookings, embedded forms, ad blockers, consent choices, and disconnected CRM records are creating genuine gaps in measurement.
Reconcile one disputed client metric
Start with a concrete claim, such as “Google Ads generated 120 conversions last month.” Write down the exact event behind that number, its reporting date, and the credit window.
Next, export the eligible conversion IDs or available deduplication keys. Match them against form submissions, orders, or CRM records without assuming identical identifiers exist across every system.
Separate three explanations: “same action, different credit”; “same action, different date”; and “missing or invalid action.” Each explanation implies a different fix.
Finally, publish the reconciled business outcome next to the platform result, with a short note explaining remaining gaps. Keep the raw platform totals available for optimization, not as independent customer counts.
Which KPIs should agencies report?
The right KPI is tied to the client’s commercial model and the decision being made. A weekly optimization view and a monthly executive report may need different measures.
| Client type | Primary outcomes | Supporting diagnostics |
|---|---|---|
| Lead generation | Qualified leads, booked appointments, cost per qualified lead | Form rate, source mix, no-show rate |
| B2B SaaS | SQLs, opportunities, attributed pipeline, won customers | Demo-to-SQL rate, stage lag, multi-touch paths |
| Ecommerce | Orders, revenue, acquisition cost, repeat purchases | Checkout completion, AOV, refunded orders |
| SEO / content | Qualified organic conversions, relevant pipeline contribution | Queries, clicks, engagement, assisting pages |
Paid campaigns: Go beyond cheap leads
A low CPL does not mean a campaign is efficient if most leads cannot qualify. Track spend beside verified lead quality, qualified opportunity cost, and business value.
For advertising ROAS, disclose how revenue was assigned and whether refunds or delayed purchases are included. A clear how to calculate ROAS definition prevents teams from comparing incompatible returns.
B2B: Follow leads into the CRM
Measure conversion to MQL, SQL, opportunity, and closed-won only when those stages have agreed definitions. The stage that matters most may be several weeks after the first form submission.
For B2B SaaS clients, long sales cycles make short reporting windows particularly misleading. Separate new pipeline created this month from revenue collected this month.
Ecommerce: Keep revenue definitions consistent
Track purchases and order value alongside cancellations, refunds, repeat customers, and acquisition cost. A campaign can have attractive gross ROAS while contributing little margin.
For ecommerce clients, record whether revenue is gross, net, or attributed, and maintain the same accounting definitions across channels and periods.
SEO and content: Connect visibility to outcomes
Search impressions and organic sessions matter, but they do not establish commercial contribution. Pair them with qualified organic conversions and the content paths that appear in eligible customer journeys.
Avoid crediting every assisting page with the full sale value. Reporting rules must specify whether the view shows participation, assigned attribution credit, or experimentally measured incremental impact.
Website analytics tool for modern marketers & agencies
How agency analytics works end to end
A reliable system follows a traceable chain: campaign → visit → meaningful event → verified conversion → CRM or order outcome → report. Breaks in that chain should be visible, not disguised by a polished dashboard.
| Layer | System of record | Basic validation |
|---|---|---|
| Campaign | Ad platform and campaign tags | Source, medium, campaign name |
| Behavior | Website and event analytics | Session continuity, event firing |
| Goal | Conversion setup | One real action, one eligible goal |
| Customer outcome | CRM or commerce platform | Contact, stage, transaction ID |
| Decision | Client reporting view | Attribution rule, date, exclusions |
Begin with conversion tracking rules that describe exactly when a goal fires. Identify the owner of each event and the source-of-truth record used for reconciliation.
Then examine customer journey analytics to understand the recorded sequence of interactions. A journey may explain credit allocation, but it does not prove the conversion was caused by a specific ad.
Worked example: Conversions vs. revenue
Consider one hypothetical B2B client running Google Ads and LinkedIn Ads during a 30-day campaign period. The table uses simplified, fully matured lead cohorts so downstream outcomes can be compared.
| Metric | Google Ads | LinkedIn Ads |
|---|---|---|
| Ad spend | $6,000 | $4,000 |
| Platform-reported conversions | 120 | 75 |
| Verified unique leads | 90 | 45 |
| Qualified opportunities | 12 | 15 |
| Closed-won customers | 3 | 5 |
| Matched, attributed revenue | $18,000 | $30,000 |
Google Ads reports more conversions and provides more verified leads. Its CPL is $6,000 ÷ 90 = $66.67. LinkedIn’s CPL is $4,000 ÷ 45 = $88.89.
Now compare opportunity efficiency. Google costs $6,000 ÷ 12 = $500 per qualified opportunity. LinkedIn costs $4,000 ÷ 15 = $266.67 per qualified opportunity.
Under the example’s explicitly stated revenue-credit rule, Google has $18,000 ÷ $6,000 = 3.0× attributed ROAS. LinkedIn has $30,000 ÷ $4,000 = 7.5×.
Decision: Investigate expanding LinkedIn activity while checking its lead volume, customer mix, and capacity constraints. Do not cut Google solely because LinkedIn’s attributed ROAS is higher in one sample.
Measurement boundary: These figures are invented. Reported conversions may overlap across platforms, and attributed revenue is not a causal estimate of additional revenue from advertising.
Build dashboards around client decisions
A dashboard should reveal the health of a business outcome, the change since a meaningful baseline, and the diagnostic path to investigate it. Charts without interpretation shift the work to the client.
Separate executive and operating views
| Executive client view | Agency operating view |
|---|---|
| Qualified leads, customers, revenue | Campaign and audience breakdowns |
| Spend, efficiency, trend vs. target | UTM coverage, event QA, source matching |
| Main change and confidence level | Conversion paths and attribution model |
| Decision, owner, next review date | Troubleshooting notes and experiment logs |
An executive report should fit a single decision conversation. Use an appendix for detailed breakdowns and technical caveats rather than presenting every available metric.
Give each report a decision narrative
A useful reporting note follows one sequence: finding → evidence → limitation → recommendation → owner → review date. It records the interpretation as well as the numbers.
Teams evaluating marketing agency reporting tools should test whether the software supports this commentary and quality-control workflow, not merely attractive templates.
Match reporting cadence to decision speed
Use brief weekly operating checks for spend pacing, broken events, and unusual funnel changes. Reserve monthly client meetings for trend interpretation, business outcomes, and changes to the investment plan.
Quarterly reviews can reassess channel mix, attribution assumptions, and the agreed definition of a qualified outcome. Avoid comparing immature current-month sales cohorts with fully matured previous periods.
For low-volume clients, group enough observations to make the comparison meaningful. A week with two purchases can look dramatically different without showing a reliable change in campaign performance.
Standardize across multiple client accounts
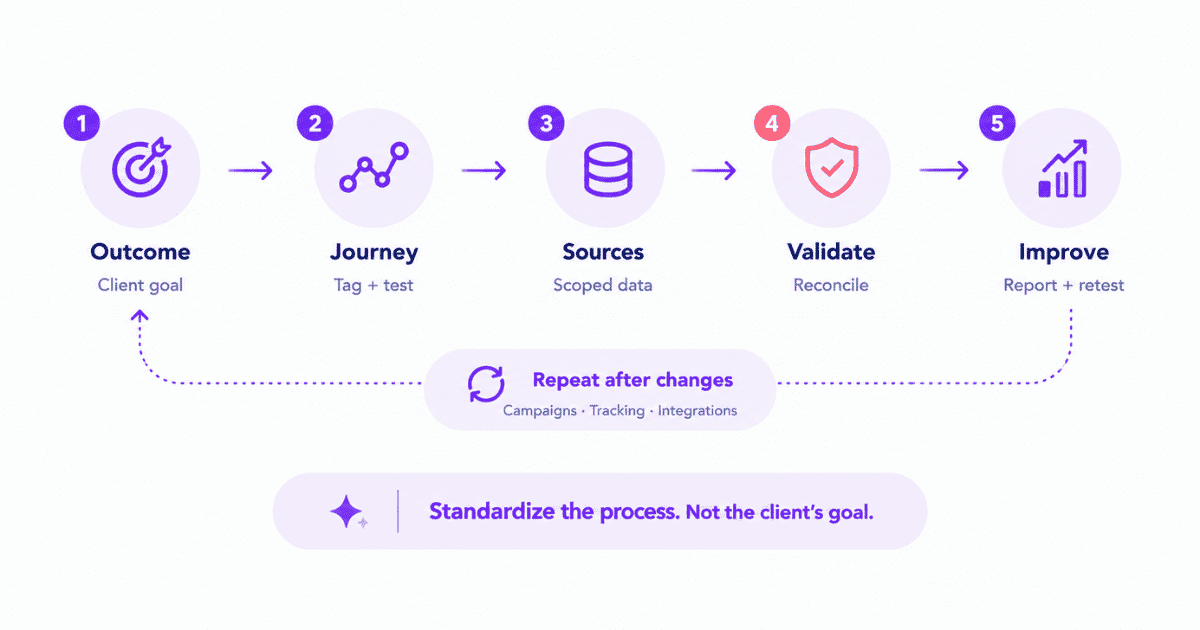
Agencies need a repeatable method that does not force every client into the same conversion definition. Use the five-phase audit below during onboarding and repeat it after major campaign or tracking changes.
1. Define the business outcome
Agree on the client’s primary goal, qualification criteria, source-of-truth system, reporting cadence, and owner. Record which supporting events are useful but not equivalent to completed outcomes.
2. Instrument the customer journey
Apply consistent tagging and define events for meaningful milestones. Test forms, purchases, booking domains, mobile flows, and delayed server-side events before launch.
3. Connect eligible data sources
Connect advertising and analytics data to CRM or commerce outcomes where access and permissions allow. Keep client accounts isolated and document which integrations are read-only or selectively scoped.
4. Validate the measurement chain
Trigger a controlled conversion and compare analytics with the actual submission or transaction. Reconcile by date, time zone, unique ID, attribution window, and consent eligibility.
5. Report and improve
Build client-specific dashboards, present the decision narrative, assign follow-up owners, and repeat checks after implementation changes. Record the expected outcome of every recommended experiment.
| Audit gate | Pass condition | When it fails |
|---|---|---|
| Tags | Campaign traffic carries usable source fields | Fix UTMs or channel mapping |
| Events | One successful action produces one eligible event | Debug missing or duplicated events |
| CRM / commerce | Conversions match source records within explained bounds | Check IDs, stage definitions, latency |
| Attribution | Model and lookback are documented | Label conflicting credit rules |
| Permissions | Client sees only approved data | Review sharing and workspace access |
A standardized audit produces reusable operations rather than a false “universal dashboard.” Agencies can adapt the same process to different clients without pretending their metrics are interchangeable.
How to choose agency analytics software
Software should be evaluated against the reporting and analysis tasks the agency actually performs. A connector count is not enough if the platform cannot explain a lead’s relationship to revenue.
- Client separation: Can workspaces, permissions, and dashboards be isolated for each account?
- Outcome depth: Can completed conversions be reconciled with CRM opportunities or orders?
- Attribution transparency: Are models, windows, and exclusions visible and comparable?
- Reporting control: Can the agency tailor dashboards, access, scheduling, and branding?
- Data health: Does the team have a way to identify missing or unreliable tracking?
- Operating cost: What implementation, seat, usage, and support costs apply at scale?
A white-label requirement may be decisive for some agencies. The practical difference between a branded reporting surface and the underlying measurement system is covered in white label analytics.
Teams comparing specialist vendors can evaluate agency marketing attribution tools separately. This article focuses on how to run the measurement operation, not a ranking of software products.
How Usermaven supports agency analytics
Usermaven combines attribution-focused marketing measurement with website behavior, conversion analysis, and client-ready reporting. Its agency solution is designed for separate workspaces and revenue-focused measurement across clients.
Keep each client’s measurement separate
Separate workspaces let agency teams organize each client’s own goals, connected data, dashboards, and attribution settings. A standard onboarding checklist can be reused without blending client records.
Trace campaigns to conversion outcomes
Agencies can examine channels, campaigns, eligible conversion goals, and touchpoint credit under different models. Customer journey analytics software and funnel analytics software support investigation beyond campaign totals.
For consistent goal definitions, the conversion goals documentation explains supported configurations. Agencies should still verify CRM or payment outcomes against their original systems.
Build branded reports with appropriate access
Custom analytics dashboards provide focused views for client discussions. Usermaven’s white-label documentation describes supported branding and custom-domain settings, which may depend on the account configuration.
The shareable dashboard documentation explains public and password-protected sharing options for website statistics. Sharing sensitive client data still requires an explicit permissions review.
Check the measurement before the meeting
The Measurement Trust Center displays a Trust Score and prioritized fixes across campaign tracking, customer matching, connected platforms, conversion feedback, and data confidence.
An agency can use these checks to identify gaps before interpreting a sharp performance change. A health score does not replace controlled tests or guarantee perfectly complete measurement.
Investigate recurring patterns with Maven AI Agents
Maven AI supports natural-language questions and analytical reporting. Its scheduled Agents can investigate acquisition changes, campaign performance, and funnel drop-offs using read-only analytics tools.
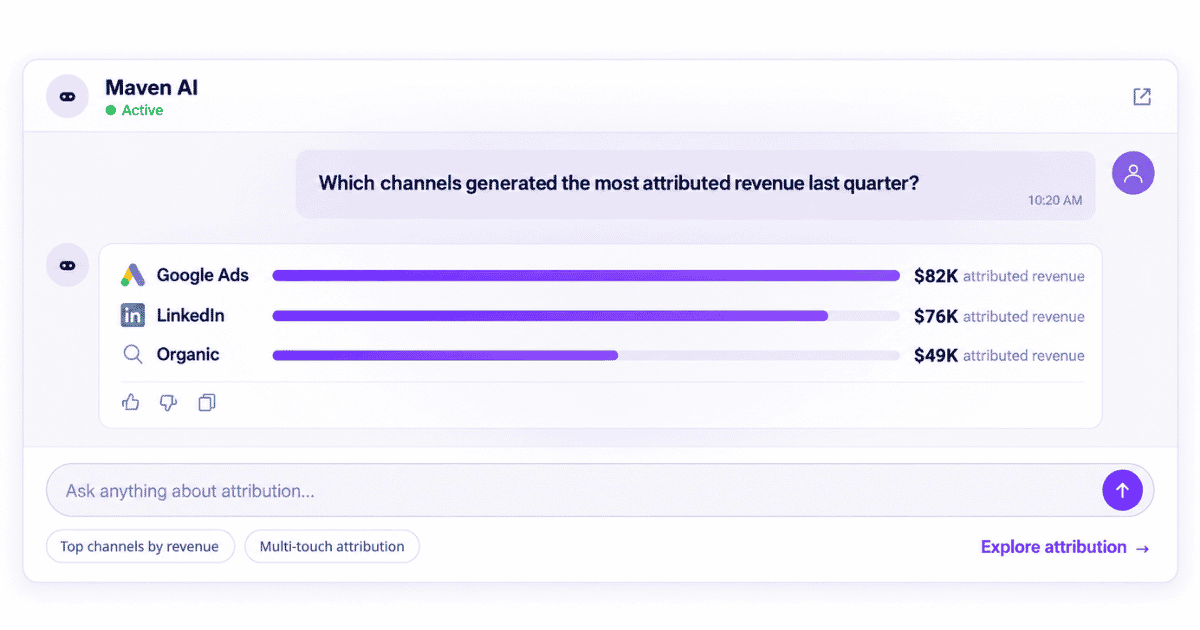
The Maven AI Agents documentation describes schedules and report delivery through Maven, email, or Slack. Agents investigate and report; they do not automatically change ad budgets or CRM records.
For agencies with long B2B buying cycles, Enterprise workspaces can also use custom attribution-model settings where supported. Models change assigned credit, not historical conversions or incremental lift.
Case study: A repeatable tracking standard
In a published Salt Marketing Group case study, the agency describes fragmented attribution when clients sent ad traffic to separate booking domains. Half its clients had that cross-domain challenge.
Salt Marketing Group standardized cross-domain tracking, pinned events, and conversion goals across 15+ client accounts. The case study reports 10,000+ conversions attributed across client domains.
That outcome is evidence of measurement coverage and reporting consistency, not proof that Usermaven generated 10,000 additional conversions or increased client revenue by a known amount.
What agencies can borrow: Put domain mapping, conversion definitions, and test events into onboarding, so each new client begins with a measurable, auditable journey.
Common agency analytics mistakes
- Adding incompatible conversions: Keep ad-platform credit claims separate from unique confirmed leads or purchases.
- Optimizing to form fills only: Review qualified outcomes and stage progression before reallocating a client’s budget.
- Hiding attribution rules: Show the model, window, and major exclusions whenever reported channel value changes.
- Ignoring broken tracking: Verify conversion paths and data freshness before describing a decline as a market problem.
- Sharing too much data: Validate workspace access, sharing settings, and client confidentiality before publishing dashboards.
- Reporting without a decision: End each review with the next test, its owner, and the date results will be evaluated.
Turn client data into better decisions
The value of agency analytics is not a larger report. It is a defensible explanation of what changed, what can be trusted, and where the next investment should go.
When campaigns, journeys, and revenue need to be evaluated together, book a demo to explore how Usermaven can support consistent client measurement and reporting.
FAQs
1. What is agency analytics?
Agency analytics is the measurement and interpretation of campaign, website, conversion, and customer data for client accounts. Its purpose is to inform decisions and explain measurable business outcomes.
2. Is agency analytics the same as AgencyAnalytics?
No. Agency analytics is a general term for measurement operations at agencies. AgencyAnalytics is also the name of a specific client-reporting software company.
3. Which KPIs should agencies report?
Report KPIs linked to each client’s goal. Typical examples include qualified leads, cost per qualified opportunity, purchases, acquisition cost, attributed pipeline, and revenue.
4. Why do advertising and CRM conversions disagree?
Platforms use different attribution and counting rules. CRM systems may deduplicate leads, verify quality, exclude invalid records, and recognize outcomes on a different date.
5. How can agencies track ROI across clients?
Define costs and business outcomes for each client separately. Compare verified revenue or margin with agreed costs, and keep attribution credit distinct from causal lift.
6. What should a client analytics dashboard include?
Include the business goal, KPI trend, baseline, channel contribution, important data limitations, a short interpretation, and the recommended next action.
7. How often should agencies report?
Operational checks can run weekly or more often, while executive reviews are commonly monthly. The cadence should match conversion volume and the client’s decision cycle.

Written by
Adeel Khan
Growth Marketing Expert
Adeel Khan is a full-stack SaaS marketer with 10+ years of experience in content marketing, paid advertising, analytics, and conversion rate optimization. He shares practical insights and strategies drawn from hands-on experience, helping B2B SaaS marketers improve performance and make better marketing decisions.
All articles by Adeel →