Black Friday metrics help you judge whether a promotion attracted valuable customers, generated enough contribution to cover its costs, and created business that lasts beyond the sale. A revenue spike answers only part of that question.
Discounts can lift conversion while reducing margin. A campaign can produce cheap trials that never activate. Paid channels can each claim the same purchase. Useful reporting connects the offer, acquisition cost, verified financial outcomes, and what customers do afterward.

This guide covers 12 Black Friday sales metrics to track, with formulas, reporting windows, and guidance for ecommerce and SaaS teams. Marketing attribution software helps connect recorded campaign interactions with outcomes, while commerce, CRM, and billing records remain essential for validating the money.
Key takeaways
- Define the outcome: A signup, demo, first purchase, and subscription upgrade are different conversions.
- Protect contribution: Compare revenue after discounts and refunds with acquisition and delivery costs.
- Respect timing: Live conversion signals arrive sooner than retention, renewal, and payback evidence.
- Separate customer groups: Report new customers, repeat buyers, upgrades, and reactivations separately.
- Compare consistent cohorts: Hold the denominator, attribution settings, and observation window constant.
Black Friday metrics at a glance
Choose a small set of primary outcomes before launch. Use supporting metrics to explain movement, rather than treating every number as an equally important target.
| Metric | What it answers | Main review window |
|---|---|---|
| Conversion rate | Are eligible visitors completing the intended action? | During the campaign |
| New paying customers | Are we acquiring genuinely new customers? | During and after |
| Customer acquisition cost | What did acquiring each new customer cost? | After outcomes mature |
| Attributed ROAS | How much conversion value received ad credit? | During and after |
| Marketing efficiency ratio | How does overall revenue compare with marketing spend? | During and after |
| Net sales after refunds | How much sales value remains? | After adjustments arrive |
| Contribution margin | What remains after relevant variable costs? | Provisional during; reconcile later |
| Average order value | How much value does the typical order contain? | During and after |
| Checkout or signup abandonment | Where are potential customers dropping out? | During the campaign |
| Trial-to-paid conversion | Do promotional trials become paid accounts? | After the trial window |
| Activation rate | Are new accounts reaching product value? | At a defined cohort age |
| Retention or repeat purchase | Do promotional customers remain valuable? | At matched follow-up periods |
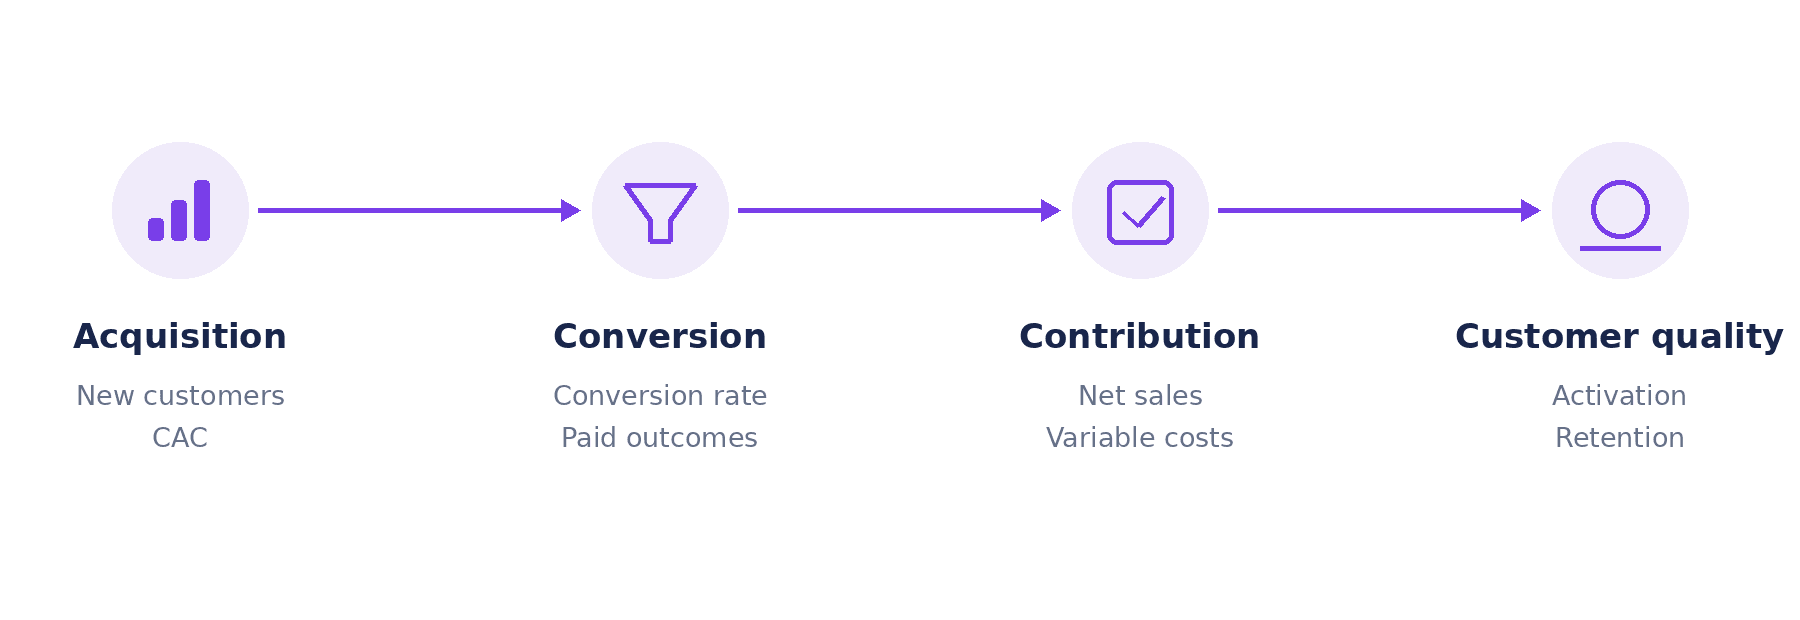
The four stages connect acquisition with conversion, contribution, and customer quality. They are a reporting framework, not a claim that attribution proves incremental growth.
Set your reporting rules before comparing results
Black Friday analytics can tell different stories when teams use different definitions. Agree on these rules before using the numbers to change spending.
Campaign scope: Decide whether the report covers Black Friday itself, the full Black Friday Cyber Monday period, or a longer promotion. For a US audience, name the reporting timezone and account for the different weekdays when comparing years.
Conversion unit: Specify whether you count sessions, people, orders, or accounts. For B2B SaaS, several contacts may belong to one paying company. Deduplicate at the level relevant to the decision.
Revenue basis: Distinguish order value, cash collected, recurring run rate, and recognized revenue. Use one currency and document whether taxes, shipping, discounts, cancellations, and refunds are included.
Attribution and maturity: Record the conversion goal, credit model, lookback window, and reporting date. A sale completed during the weekend and a sale resulting from weekend ad spend belong to different timing questions.
Campaign tagging and event validation are covered in tracking Black Friday marketing campaigns. Here, the focus is interpreting the results once that measurement chain exists.
12 Black Friday metrics worth tracking
These Black Friday sales event metrics work together. A strong conversion rate needs enough customer value and contribution behind it to justify the acquisition cost.
1. Conversion rate
Formula: Eligible visitors who complete the selected action ÷ eligible visitors × 100. A session-based store report instead uses converting sessions ÷ eligible sessions × 100; label the denominator explicitly.
Choose one action for each rate, such as a completed order, trial registration, or demo booking. Do not blend these outcomes into a single percentage and describe it as a purchase conversion rate.
How to use it: Break out paid and unpaid traffic, device, landing page, and new versus returning audiences. If mobile conversion drops while desktop is stable, inspect the mobile journey before reducing all campaign spend.
Watch for: Bot traffic, repeat events, different consent coverage, and changed audience mix. Compare the same event definition and denominator across periods. A higher conversion rate obtained through a deeper discount may still deliver less contribution per visitor.
2. New paying customers
Calculation: Count distinct customers or accounts making their first qualifying paid purchase within the defined period.
This separates customer acquisition from orders placed by repeat buyers. For SaaS, keep existing-customer upgrades and reactivated subscriptions in their own categories. A company buying more seats is expansion, even if an individual employee has never paid before.
How to use it: Compare new-customer volume with acquisition cost, activation, and later retention. If most promotional revenue came from existing buyers, the offer may have worked as a retention or expansion campaign rather than an acquisition campaign.
Watch for: Multiple emails, guest checkout, duplicate CRM contacts, and one company represented by several users. A first purchase visible in the reporting tool is not automatically the customer’s first purchase ever; validate against available history.
3. Customer acquisition cost
Formula: Relevant acquisition costs ÷ new paying customers acquired by those activities.
State whether you mean paid-media acquisition cost or fully loaded CAC. Ad spend alone produces a narrower measure than costs including sales effort, creative production, agency fees, and acquisition incentives.
How to use it: Compare cohorts with enough time to convert. A B2B buyer who books a Black Friday demo may sign later. Dividing weekend spend only by customers who closed that weekend can misrepresent that investment.
Watch for: A mismatch between spend and customer periods. Do not include repeat orders in the denominator of new-customer CAC. Compare customer contribution and quality as well as acquisition cost: a cheaper customer who refunds or churns quickly may be less valuable.
4. Attributed return on ad spend
Formula: Conversion value attributed to ads ÷ corresponding ad spend.
ROAS describes the value receiving credit under the selected reporting rules. If a signup goal has an assigned monetary value, the result is value-based reporting for that goal, not verified purchase revenue.
How to use it: Compare campaigns using the same goal, model, period, and currency. Inspect how rankings change under another reasonable model before making a large budget decision.
Watch for: Adding together revenue claimed by multiple ad platforms. Their windows and credit rules can overlap. A high attributed ROAS also does not prove the sale would not have occurred without the ad; causal questions require an appropriate experiment or comparison.
5. Marketing efficiency ratio
Formula used here: Net sales revenue for the period ÷ total marketing spend for the same period.
Some teams use total sales divided only by ad spend and also call that MER. State your convention beside the ratio so a change in included costs does not masquerade as improved efficiency.
How to use it: Use MER as an overall check alongside channel attribution. If one platform reports stronger ROAS but business-level efficiency weakens, investigate spend, organic demand, discounts, refunds, and revenue timing.
Watch for: Calling MER an attribution model. It does not allocate credit or establish causation. For long B2B sales cycles, same-period revenue may reflect earlier investment, so a daily ratio is especially limited.
6. Net sales after refunds and cancellations
Calculation: Gross product or service sales less discounts and relevant sales reversals, under a documented policy. Track net cash collected separately when payment timing is material.
The headline order total can overstate the value retained after cancellations, returns, refunds, or chargebacks. Apply adjustments once, and keep tax and shipping treatment consistent.
How to use it: Mark early results as provisional. Revisit the promotional order cohort after the normal adjustment window rather than subtracting unrelated historical refunds from its results.
Watch for: Assuming every system uses the same definition. Shopify sales reports distinguish gross sales, discounts, and sales reversals. Reconcile the appropriate fields rather than comparing a gross dashboard total with a net finance figure.
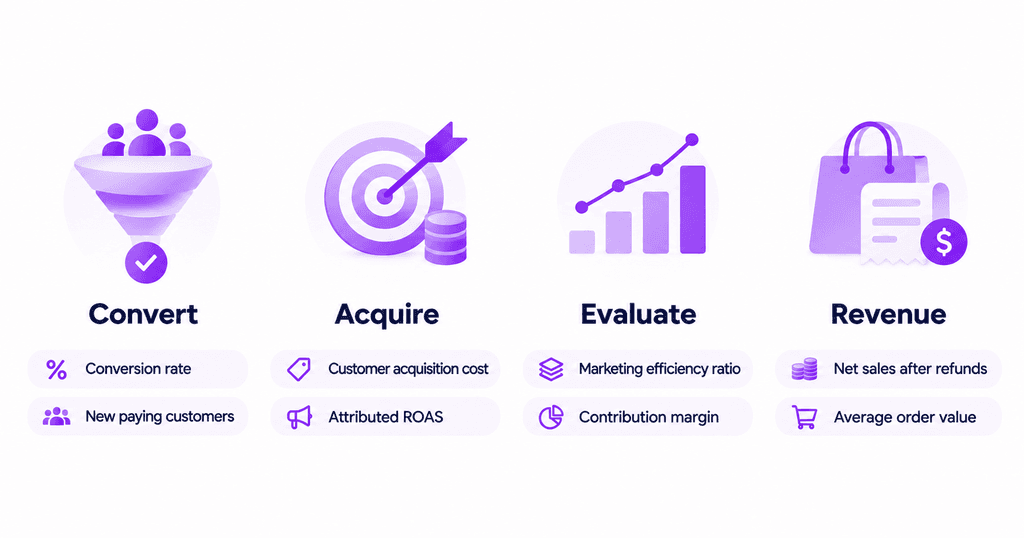
7. Contribution margin after promotional costs
Formula: Net sales less the variable costs included in your agreed contribution definition. Contribution margin percentage = contribution ÷ net sales × 100.
Relevant costs can include product delivery, payment processing, fulfillment, shipping subsidies, returns handling, and variable support. If marketing spend is deducted, label the result contribution after marketing. Avoid deducting the same cost again elsewhere.
How to use it: Evaluate whether an order, customer cohort, or campaign leaves enough contribution to support the business. Review discount depth and delivery costs before celebrating volume growth.
Watch for: Treating gross margin, contribution, and net profit as interchangeable. Fixed overhead and other expenses may still sit below contribution. A promotion that improves short-term cash collection can nevertheless reduce customer-level economics.
8. Average order value
General formula: Order revenue under a stated policy ÷ corresponding orders. Use the same policy in both comparison periods.
Shopify’s native AOV uses gross sales less discounts, excluding specified post-order adjustments, divided by orders. A separate refund-adjusted order-value calculation can answer another question, but should not be presented as the identical native metric.
How to use it: Assess bundles, minimum-spend offers, and product mix alongside margin. An increase in basket value does not justify a shipping subsidy or low-margin bundle automatically.
SaaS distinction: Subscription teams should examine recurring value per paid account, plan mix, and expansion. An annual prepayment is cash collected upfront; its full amount is not one month’s MRR. Avoid using ecommerce AOV as a substitute for subscription economics.
9. Checkout or signup abandonment
Formula: Eligible checkout or signup starters who do not complete within the defined window ÷ eligible starters × 100.
Count distinct starters or accounts consistently, and allow a reasonable period for returning visitors. For ecommerce, checkout abandonment and cart abandonment have different starting events. For SaaS, distinguish signup completion from later paid conversion.
How to use it: Inspect the step where loss increases. Payment failures, unclear eligibility, missing coupon feedback, mandatory account creation, or device-specific problems suggest different fixes.
Watch for: Counting a still-open journey as permanently abandoned. A visitor who returns the next day can change the result. The Black Friday marketing ideas for SaaS article explains offer and messaging choices that can remove buying friction.
10. Trial-to-paid conversion
Formula: Trial accounts in a defined cohort that become paying accounts within the agreed window ÷ eligible trial accounts in that cohort × 100.
This is one of the most useful Black Friday marketing success metrics for trial-based SaaS. It shows whether promotional demand becomes paying business after users have had time to evaluate the product.
How to use it: Compare like-for-like cohorts by trial length, acquisition source, plan eligibility, and observation age. Segment credit-card-required trials separately from trials without that requirement.
Watch for: Comparing an older cohort’s completed conversions with a newer cohort still in trial. Also distinguish a first payment from a customer retained beyond the refund period. Publish the conversion window beside the percentage.
11. Activation rate
Formula: Eligible new accounts reaching the defined activation milestone within the observation window ÷ eligible new accounts × 100.
Choose a milestone that represents initial product value. For a reporting product, that might be connecting a valid source and using a first report. The milestone must reflect your product and should be validated against later outcomes, rather than chosen solely because it is easy to count.
How to use it: Compare acquisition sources, onboarding paths, and offers. A promotion producing many signups but little activation may need improved qualification or implementation support.
Watch for: Mixing individual-user activity with account-level activation. Keep the definition stable while comparing cohorts. Activation is an early indicator; it does not replace evidence of renewal or sustained use.
12. Customer retention or repeat purchase
Retention formula: Customers from the original cohort still meeting the active or paid definition at a specified follow-up point ÷ original cohort customers × 100.
Repeat purchase formula: Customers in the acquisition cohort making another qualifying purchase within the agreed window ÷ customers in that cohort × 100.
How to use it: Compare Black Friday customers with a relevant baseline at the same cohort age. Use repeat purchase for a store’s buying cycle and paid retention for subscriptions. Separate planned nonrenewals from payment failures where possible.
Watch for: Counting product visits as paid retention or comparing a 30-day promotional cohort with a 90-day baseline. Annual customers acquired in November cannot demonstrate first annual renewal retention in December. Mark incomplete outcomes as pending.
SaaS metrics that complete the Black Friday picture
A SaaS promotion can improve cash flow while attracting accounts that struggle to activate or fail to renew. Add recurring revenue and acquisition recovery to the conversion metrics above.
Separate new MRR from expansion and reactivation
New MRR comes from new paying subscriptions. Expansion MRR comes from existing subscribers increasing recurring value. Reactivation should remain identifiable, with contraction and churn recorded separately.
For fixed subscriptions, normalize recurring charges to a monthly amount under the billing policy, including the treatment of discounts. An annual charge is typically spread across its covered months for MRR reporting. One-time setup charges and custom-event bonuses are not recurring subscription revenue.
Report net MRR movement alongside cash receipts. A monthly subscriber switching to annual billing can improve cash collection without creating the same amount of new recurring revenue.
Estimate CAC payback with gross profit
Approximate formula for a stable subscription cohort: CAC ÷ (monthly recurring revenue per customer × gross margin percentage). Express gross margin as a decimal; the result is in months.
Stripe’s CAC payback explanation uses monthly customer profit to assess acquisition recovery. When discounts, usage costs, churn, or expansion vary significantly, a cumulative cohort gross-profit schedule is more useful than a flat monthly estimate.
Do not label upfront annual cash as immediate economic payback without naming that cash-based convention. No universal target fits every SaaS model; compare the result with your margins, retention, funding constraints, and sales cycle.
What to measure during Black Friday and afterward
Different questions become answerable at different times. Keep a live operating report separate from the more complete customer-cohort review.
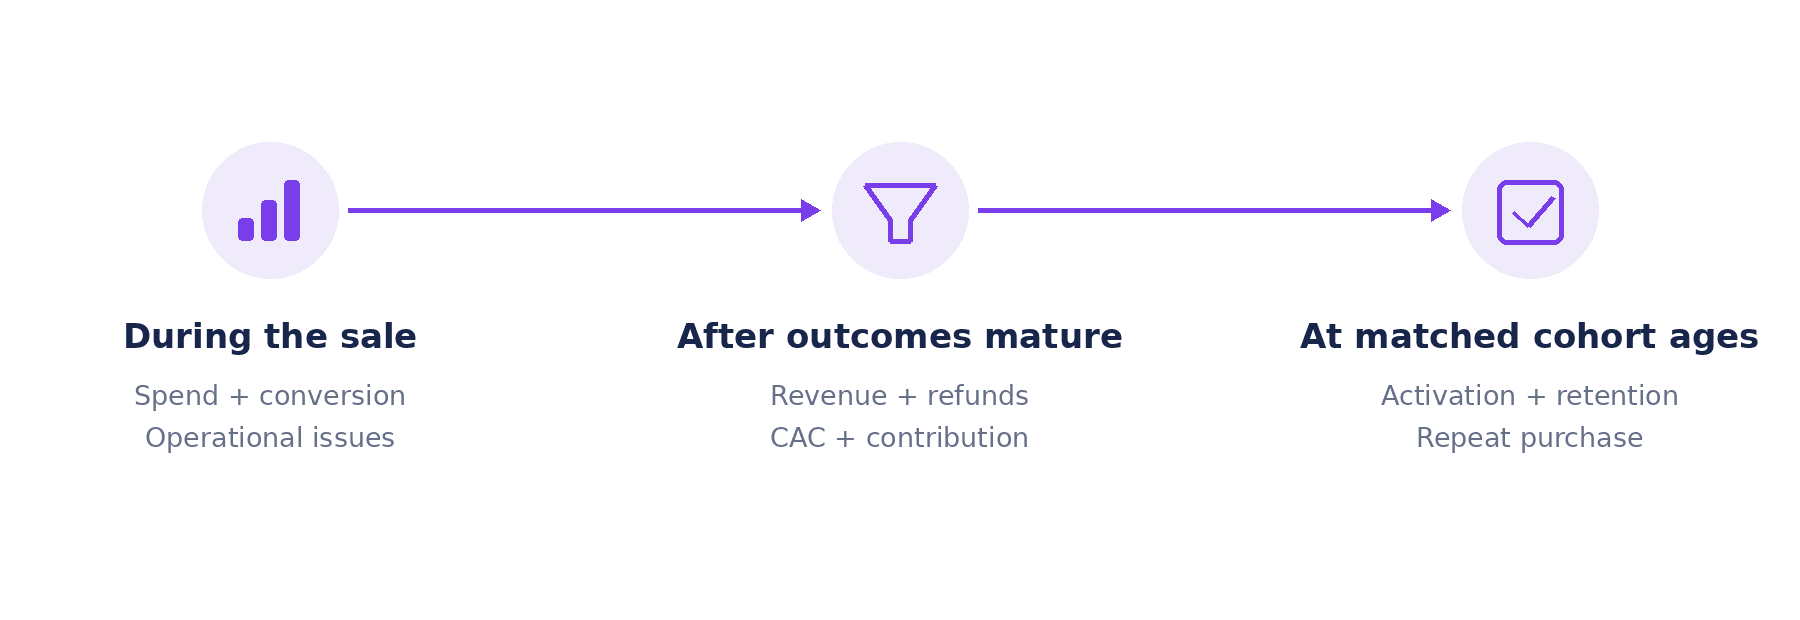
The windows are illustrative review stages, not guaranteed conversion or retention deadlines. Choose follow-up dates using your trial, return, sales, and renewal cycles.
During the campaign: Monitor spend, qualifying conversions, payment failures, abandonment, and provisional contribution. Use CTR, CPC, email clicks, and traffic as diagnostics that explain movement, not substitutes for business outcomes.
After the conversion window: Reconcile paying customers, conversion value, refunds, CAC, and campaign attribution. Recheck spend cohorts once delayed outcomes have arrived.
At matched customer ages: Evaluate activation, repeat purchase, retention, and cumulative contribution. Subscription renewal and LTV conclusions need enough history; label observed value as realized value rather than a lifetime prediction.
How to use Black Friday benchmarks responsibly
There is no single good Black Friday conversion rate, ROAS, or CAC that applies across ecommerce, self-serve SaaS, and enterprise software. Product margin, audience intent, geography, device mix, discount depth, and reporting definitions change the comparison.
Start with your own baseline, then use external Black Friday benchmarks as context. Check the source’s year, sample, industry, location, conversion unit, attribution basis, and whether it reports a mean or median. A platform’s selected customer sample is not automatically representative of your business.
Compare the same campaign length and equivalent weekdays. Separate changes in price, traffic mix, inventory, sales capacity, and offer eligibility from changes in marketing performance. In a small B2B cohort, report the customer count beside any rate so a handful of wins does not look like a stable trend.
For Shopify metrics to track for Black Friday, prioritize store conversion, order value, new-customer acquisition, net sales, abandonment, and repeat purchase. Keep Shopify’s native field definitions visible when comparing them with a cross-channel report.
Turn the scorecard into a decision
A metric becomes useful when the team knows what to investigate next. Agree on the primary commercial outcome before deciding which campaigns to scale.
| Pattern | Investigate | Possible action |
|---|---|---|
| More revenue, less contribution | Discount depth, product mix, delivery costs | Review offer economics before scaling |
| Strong platform ROAS, weak overall efficiency | Overlapping credit, refunds, revenue timing | Reconcile outcomes and compare settings |
| Many trials, little activation | Audience fit and onboarding steps | Improve qualification or guided setup |
| Good activation, weak paid conversion | Trial length, pricing and buying process | Investigate the upgrade journey |
| Low CAC, weak retention | Customer fit and promotional expectations | Review targeting and acquisition promises |
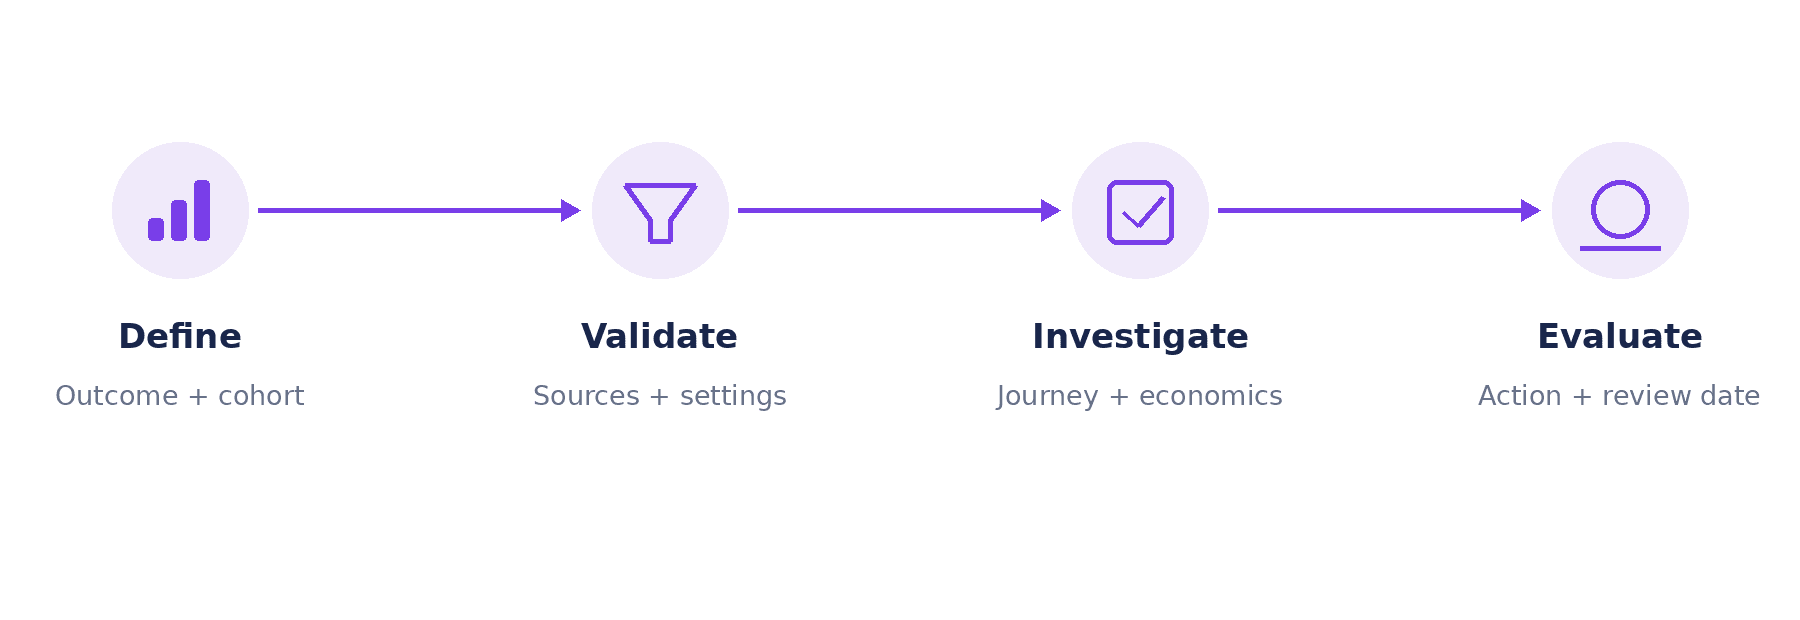
Start with the outcome, validate the report, inspect the journey, and choose a change you can evaluate. Attribution supports that process, while experiments are needed for stronger causal conclusions.
How Usermaven supports Black Friday performance analysis
Usermaven combines marketing attribution with website and product analytics, helping teams connect acquisition activity with recorded conversions and customer behavior. Use it alongside reconciled commerce, CRM, and billing records for the complete scorecard.
Compare paid ads against the right goal
Usermaven’s paid ads attribution supports connected Google, Meta, LinkedIn, and Microsoft ad networks. Reports include spend and attributed conversion measures, with analysis across supported source, campaign, ad-set, and ad dimensions.
Choose a paid-purchase or relevant commercial goal when evaluating revenue. A static assigned value for a free signup remains an assigned value, even if the chart expresses it in dollars.
Conversion-date reporting examines conversions completed in a selected period. Spend-date reporting follows clicks from the selected spend period through a look-ahead window. Choose the timing that matches the business question and allow outcomes to mature.
Investigate conversion gaps and customer quality
Usermaven funnels help examine the steps between acquisition and a selected outcome. With the necessary events and identifiers captured, segments and product analysis can support comparisons of promotional customers, activated accounts, and other eligible groups.
Agree on customer identities and cohort definitions before interpreting differences. Financial adjustments and contribution costs still need their authoritative business sources; they should not be assumed to appear automatically in every analytics report.
Investigate performance with Maven AI
Maven AI lets you ask questions about attribution, campaign performance, and customer behavior in plain language. During Black Friday, you can investigate conversion changes, explore funnel drop-offs, and create reports or dashboards from your connected workspace data.
Monitor campaign changes with Maven AI Agents
Maven AI Agents run recurring investigations on a schedule you choose. Set an objective for your Black Friday campaign, define the conversion goal and data scope, and have an Agent review campaign performance or funnel drop-offs daily, on weekdays, or weekly.
Campaign watch and conversion funnel check templates provide starting points. Each run produces findings with supporting evidence and suggested areas to investigate, helping your team spot changes without repeating the same analysis manually. Agents investigate data; your team reviews the findings and decides whether to adjust the campaign.
Check measurement quality before changing spend
The Measurement Trust Center checks campaign tracking, customer matching, connected platforms, conversion feedback, and data confidence. Its Trust Score and prioritized fixes help you identify missing campaign details or connection issues before using Black Friday reports to change budgets.
Usermaven’s Black Friday offer
New customers can get practical support for setting up measurement and using the platform:
- Free onboarding and setup: Expert help setting up tracking and attribution.
- Free monthly guidance for one year: Help resolving issues and making better use of Usermaven.
- 1 million free custom events: A tracking bonus for the first 100 new customers.
Offer dates: November 6–30, 2026. Eligibility: New customers only; the custom events bonus is limited to the first 100 new customers.
Official offer:
The Black Friday SaaS deals roundup brings together software offers for teams evaluating purchases. Keep the cost of any new tool separate from the value you expect it to help measure.
Black Friday metrics review checklist
Use these checks before sharing a campaign scorecard or changing a budget.
- Outcome: Name the primary conversion and the customer or account unit.
- Financial basis: State how discounts, refunds, taxes, and delivery costs are treated.
- Period: Record the timezone, campaign dates, and cohort observation age.
- Attribution: Keep the model, goal, and window visible.
- Segmentation: Separate new customers, repeat buyers, upgrades, and reactivations.
- Validation: Reconcile customer counts and financial amounts with source records.
- Maturity: Identify which conversions, refunds, and retention outcomes remain incomplete.
- Decision: Assign an owner, next action, success measure, and review date.
Make the next campaign decision clearer
The most useful Black Friday KPIs explain customer acquisition, conversion, contribution, and lasting value together. Choose a primary outcome, compare consistent cohorts, and treat early results as provisional when the buying or adjustment cycle is still open.
If you want to connect campaign spend with conversions and customer journeys, book a demo to explore how Usermaven can support your reporting.
FAQs
1. What are Black Friday metrics?
Black Friday metrics are measures used to evaluate a promotional campaign’s acquisition, conversion, financial outcomes, and customer quality. Useful examples include conversion rate, new paying customers, CAC, attributed ROAS, contribution margin, activation, and retention.
2. Which Black Friday sales metrics should I track first?
Start with qualifying conversions, new paying customers, net sales, acquisition costs, and contribution. Use abandonment and channel performance to investigate problems. Add activation and retention when enough follow-up history exists.
3. What is a good Black Friday conversion rate?
There is no universal rate. Compare your own consistent baseline and relevant external samples, accounting for business model, audience, device, offer, and whether the denominator is visitors, sessions, or accounts.
4. What is the difference between ROAS and MER?
Attributed ROAS divides the value credited to ads by ad spend. MER provides an overall revenue-to-spend comparison under a stated cost convention. MER does not allocate credit, and neither ratio alone proves causal impact.
5. Which Shopify metrics matter for Black Friday?
Prioritize store conversion, new paying customers, AOV, net sales, abandonment, acquisition cost, and repeat purchase. Check Shopify’s definitions before comparing native reports with another system’s totals.
6. Which SaaS metrics should I measure after Black Friday?
Follow trial-to-paid conversion, account activation, new and expansion MRR, retention, and CAC payback. Compare cohorts at the same age and keep annual cash collection separate from monthly recurring revenue.
7. When should I finalize my Black Friday report?
Publish a provisional operating view during the campaign. Reconcile it after the relevant conversion and refund windows, then revisit customer quality at defined cohort ages. Annual renewal and lifetime-value conclusions need longer follow-up.
8. How can Usermaven help measure Black Friday performance?
Usermaven connects marketing attribution with website and product analytics to help teams compare paid campaigns, inspect funnel drop-offs, and understand customer journeys. Maven AI Agents support recurring analysis, while the Measurement Trust Center helps surface tracking issues. Combine these insights with reconciled sales and cost records to evaluate the campaign scorecard.

Written by
Junaid Ahmed
Content Writer & Digital Marketer
Junaid Ahmed is a content and copywriter with 3+ years of experience creating research-driven content across SaaS, B2B, ecommerce, and digital marketing. He specializes in turning complex topics into clear, practical content that helps marketers better understand their challenges, evaluate solutions, and make informed decisions. His work spans educational content, industry insights, and actionable marketing guides.
All articles by Junaid →