Many SaaS companies invest heavily in marketing, yet struggle to identify which efforts truly drive growth. Without clear insights, teams often make decisions based on assumptions, wasting budget on underperforming channels and missing key opportunities to scale.
This is where SaaS marketing analytics becomes essential.
By systematically tracking the right data, such as customer acquisition cost (CAC), churn rate, and revenue performance, SaaS analytics helps teams move from guesswork to informed, data-driven decisions. It reveals which campaigns convert high-value users, which segments are most profitable, and where to optimize for better results.
In a subscription-based market, understanding your full marketing funnel isn’t optional. It’s the foundation for reducing churn, improving ROI, and building sustainable growth. With the right analytics strategy and tools in place, SaaS companies can align marketing efforts with measurable business outcomes and stay ahead of the competition.
Power up your SaaS with perfect product analytics
*No credit card required
What is SaaS marketing analytics?
SaaS marketing analytics is the process of tracking, analyzing, and interpreting marketing data specifically for subscription-based software businesses. It goes beyond basic website metrics by focusing on the full customer journey, from first interaction to conversion, activation, and long-term retention.
This type of analytics helps SaaS marketers understand which acquisition channels perform best, how different segments engage across the funnel, and where to optimize spend for better results. It connects metrics like customer acquisition cost (CAC), churn rate, and lifetime value (LTV) to actual marketing performance, allowing teams to make decisions based on data, not assumptions.
Unlike product analytics, which focuses on how users interact within the software itself, SaaS marketing analytics is concerned with how users discover, evaluate, and convert. It also provides broader insights than traditional attribution tools, offering a full-picture view of marketing efficiency and business impact.
Why data-driven SaaS companies outperform the competition
The most successful SaaS companies aren’t just creative with their marketing; they’re strategic with their data.
When marketing teams base decisions on analytics rather than assumptions, they unlock patterns that lead to smarter growth. For example, by analyzing conversion rates across campaigns and segments, teams can identify which channels consistently attract high-quality leads. Or by tracking churn triggers, they can proactively adjust messaging or onboarding flows to improve retention.
Data-driven marketing also enables real-time feedback loops. As teams test different tactics, such as paid campaigns, content formats, or email sequences, they can quickly see what’s working and what’s not. This agility reduces wasted spend and shortens the path to ROI.
This is also why many SaaS companies choose to work with a paid media agency that understands subscription economics. A generic ads team can optimize for clicks, but a paid media partner that thinks in terms of CAC, LTV, and payback periods will allocate spend toward the channels that actually drive retained revenue.
More importantly, analytics empowers personalization at scale. Instead of generic messaging, SaaS marketers can tailor campaigns based on behavior, industry, lifecycle stage, and other attributes, leading to higher engagement and conversion rates.
Power up your SaaS with perfect product analytics
*No credit card required
What are the types of SaaS marketing analytics?
SaaS marketing analytics isn’t just about tracking numbers; it’s about understanding what they mean, how to act on them, and how AI in marketing automation can turn insights into smarter, data-driven campaigns.
Four core types of analytics help teams move from raw data to real decisions:
1. Descriptive analytics: Understanding what happened
Descriptive analytics gives you a clear view of past performance. It summarizes raw data into charts, dashboards, and reports that highlight trends in traffic, conversions, revenue, and customer behavior.
Example: You notice that website traffic grew 20% last quarter and that email campaigns outperformed social media for enterprise leads. While descriptive analytics doesn’t explain why this happened, it highlights which areas deserve deeper attention.
It’s the foundation of all other analytics, offering clarity on what has occurred before you decide where to go next.
2. Diagnostic analytics: Understanding why it happened
Once you know what happened, diagnostic analytics helps explain why. It identifies the factors that influenced performance, often by comparing segments, testing variations, or spotting correlations in the data.
Example: If your conversion rate dropped after a landing page redesign, diagnostic analytics might reveal that the new layout increased load time or reduced clarity in your call-to-action.
This type of analysis brings context to metrics and helps prevent surface-level fixes that don’t address the underlying issue.
3. Predictive analytics: Anticipating what might happen
Predictive analytics uses historical patterns to forecast future outcomes. By analyzing trends in user behavior, engagement, or churn, SaaS marketers can project what’s likely to happen next.
Example: If data shows that users who don’t engage with onboarding emails within three days are more likely to churn, predictive analytics can help trigger early interventions.
Forecasting helps teams shift from reactive marketing to a proactive SaaS marketing strategy, allocating resources where they’re most likely to pay off.
4. Prescriptive analytics: Knowing what to do next
Prescriptive analytics goes a step further. It not only predicts outcomes, but also recommends specific actions to improve them.
Example: The platform might suggest reallocating 25% of your ad budget to content marketing based on performance trends, or recommend segmenting emails by industry to improve open rates.
By turning insights into guidance, prescriptive analytics supports decision-making and campaign optimization at scale.
In addition to these four, SaaS companies often use specialized forms like:
Email analytics: Measuring engagement and conversions from campaign emails
Social media analytics: Monitoring sentiment and reach across platforms
Together, these analytics types form a complete strategy that informs every stage of the SaaS customer journey, from acquisition to retention.
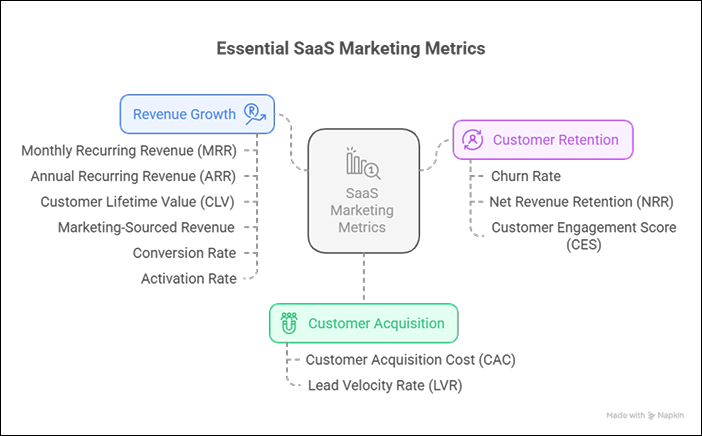
10 essential SaaS marketing metrics you must track
In SaaS, growth isn’t just about attracting more users; it’s about acquiring the right ones, retaining them longer, and scaling revenue efficiently. Tracking the right marketing metrics helps you evaluate performance across the funnel, spot issues early, and optimize strategy based on real results.
Here are the most important metrics every SaaS marketing team should monitor.
1. Customer acquisition cost (CAC)
CAC measures how much it costs to acquire a new customer. It’s calculated by dividing your total marketing and sales expenses by the number of customers gained during the same period.
This metric is critical for understanding the efficiency of your growth engine. If CAC is increasing while revenue remains flat, it may be a sign that your campaigns are underperforming or you’re targeting the wrong segments.
Tracking CAC by channel gives you clarity on which efforts are scalable. For example, if paid ads yield a $900 CAC and organic search delivers customers at $300, you have a clear case for reallocating spend.
Usermaven makes CAC tracking easier by automatically attributing conversions to their original channels, so you can see how much each lead costs and which ones convert into revenue.
2. Customer lifetime value (CLV or LTV)
CLV estimates the total revenue a customer is expected to generate over their entire lifecycle with your company. It’s one of the most important benchmarks for determining how much you can afford to spend on acquisition.
A healthy SaaS business typically maintains an LTV: CAC ratio of at least 3:1. Anything lower suggests you’re spending too much to acquire customers who won’t stick around long enough to justify the cost.
CLV is also useful for prioritizing marketing segments. If enterprise users have a higher LTV than SMBs, you may want to adjust your messaging and funnel to focus more on that group.
With Usermaven’s segmentation and cohort tracking, you can evaluate LTV across different acquisition channels, customer types, or pricing plans, helping you refine both targeting and positioning.
3. Churn rate
Churn rate measures how many customers cancel their subscriptions during a given time period. Even a small increase in monthly churn can compound into significant revenue loss over time.
High churn often points to poor onboarding, weak product-market fit, or misaligned expectations set by marketing. It’s not just a retention issue; it’s a growth blocker.
Marketers can use analytics to identify churn risks earlier in the funnel. For instance, customers who skip onboarding emails or don’t activate key features within the first week are more likely to churn.
Usermaven helps by tying post-signup behavior back to acquisition campaigns, so you can see which channels or messages produce long-term customers, and which ones don’t.
NRR tracks how much recurring revenue you retain from existing customers after factoring in upgrades, downgrades, and churn. If your NRR is above 100%, your existing customer base is growing in value without new acquisition.
This metric is a strong indicator of customer satisfaction and product strength. It shows whether your users find enough value to upgrade, and if your retention strategy is working.
For marketing teams, NRR helps justify efforts in customer marketing, upsell campaigns, and personalized onboarding flows.
5. Monthly recurring revenue (MRR) and annual recurring revenue (ARR)
MRR and ARR are the backbone of SaaS financial reporting. MRR shows the predictable revenue earned each month, while ARR offers a longer-term view over the year.
These metrics help marketing and executive teams assess how campaigns are contributing to steady growth. A sudden jump in MRR after a new content campaign or paid ad test can quickly validate effectiveness.
With Usermaven, you can visualize MRR growth over time and segment it by acquisition source, giving you real-time clarity on which campaigns drive subscription revenue.
6. Conversion rate
Conversion rate measures how effectively you move users through key stages of the funnel, from landing page visits to free trial, trial to paid user, or ad click to sign-up.
Low conversion at any stage signals friction. For example, a high CTR but low trial signup may indicate weak alignment between ad copy and landing page content.
Conversion rate analysis helps optimize messaging, offer structure, and funnel design. With Usermaven, you can track conversion metrics across touchpoints and test variations with no-code event tracking, making it easier to improve performance based on data, not guesswork.
7. Activation rate
Activation rate shows how many users complete a key milestone shortly after signing up, such as launching a project, adding a team member, or finishing onboarding.
This metric is strongly tied to long-term retention. Users who don’t activate early are far more likely to churn.
For marketers, improving activation may involve better onboarding emails, clearer first-touch messaging, or product-led content during the trial phase.
Usermaven lets you define custom activation events and track which channels bring in users who actually activate, not just those who sign up.
8. Lead velocity rate (LVR)
LVR measures the month-over-month growth of qualified leads. It’s a forward-looking metric that indicates whether your pipeline is growing fast enough to support future revenue goals.
Even if MRR or CAC look healthy today, a drop in LVR could mean slower growth is ahead.
Tracking LVR helps marketing teams stay proactive, adjusting campaigns, experimenting with new acquisition channels, or reworking lead qualification criteria.
With Usermaven’s lead tracking, you can monitor lead generation trends in real time and align LVR insights with campaign performance.
9. Marketing-sourced revenue
Marketing Sourced Revenue represents the revenue directly attributed to marketing activities such as ads, content, email campaigns, and lead-nurturing workflows.
It’s a key metric for proving marketing’s impact on the bottom line and securing budget for scaling.
Analytics platforms like Usermaven simplify this by linking users’ entire journey, from first touch to paid plan, so you can accurately quantify the revenue impact of each campaign or channel.
10. Customer engagement score (CES)
Customer Engagement Score reflects how actively a user interacts with your product, communications, and content. It usually combines metrics like login frequency, feature usage, email opens, and time in-app.
A rising CES may indicate users are ready for an upsell. A declining CES can warn of churn risk, even if the user hasn’t canceled yet.
By tracking engagement trends, marketing teams can time re-engagement campaigns, promote advanced features, or support customer success efforts.
Tip: Rather than tracking everything, focus on a core dashboard with 5–7 KPIs tied directly to your business goals. Tools like Usermaven help streamline this by automatically capturing key SaaS metrics across your funnel.
Power up your SaaS with perfect product analytics
*No credit card required
Choosing the right SaaS marketing analytics tools
The analytics tools you choose directly impact how well your team can extract insights, track performance, and optimize growth. For SaaS businesses, the ideal platform should go beyond surface-level metrics and help connect marketing activity to real outcomes like conversions, retention, and recurring revenue.
There are three core categories of analytics tools used by SaaS marketing teams: all-in-one analytics platforms, specialized tools, and data visualization or BI platforms. The right mix depends on your goals, technical resources, and company stage, but a strong foundation always starts with a comprehensive, easy-to-use solution.
As you explore your options, it’s important to evaluate both custom-built solutions and pre-built tools. To help with this decision, take a look at our blog on build vs. buy analytics for insights into which approach best suits your needs.
Usermaven: A marketing attribution platform built for SaaS teams
Usermaven stands out as a no-code SaaS attribution software solution purpose-built for SaaS businesses. It combines marketing attribution with product analytics and website analytics in one unified dashboard, helping you track acquisition channels, user behavior, and conversion performance without relying on multiple tools or complex integrations.
For marketing teams, Usermaven offers automatic tracking of page views, events, and user actions across channels, without needing custom code or manual tagging. This enables you to:
Monitor performance across campaigns and channels in real time
See which traffic sources generate the most activated or retained users
Track CAC, LTV, trial-to-paid conversions, and other essential metrics
Segment users by behavior, source, or attributes for targeted analysis
Unlike legacy tools that rely on cookies or require technical support, Usermaven is cookieless by default, GDPR-compliant, and designed to offer clarity, not clutter. You get insights that are immediately actionable, helping your team optimize campaigns faster and with confidence.
Other all-in-one tools
Google Analytics remains a standard for web tracking, offering high-level traffic insights and goal-based conversions. However, it’s limited in event-level granularity and often requires technical setup, especially when tracking SaaS-specific behaviors.
Adobe Analytics is a powerful enterprise-grade platform with deep customization and integrations. It’s suited for large organizations with the resources to support advanced implementations, but it can be overkill for lean SaaS teams.
Data visualization and BI tools
Platforms like Looker Studio, Tableau, and Power BI are ideal for creating dashboards and reports that consolidate data from multiple sources. They’re particularly useful when you need to present high-level summaries to leadership or run complex cross-platform analysis.
However, they are not analytics tools on their own—they rely on clean, structured data being collected first. Most SaaS teams use BI tools in conjunction with platforms like Usermaven for ongoing performance reporting.
Choosing the right stack
When evaluating SaaS analytics tools, consider:
Ease of setup and usability across teams
Ability to track both marketing and product performance
Integration with your CRM, ad platforms, and lifecycle tools
Privacy compliance and cookie-free tracking
Affordability, scalability, and support
For most growing SaaS companies, a platform like Usermaven provides everything you need to get started quickly, track what matters, and scale your analytics over time, without adding complexity.
Implementing and optimizing your SaaS marketing analytics strategy
Building a scalable analytics strategy requires more than installing a few tools. It involves aligning metrics with goals, integrating platforms, and continuously refining your approach based on what the data reveals. The steps below will help you implement and optimize SaaS marketing analytics effectively.
Set clear goals and define KPIs: Start by aligning your analytics strategy with business objectives. Are you trying to reduce CAC, increase trial-to-paid conversions, or improve retention? Define a small set of meaningful KPIs to track progress against those goals.
Connect your data sources: Most SaaS companies use multiple platforms, CRM, ad networks, email tools, and product analytics. Integrate these sources to get a unified view of your marketing performance. Tools like Usermaven simplify this by automatically collecting and mapping events across web and product touchpoints.
Create role-specific dashboards: Different teams need different views. Executives may want high-level KPIs, while marketers need channel-specific performance and funnel metrics. Tailoring dashboards to each role ensures that insights are accessible and actionable for everyone.
Review and analyze data regularly: Establish a review cadence, weekly, monthly, or by campaign. Look for patterns and friction points. For example, if free users from LinkedIn ads have a higher activation rate than those from Google Ads, you can reallocate the budget accordingly.
Test and iterate based on insights: Use A/B testing and analytics test automation to validate decisions. Try new offers, landing pages, or messaging, then compare results against your baseline. Analytics is most powerful when it’s part of a feedback loop that continuously improves performance.
Refine and scale over time: Your product, audience, and market will evolve, and your analytics strategy should, too. Revisit your KPIs, update segments, and add new metrics as needed. Tools like Usermaven are built to grow with your team, making it easy to adjust without starting over.
Bottom line: SaaS marketing analytics
SaaS analytics is no longer a nice-to-have; it’s the foundation of data-driven growth. By tracking meaningful metrics, connecting the right tools, and continuously optimizing based on insight, marketing teams can improve acquisition, reduce churn, and demonstrate clear business impact.
Usermaven make it easier to connect marketing activity to measurable SaaS growth without unnecessary complexity. With automatic tracking, attribution reporting, and privacy-compliant measurement, SaaS companies can shift from reactive decisions to proactive, measurable growth.
Start with clear goals. Focus on the metrics that actually matter. And use analytics not just to report, but to drive better outcomes at every stage of the funnel.
Power up your SaaS with perfect product analytics
*No credit card required
FAQs about SaaS marketing analytics
1. Why is SaaS marketing analytics important?
It connects marketing actions to measurable outcomes like CAC, LTV, churn, and recurring revenue. Without it, teams rely on assumptions, leading to wasted budget and missed growth opportunities.
2. How is SaaS marketing analytics different from product analytics?
SaaS marketing analytics focuses on pre-signup activity, how users find and convert. Product analytics looks at what users do after signing up, such as feature usage and in-app engagement. Both are essential, but they serve different goals.
3. Which marketing metrics matter most for SaaS?
Key metrics include Customer Acquisition Cost (CAC), Customer Lifetime Value (LTV), Churn Rate, Net Revenue Retention (NRR), Monthly Recurring Revenue (MRR), Activation Rate, and Marketing Sourced Revenue. These offer a full view of performance across the funnel.
4. What tools are best for SaaS marketing analytics?
Usermaven is a strong all-in-one solution built for SaaS teams. Other tools include Mixpanel (product behavior), Google Analytics (web tracking), and Looker Studio or Tableau for data visualization. The best setup depends on your goals and resources.
5. How do I get started with SaaS marketing analytics?
Begin by defining your business goals, identifying KPIs, and choosing a platform that fits your team’s needs. Tools like Usermaven simplify setup with automatic tracking and unified dashboards, allowing you to get insights quickly without technical overhead.
A SaaS marketing team evaluates six attribution tools over three months and signs a $ 24,000-a-year contract. Eight weeks into implementation, they realize the tool tracks pipeline beautifully but has no idea what happens to a customer after the deal closes. Choosing the wrong attribution tool is expensive twice, once in the contract, once in […]
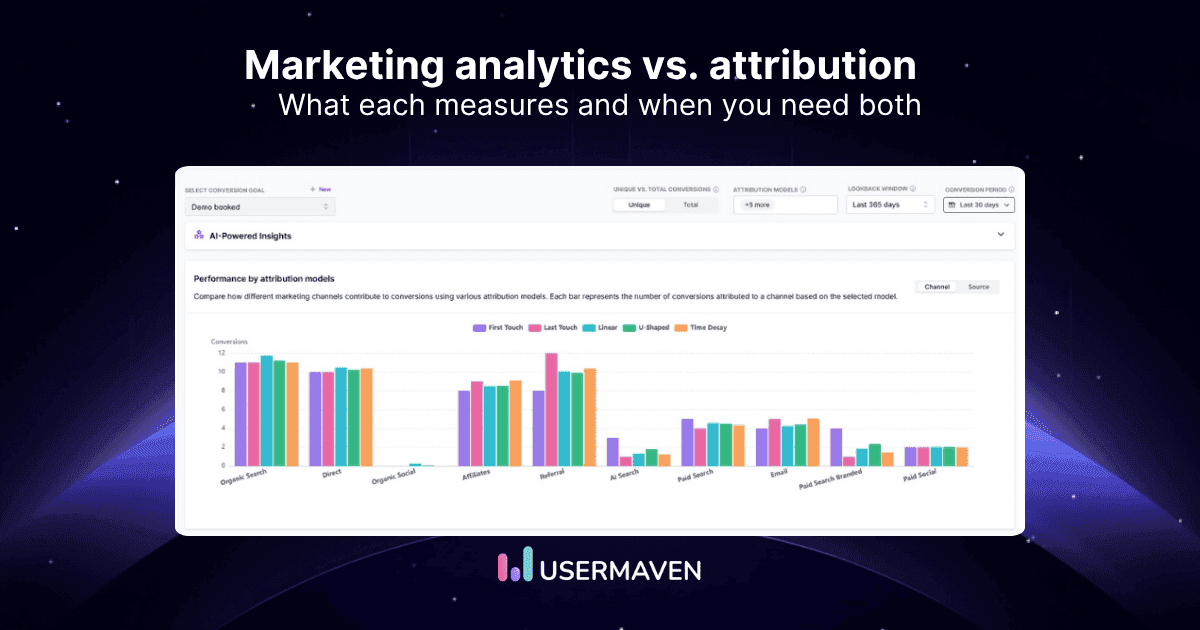
A marketing lead pulls up the analytics dashboard. 40,000 sessions this month. A 2.8% conversion rate. Bounce rate holding steady. Everything looks healthy. Then the CFO asks one question: which channel actually drove the $180,000 deal that closed last week? The dashboard has no answer. That is the exact moment analytics stops being enough. It […]
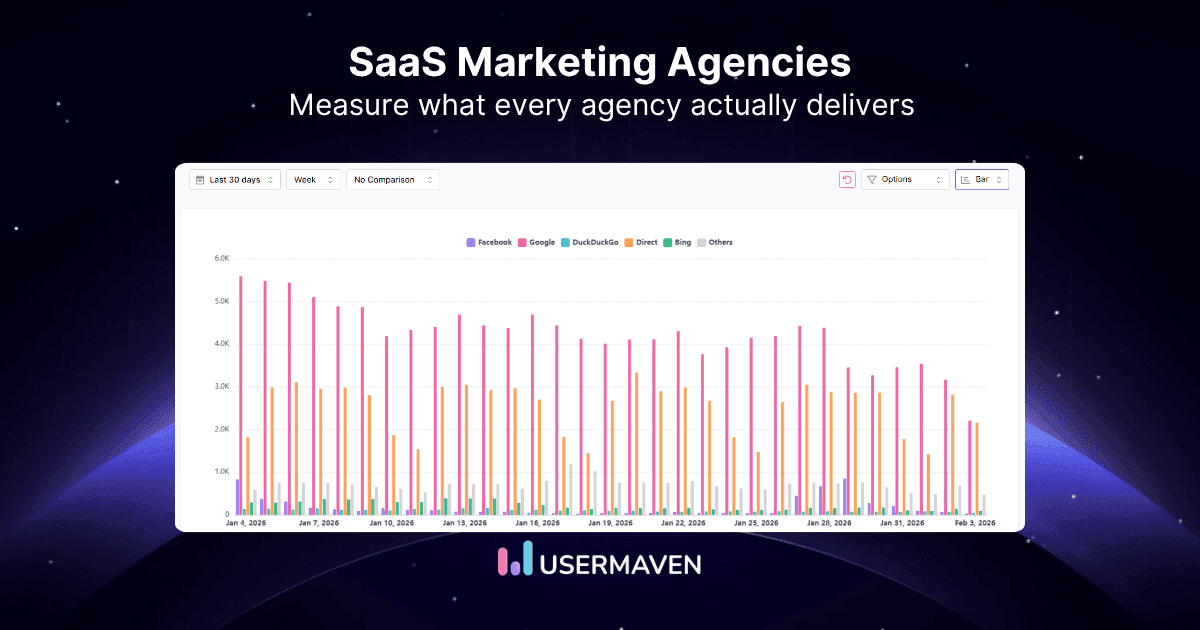
A typical SaaS buying journey has nothing to do with the classic seven touches. Today, the environment is so crowded that you need to build trust, stay visible across multiple channels, and show up everywhere your buyers are researching. Most SaaS teams do not have the resources or specialist depth to do all of this […]