The end goal of data analytics is to deliver value to users by understanding what they need and creating value for the business in the form of conversions and revenue by meeting their needs. With the rise of modern analytics approaches and tools, businesses are better able to get user insights. Event-based web analytics operates on a data model that uses events known as user actions to track metrics like page views, exits, bounces, and more.
It is different from transitional session-based analytics. This article discusses event-based analytics, how it compares with session-based analytics, and how to use it to complement funnel and segmentation analysis.
What are events and event tracking?
In the context of analytics, events and event tracking refer to the recording and analysis of specific interactions or actions that occur on a website, application, or system.
Events: An event is a specific action or activity a user performs while interacting with a website or application. Events are typically defined by developers or analysts and are triggered whenever the specified action takes place. These actions include but are not limited to the following:
- Button clicks
- Form submission
- Video views
- Downloads
- Link clinks
Event tracking is the process of capturing and recording these specific events that occur on a website or application. When an event occurs, it is logged and sent to an analytics system for analysis. This data collection provides valuable insights into user engagement, behavior patterns, popular content, conversion rates, and other metrics. Consequently, these insights help businesses and developers make informed decisions to improve their products or services.
Event tracking involves using web analytics tools like Usermaven, which represent the user data in intuitive dashboards and reports. Both events and event tracking are powerful tools for data-driven decision-making, helping businesses enhance their online presence and deliver better user experiences.
Website analytics tool for modern marketers & agencies
What is event-based web analytics?
Event-based web analytics is a methodology that uses events for tracking and analyzing user interactions and actions on a website or web application. Unlike traditional pageview-based analytics, which primarily focuses on tracking the number of times pages are loaded, event-based web analytics centers around specific user actions and activities, providing more detailed insights into user behavior and engagement.
Although the specific data and categories of events collected by event-based web analytics vary depending on the goals and objectives of the website or application, it can collect a wide range of data based on custom-defined events. Common data categories include user interactions, eCommerce actions, user engagement, user behavior flow, ad interactions, and customer events.
Session-based web analytics vs. Event-based web analytics
Both of these web analytics models offer two different approaches to tracking and analyzing user interactions on a website or web application. Session-based analytics focuses on tracking user sessions. A session is a time period starting with the first interaction of a user with your website and ending as a result of inactivity or when a user leaves the website. On the other hand, event-based analytics tracks a user’s actions while interacting with your website.
For session-based analytics tools, session start and session end are important. Some features of these platforms include traffic reporting, conversion tracking, third-party referrals, and keyword referrals.
Session-based web analytics offers a general overview of user behavior across sessions, while event-based web analytics provides more detailed and granular insights into user interactions and actions on a per-event basis. The choice between the two depends on the specific goals, website structure, and level of detail required for analysis. In some cases, combining both methodologies may be used to gain a comprehensive understanding of user behavior and website performance.
How to collect data for event-based analytics
Collecting data for event-based analytics involves setting up and tracking specific user actions or events on a website or application. The two important components in event-based analytics are the events and users. Below we discuss how you can use events to collect user data to understand them.
1. Set up custom events using APIs
For applications handling large volumes of event data, a real-time data platform for developers can provide the infrastructure needed to ingest, transform, and query those events efficiently. Businesses can use these APIs to define and set custom events. With the help of API documentation, developers can set up custom events. It requires including the necessary API calls at the appropriate points in the website’s code to trigger the events when the specified user actions occur.
For instance, if you want to track video plays on your website, you can use the analytics platform’s API to send a “Video Played” event with relevant parameters such as the video ID, title, and play duration whenever a user starts watching a video.
2. Track events with click tracking
Click tracking is a more accessible form of event tracking for non-technical users. These tools use a web-based interface to set up and manage custom event tracking without requiring direct code changes. To track events with click tracking, users can create triggers in the click tracking tool that are associated with specific user interactions (e.g., button clicks, form submissions, link clicks). When the trigger condition is met, the tool can automatically send the event data to the analytics platform.
For example, you can create a click trigger for a “Download” button. When a user clicks that button, the trigger sends a custom “Download Clicked” event to the analytics platform.
3. Track custom events with the tag manager
Tag managers implement event tracking without directly editing the website’s code. These tools allow non-technical users a user-friendly interface for managing tags, including event tracking tags. Tag managers send the data from your website to an analytics platform that collects, stores, and then analyzes the data. Marketers and website owners can create and configure custom event tracking through a series of point-and-click actions. Thus, it requires no coding skills, proving accessible to a wider audience.
For instance, you can use a tag manager to track form submissions by setting up a trigger that fires when a form is submitted. The trigger can then be associated with a custom event tag to send the event data to your analytics platform.
4. Track custom events without coding
Many modern data analytics tools like Usermaven enable businesses to track custom events. While each platform can be different regarding its features and capabilities, you can compare these tools to choose the best fit for your needs. All you need to do is to integrate the tracking code provided by your chosen analytics tool into your website or application and define the custom events you want to track. You can set up event tracking by specifying event names, triggers, and any additional parameters you want to capture. Ensure the events are recorded accurately and the data is collected for reporting and analysis.
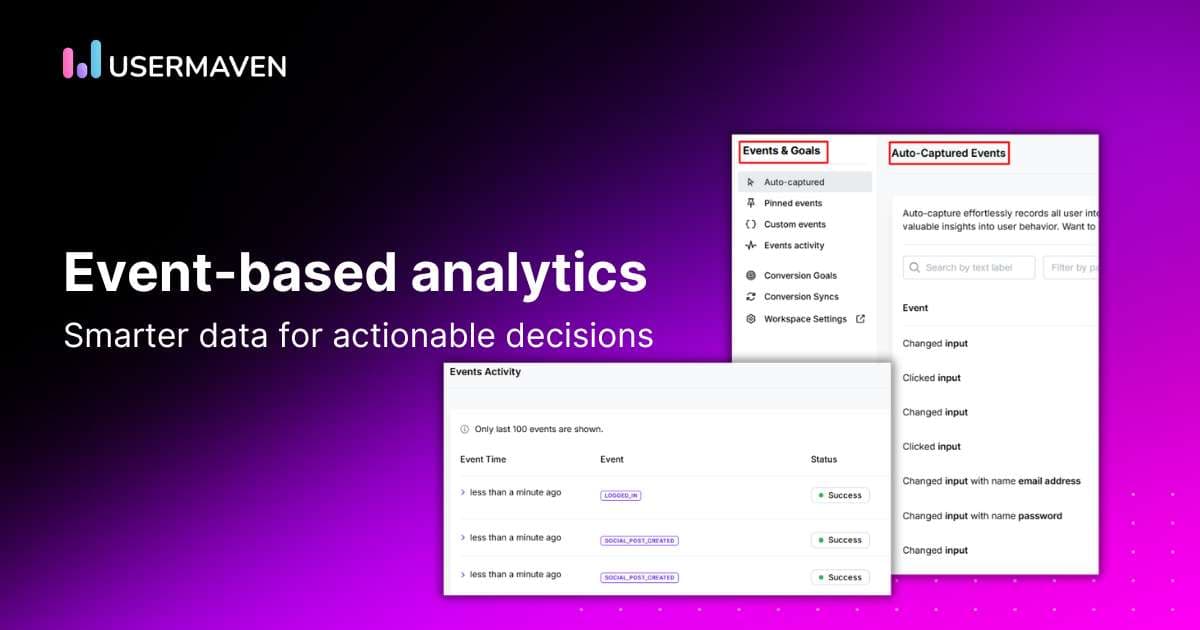
Usermaven offers a quick 5-minute, no-code setup of event tracking. It eliminates the reliance on developers for tracking events. Moreover, with Usermaven, every button click, form submission, purchase, or page visit is automatically tracked. You can also create custom events based on your unique needs. Additionally, you can group similar events, such as sign-up buttons on different website pages, and track aggregated conversions. And if you forget to track a key action after a design change? You can use retroactive data tracking to find insights from past data.
How to use event data for event-based analytics with Usermaven
Like any other data, event data is only helpful if you extract the valuable insights it holds related to user behavior and interactions.
Here’s how you can utilize event data for event-based analytics, focusing on funnel analysis and segmentation analysis:
1. Identify friction and drop-off points with funnel analysis
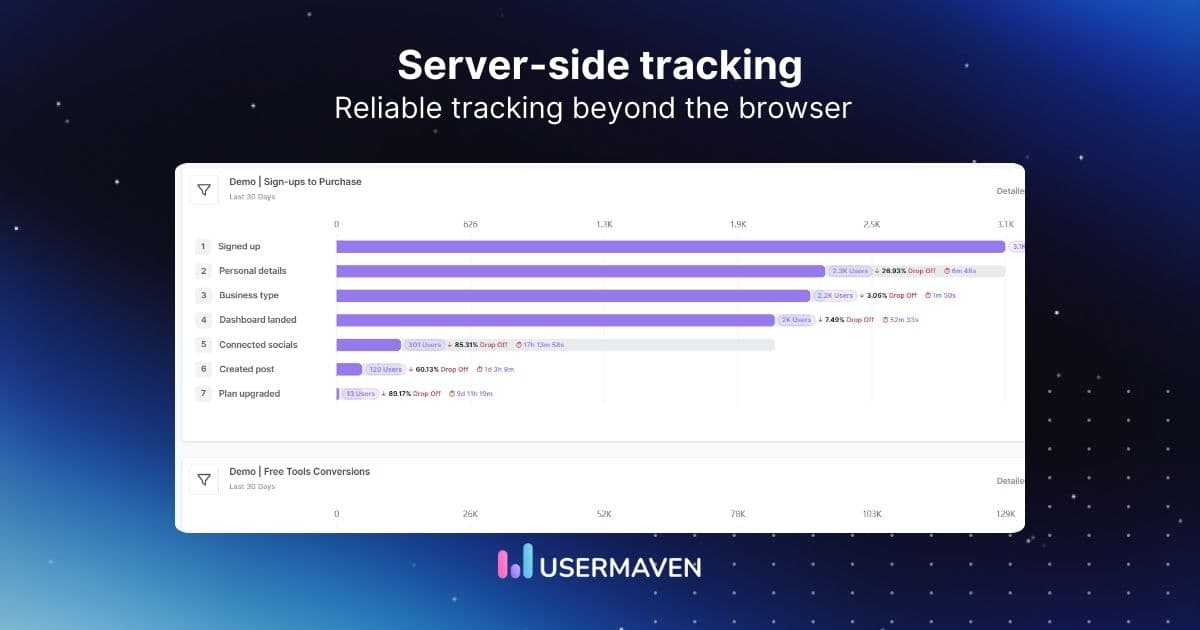
You can analyze conversion rates by tracking a funnel representing a series of events/actions your users take to reach a specific goal. Event data lets you track the number of users who perform each step in the funnel and calculate the conversion rate between each step. This analysis helps identify points in the user journey where users are experiencing friction or drop-off.
Knowing where the funnel drop-off rate is high, you can optimize the user flow, simplify processes for a seamless user experience, and improve conversions.
2. Understand user behavior patterns using segmentation analysis
Segmentation analysis allows you to analyze your event data by dividing users based on specific attributes, such as demographics, traffic sources, device types, engagement levels, or completion of specific events. Using event data, you can compare the behavior of different user segments, tailor your strategies to target specific segments effectively, personalize user experience, and enhance retention rates over time. In short, by leveraging event data, you can optimize your entire funnel and effectively utilize segmentation analysis to optimize your digital strategies for better performance and engagement.
Benefits of event-driven analytics
Event-based analytics offers the following key benefits:
- Customization: Website owners can define their own events based on their specific goals and objectives. It means you track the most relevant actions for your business or project.
- Granular insights: Event-based web analytics answers questions like “Which CTA button has the highest click-through rate?” or “Which video is the most-watched?” and more. Thus, it offers granular insights into user behavior and engagement, helping you better understand your users.
- Conversion tracking: Event-based web analytics allows businesses to measure the effectiveness of their marketing efforts by tracking conversions, like completed purchases, sign-ups, or downloads, and key performance indicators (KPIs).
- User journey analysis: With event-based web analytics, you can use events to analyze user journeys and the string of actions your users take on your website. Identifying common paths and potential drop-off points enables businesses to optimize user flow.
- Real-time monitoring: With event-based analytics, businesses can monitor real-time user interaction data. It equips them to respond promptly to user behavior, adapt marketing strategies, and address issues as they arise. Also, this way, businesses can track time-sensitive events, campaigns, or when they need to respond quickly to changing trends.
- Performance and user experience optimization: Businesses can identify user pain points, areas of high engagement, and preferences, enabling them to optimize the user experience and create more engaging and user-friendly interfaces. With data-driven decision-making, they can focus on what’s important and why. They can target performance issues such as slow-loading pages, broken links, or navigation challenges. This insight helps them optimize the website’s technical aspects and improve overall performance.
FAQs
What is event-based data?
Event-based data refers to a collection of information derived from tracking specific user actions or events on a website, application, or digital platform. These events represent user interactions, behaviors, and activities that are custom-defined and monitored to gain valuable insights into user engagement and behavior. In event-based data, each event is typically associated with various attributes or parameters that provide additional context and details about the specific action. For example, an event could be “Button Clicked,” and its attributes might include the button’s name, location on the page, and the click time.
What is the difference between event-based and session-based tracking?
Event-based tracking and session-based tracking are two methodologies used to collect and analyze user interactions on websites or applications. Their choice depends on the need for analysis and the specific goals of a website. Event-based tracking captures specific user actions or events individually, providing granular insights into user behavior and interactions. Each event is custom-defined and associated with attributes, enabling businesses to track conversions, optimize user experiences, and analyze user behavior per event. In contrast, session-based tracking aggregates data at the session level, grouping user interactions within a defined session. It offers a high-level view of user engagement during a session, making it simpler to implement and suitable for understanding overall website performance and user engagement trends across sessions.
What is event tracking used for?
Event tracking is used for various purposes in web development, digital marketing, and data analysis. Its primary purpose is to monitor and record specific user interactions or actions on a website or application. Some common uses and benefits of event tracking include understanding user behavior, performance optimization, conversion tracking, measuring marketing effectiveness, real-time monitoring of custom insights, and more.
What is event tracking?
Event tracking is the process of capturing and recording these specific events that occur on a website or application. When an event occurs, it is logged and sent to an analytics system for analysis. This data provides valuable insights into user engagement, behavior patterns, popular content, conversion rates, and other metrics that help businesses and developers make informed decisions to improve their products or services.
Updated

Written by
Lauren Brooks
Lifecycle Marketing Strategist
Lauren Brooks is a lifecycle marketing strategist with 4+ years of experience helping SaaS businesses create meaningful customer experiences. She specializes in user engagement, retention, and conversion optimization, helping brands build stronger customer relationships beyond acquisition.
All articles by Lauren →